Notice: This Wiki is now read only and edits are no longer possible. Please see: https://gitlab.eclipse.org/eclipsefdn/helpdesk/-/wikis/Wiki-shutdown-plan for the plan.
Acceleo/Profiler
Profiler
Acceleo features a profiler that can create a profiling model of the generation. In this profiling model, you can find all the instructions that have been executed, the number of time that they have been executed and the time the generation spent in those instruction. The profiler is accessible thanks to the "Profile As..." (instead of "Run As...") menu and starting with Acceleo 3.0.2 and Acceleo 3.1.0 the profiler will directly be accessible from all launch configurations and also programmaticaly.
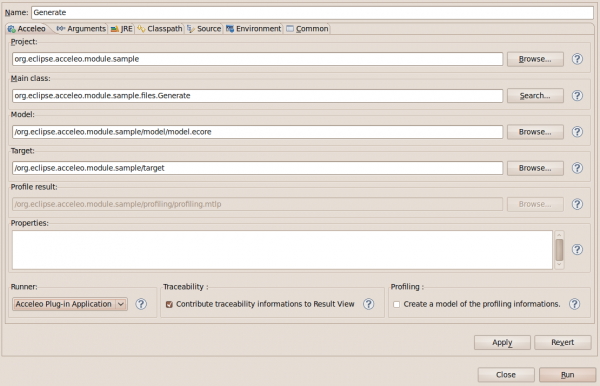
In order to activate the profiling with the new launch configuration menu, you just have to checked the profiling checkbox and then you can enter the path where the profiling model will be saved.
The profiling model
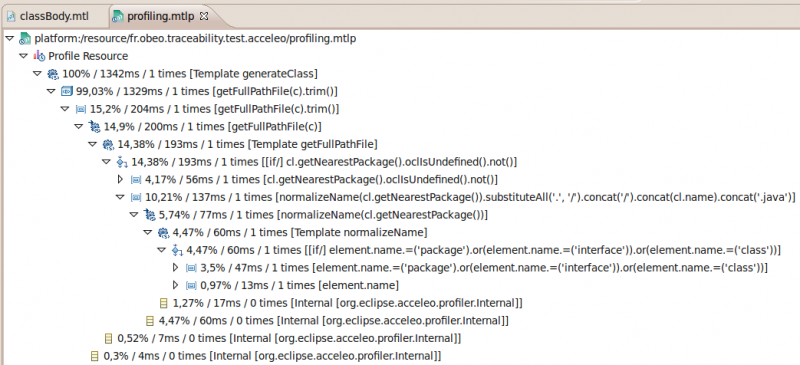
You can see in this picture the result of a generation with the profiling activated.
The profiling model is an EMF model and as such, it is compatible with all the regular EMF tooling including, of course, Acceleo. This means that you can use that profiling model as an input for a generation in order to create a report.
| Acceleo Portal | |
| Project | Project · Installation |
| Features | Acceleo Features · Runtime · Acceleo editor · Views & Perspective · Interpreter · Maven |
| User documentation | Getting Started · User Guide · Acceleo operations reference · OCL operations reference · Text Production Rules · Migration From Acceleo 2.x · Best Practices · Videos · FAQ |
| Developer documentation | Source code · How to contribute · Compatibility · MOFM2T specification · OCL specification |
| Community | Professional Support · Report a bug |


