Notice: This Wiki is now read only and edits are no longer possible. Please see: https://gitlab.eclipse.org/eclipsefdn/helpdesk/-/wikis/Wiki-shutdown-plan for the plan.
Downloadable Dengue Scenarios
Four Dengue Scenarios
This downloadable archive Four Dengue Scenarios is a folder containing four different scenarios in three different projects. They demonstrate dengue disease transmission based on three dengue models with different levels of complexity. Details of each model can be obtained in our JTB paper (Hu. et al, “The effect of antibody-dependent enhancement, cross immunity, and vector population on the dynamics of dengue fever”, 2013.) and wiki page on the Dengue Fever Disease Models.
To run the scenarios, first download the archive DengueScenarios.zip then extract the archive. You will see four subfolders, DengueVerySimpleModelTest, DengueHostVectorModelDemo, and DengueInAustralia. There are four separate STEM projects you can run. The DengueHostVectorModelDemo contains two scenarios within.
To import the project, run stem and then:
>File>Import>Existing Projects Into Workspace
>Select 'Next'
Make sure the radio button 'Select root directory' is checked (and no the archive button).
Then Browse or navigate to the parent folder 'Dengue Scenarios'.
>Select 'Next'
You can then import all three scenarios.
Project (subfolder) 1: DengueVerySimpleModelTest
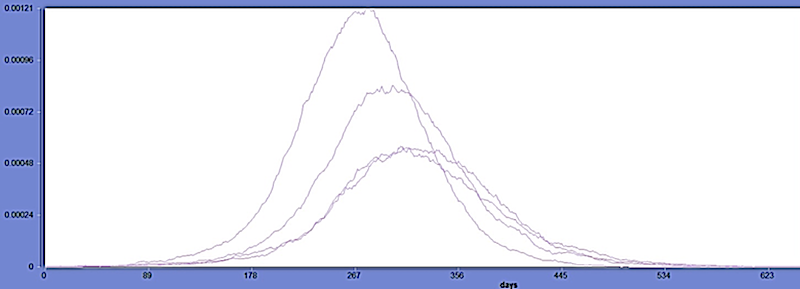
The simplest scenario adopts host only model (M1 in the paper) deploys on a single geographic area (Cuba). Using the stochastic solver, in the figure below we show the disease progression for different initial infectious (Ii) cases (by serotype). Four different infectors are used to initialize each I compartment with different values (I1: 11 cases, I2: 11 cases, I3: 12 cases and I4: 13 cases) in this example. Users can edit the infectors for their own specific experiment in the scenario.
Figure 1: A very simple Dengue model. The vector is ignored.
Project (subfolder) 2: DengueHostVectorModelDemo
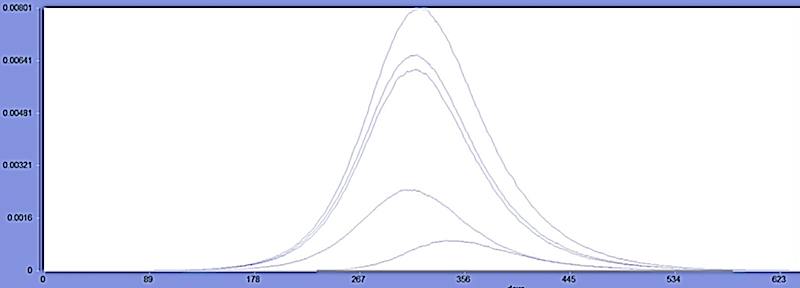
This demonstration contains two scenarios that all capture the role of vector population in the dengue disease transmission on a single geographic area. “DengueM2Scenario” employs a dengue host vector model with four serotypes but no exposed (E) compartments (see Figure 2). This is model M2 in the publication reference [1]. The “DengueM3Scenario” uses a dengue host vector full model including the E compartment (model M3 in ref [1]). This model involves solving 51 differential equations simultaneously. The disease initialization is the same with different values for each serotype (I1: 11 cases, I2: 11 cases, I3: 12 cases and I4: 13 cases). When running the scenario, users expect to see the delayed outbreak peak time but amplified peak infectious values because the vector population participates in the transmission (refer to the figure below when using M2 for dengue disease model in the scenario, noted the lowest curve shows the example of secondary infection in dengue transmission).
Figure 2: A more complex model (M2) explicitly including the vector.
Project (subfolder) 3: Dengue In Australia
In this Australia scenario, we use a geographic area with 8 nodes/districts based on the Australian map in STEM to demonstrate how disease travels across the border of neighboring districts via the human population (Humans travel more than mosquitos). The scenario uses the host-vector dengue disease model (M2). The scenario is initialized with the Australian 2006 Population 20,325,926. We also seeded the mosquito population with 4,827,407.425 on average in each region, which is 1.9 (m, vector per host parameter) times of average human population: 2540740.75. Different strains/serotypes are initialized in only one of eight locations. Particularly in this scenario, we initialized 3 our of 4 strains out 4 the dengue virus: I1 is initialized with 100 cases in Queensland (AU-QL), I2 is initialized with 100 cases in New South Wales (AU-NS), and I3 is initialized with 80 cases in Northern Territory (AU-NT). The numbers here are only used for purpose of demonstration, which does not imply any real reports of dengue in Australia. The scenario runs for one year defined by the sequencer used. At day 102, one observes that different dengue strains initialized in only one region have already propagated to multiple regions in Figure 3 show below.
Figure 3: A model of Dengue Transmission across regional boundaries


