Notice: This Wiki is now read only and edits are no longer possible. Please see: https://gitlab.eclipse.org/eclipsefdn/helpdesk/-/wikis/Wiki-shutdown-plan for the plan.
Dengue Disease Transmission Model
These three models are published in our journal paper on Journal of Theoretical Biology in 2013. [1] The STEM Download Page contains an archive with 4 different dengue scenarios (including each of the models below). Documentation may be found on the page Downloadable Dengue Scenarios
In recent decades, dengue has become a major international public health concern, particularly in countries in Southeast Asia, the Americas, Africa and Western Pacific [2]. Dengue Fever (DF) is now endemic in more than 100 countries and impacts more than one-third of the world’s population. Where climate is ideal for the mosquitoes responsible for DF transmission, it has seen a 30-fold increase in dengue incidence during the past 50 years [3]. Dengue is now a leading cause of childhood hospitalization and death in Southeast Asia [4].
As a vector-borne viral disease, the spread of dengue is attributed to the expansion of the geographic distribution of the four serotypes of dengue viruses (DENV1-4) and their vector Aedes mosquitos, especially, the predominantly urban species Aedes aegypti. The four dominant strains of dengue viruses (DENV) have progressively spread to virtually tropical countries around the globe [5]. Infection with one serotype affords life-long immunity to that serotype, but only temporarily partial immunity to the other three (CI). Patients re-infected with a different serotype face an increased the risk of developing dengue hemorrhage fever (DHF) and dengue shock syndrome (DSS). This increased risk has been attributed to the effect of antibody dependent enhancement (ADE) [6]. Due to ADE, the infectious host sheds more viruses making the infection much more acute. Changing climate and a rapid rise in urban mosquito population is bringing ever greater numbers of people into contact with DF, especially in areas that are favorable for mosquito breeding, e.g., areas where household water storage is common and where solid waste disposal services are inadequate. For countries where dengue is not endemic, it can be brought in through international traveling, migration, and trade. No specific vaccine or cure is available, so disease control is mostly based on prevention through the eradication of vector populations.
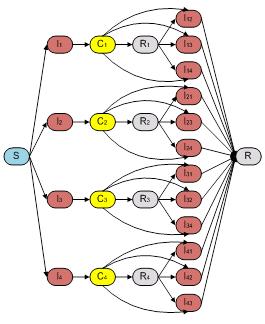
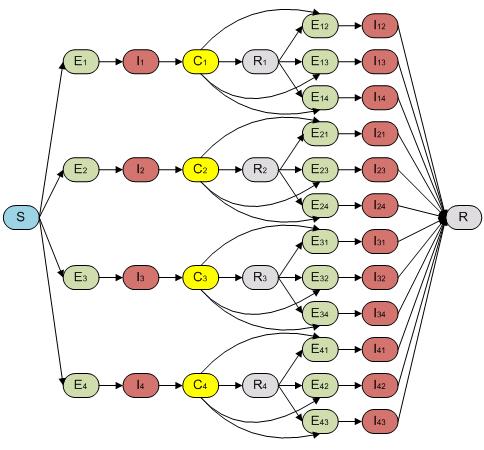
Bianco et al.[2] reported an ordinary differential equation (ODE) model to explore the interplay of the effect of partial temporary cross-strain immunity and antibody-dependent enhancement (ADE) in multi-strain disease. We implemented this model as our base model called "Dengue Fever Host Only Model" in STEM (see Fig. 1 and Eq. 1) with 26 compartments. A host only model is often used (and mathematically appropriate) when the vector population is so large that fluctuations in the density of vector do not significantly impact the disease parameters. However, strategies to control dengue fever often target the vector population. Furthermore, seasonal variation in vector density and incubation of the virus within infected vectors could well affect dengue dynamics in large parts of the world. For these reasons, we suggest it may be more realistic to extend the host only model to a host vector model.
Fig. 1.The compartmental model of host population used in Host Only Model which is proposed by Bianco et al.[2]. It is composed by 26 compartments that capture the basic framework of disease progression for host population.
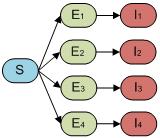
Aedes aegypti is one of the most efficient vectors for arboviruses because it is highly anthropophilic, frequently bites several times before complete oogenesis, and thrives in close proximity to humans (WHO website, 2009). Dengue is transmitted mainly by adult female Aedes mosquitoes that require a blood meal for the development of eggs. The Dengue Fever Host Vector Model in STEM captures dengue transmission in the vector population with nine compartments describing infection by four serotypes (see Fig. 2) in addition to host only model in Fig. 1.
Fig. 2.The host vector compartmental model in STEM. It is composed by 35 compartments that capture both host (human) and vector (mosquito) populations during the dengue disease progression. The compartmental model of vector population is composed by nine compartments that capture the basic framework of disease progression for vector population. It is assumed that the vector population never recover from infection unless die.
We built our so called “full model” in order to capture both incubation and disease transmission through a mosquito vector population. In this case, our model could facilitate the study of how inclusion of the vector population affects the dynamics and the interplay between ADE and CI in models of varying complexity. It is reported that the incubation time for human after contracting dengue virus is around two to seven days [7]. This time span is long enough that it could have a significant effect on the Dengue dynamics. For this “full model”, the host population therefore follows an SEIR-type epidemiological model including all four serotypes and re-infection as shown in Fig. 3.
Fig. 3. The compartmental model of “full model” which captures the incubation period of both first and second infection of host population.
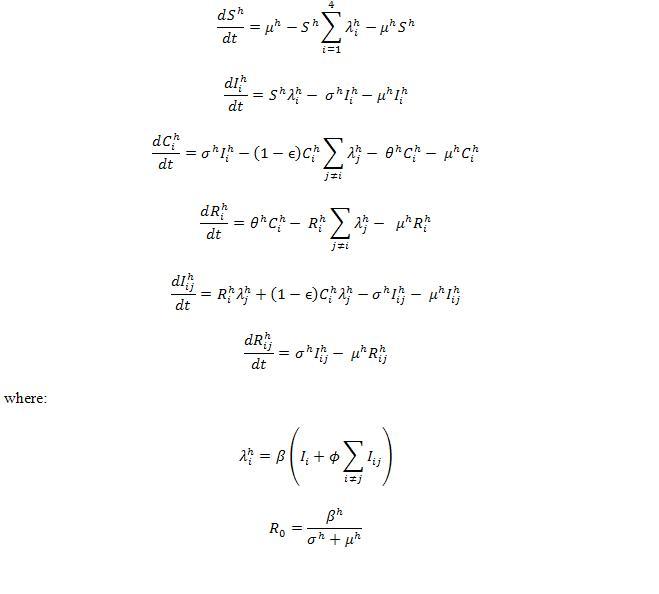
The structure of “full model” is composed by 51 compartments ((as seen in Fig. 1 and Fig. 2)) including both host (Fig. 1) and vector populations (Fig. 2). The population sizes are to be normalized to unity, so each state represents a fraction of the total population. We assume that recovery from an infection of any DENV provides permanent immunity against this particular serotype, but can lead to an enhanced re-infection of other serotypes, after which the individuals acquire complete immunity against all four serotypes. Enhancement of susceptibility is the hypothesis that cross-reactive antibodies resulting from previous exposure increases the likelihood of infection when an individual is exposed to a second serotype.[5] With this assumption, the populations were divided into the following states. S denotes the fraction of the population that has not yet been infected by any of the serotypes and is thus totally susceptible; Ei is the proportion of the exposed population infected by serotype i without shedding any viruses (for model 3 includes latency); Ii is the proportion of the population infectious to a primary infection with serotype i ; Ci is the proportion of the population recovered from a primary infection and temporarily immune to all serotypes; Ri is the proportion of the population recovered from a primary infection with serotype i and susceptible to serotypes other than i; Eij is the proportion of the exposed population who recovered from serotype i but currently infected by serotype j but haven’t shedded any virus of j; Iij is for secondary infection, in which individuals are infectious with serotype j, but recovered from infection with serotype i. Finally, R is the proportion of completely immune (those who have recovered after being exposed to two serotypes). The equations are given in the detailed descriptions of our model as follows.
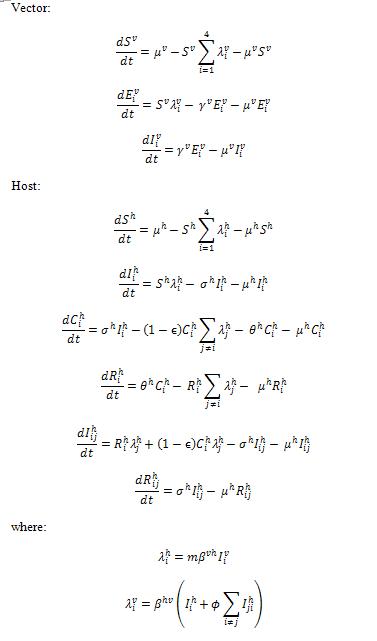
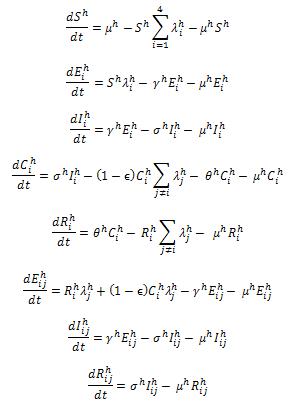
For the host population, the ordinary differential equations used in our model are given as below.
where:
We define two infection rates in terms of additional vector population: is the infection rate of susceptible hosts for serotype i.
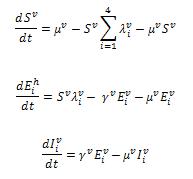
is the infection rate of susceptible vectors for serotype i. Formulations of vector part are shown,
where:
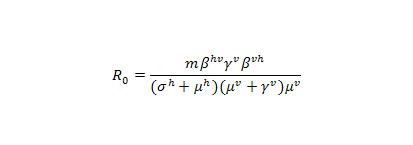
It is noted that the basic reproductive number R0 is not an independent parameter in our models, but depends on several of the epidemiological parameters. For notation, we define, R0 here as the mean number of infectious hosts generated by a primary infectious host [7] after we incorporated vector population. In our model, which includes host-vector transmission was well as an exposed state to study the effects of dengue incubation in human, the calculation of the effective host-host transmission rate becomes slightly more complex. The number of exposed vectors generated by one primary infectious host is and
of the vectors become infectious, where m is the number of vectors per host,
is the transmission rate from host to vector,
is the vector incubation rate,
is the host recovery rate,
is the host birth and death rate, and
is the vector birth and death rate. Again, the superscript h, represents host population and superscript v denotes the vector population. In turn, each of the infectious vectors generates
infectious hosts. R0 is also multiplied by the probability that the exposed host population could survive their incubation period
. Therefore, the basic reproductive number R0 for host-host transmission in a host-vector model becomes :
We note that this expression does not depend on the ADE factor, or the strength of cross immunity, ε.
Reference:
- Hu, K., Thoens, C., Bianco, S., Edlund, S., Davis, M., Douglas, J., et al., The effect of antibody-dependent enhancement, cross immunity, and vector population on the dynamics of dengue fever. Journal of Theoretical Biology, 2013. 319(0): p. 62-74.
- Bianco, S., L.B. Shaw, and I.B. Schwartz, Epidemics with multistrain interactions: The interplay between cross immunity and antibody-dependent enhancement. Chaos, 2009. 19(4): p. 9.
- Recker, M., et al., Immunological serotype interactions and their effect on the epidemiological pattern of dengue. Proceedings. Biological sciences / The Royal Society, 2009.
- Cummings, D.A.T., et al., The Impact of the Demographic Transition on Dengue in Thailand: Insights from a Statistical Analysis and Mathematical Modeling. Plos Medicine, 2009. 6(9).
- Halstead, S.B. and E.J. O'Rourke, Antibody-enhanced dengue virus infection in primate leukocytes. Nature, 1977. 265: p. 739.
- CDC website. http://www.cdc.gov/dengue/. 2012.
- Chowell, G., et al., Estimation of the reproduction number of dengue fever from spatial epidemic data. Mathematical Biosciences, 2007. 208(2): p. 571-589.

