Notice: This Wiki is now read only and edits are no longer possible. Please see: https://gitlab.eclipse.org/eclipsefdn/helpdesk/-/wikis/Wiki-shutdown-plan for the plan.
Triggering interventions
Interventions in STEM
Interventions (available since the 1.2.1 release) are used to control some aspect of a disease outbreak, down to regional level if desired. Examples include initiating a vaccination program, isolating infected individuals, implementing social distancing, evacuation of a region, shutting down air transportation (for a county, state or a whole country), closing a road or preventing mixing of infected individuals across borders.
STEM uses triggers, predicates and modifiers to implement interventions. A trigger contains predicate which, when satisfied, invokes one or more modifiers that changes some aspect of a running simulation. When the predicate is not satisfied any longer, the modified entities are set back to their original values.
STEM currently supports two types of predicate tests, which can be combined using boolean expressions. The tests are:
- Elapsed Time Test - Used to modify some aspect of a scenario after a given period of time has elapsed in a simulation.
- Label Value Test - Used to test the value of a disease, disease state, or population label in a region
Observe that predicates are evaluated at each whole time step (e.g. day), and not during each incremental or fractional step when using the integrating solver (Runge Kutta).
Social Distancing Example
Basic Intervention
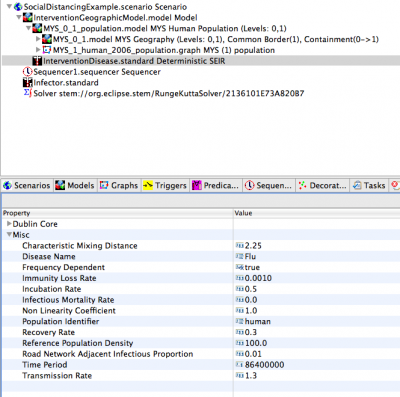
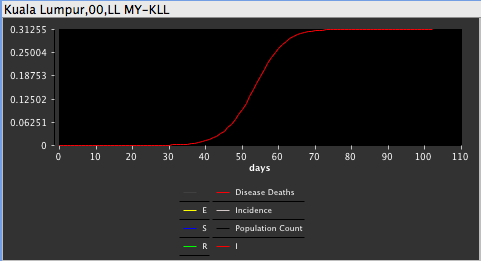
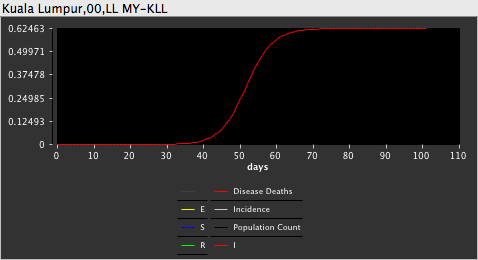
In the first example, we want to control an outbreak by implementing some sort of social distancing after a certain period of time has elapsed. We already have a scenario set up of an outbreak occurring in Malaysia, starting in Kuala Lumpur:
Creating a Predicate
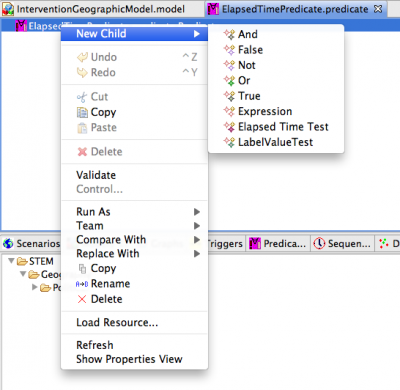
First create a new predicate by selecting the 'New predicate' button in the toolbar. Give it a name, e.g. "ElapsedTimePredicate". The editor for the predicate will open in a new window. Right click on the predicate and select "New Child", then "Elapsed Time Test":
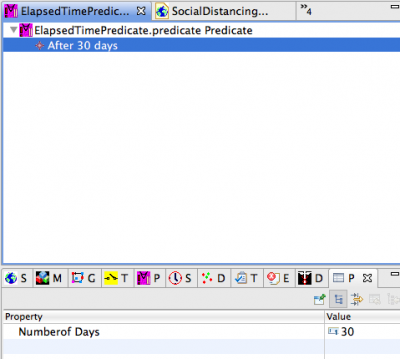
Next, we need to specify the number of days we want to wait. Open the Properties sheet and enter '30' for the 'number of Days' property:
Now we need to determine what we want to modify in the scenario after 30 days have elapsed. Social distancing (e.g. distributing face masks, closing public buildings) reduces the transmissibility of an outbreak, so changing the transmission rate in the disease makes sense. In this hypothetical case, reducing the transmission rate from 1.3 to 0.3 ensures that the reproductive number falls below 1.0 and the outbreak should be halted. The actual magnitude of the transmission rate reduction depends on the policy and the disease (and would take research to discover).
Creating the Modifier
Please Observe: Modifiers are used by STEM for two different purposes. When used in a {predicate,modifier,trigger} tuple, the modifier you
create should specify a single change in value (and not a series of values). The latter is used when running batch "experiments" only.
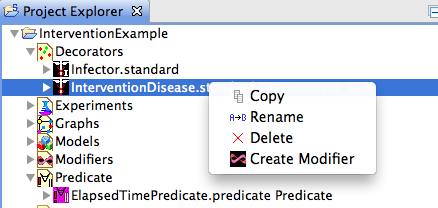
To create a modifier for a disease, right click on on the disease in the project explorer and select "Create Modifier":
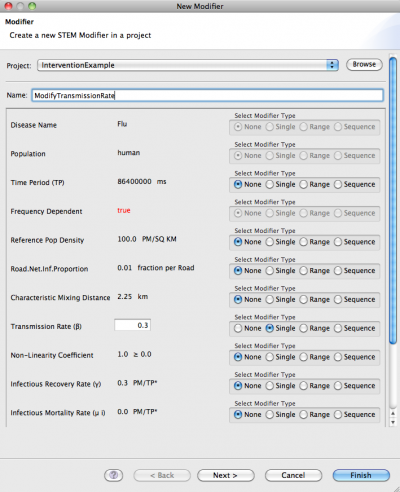
The wizard for creating modifiers opens up. On the row for "Transmission Rate" (scroll down if needed), and in the column for "Select Modifier Type", press the "Single" option (the "Range" and "Sequence" options are only used in STEM Experiments). Enter 0.3 for the new value of transmission rate and then "Finish":
Creating the Trigger
Now we need to create a trigger that will contain our predicate and modifier. Select the "New Trigger" button in the toolbar and give it a name (e.g. "SocialDistancingTrigger"). Drag the predicate and the modifier from the project explorer into the trigger:
Finally drag the trigger into the scenario:
When you run the scenario, you'll notice how after 30 days the outbreak is halted.
More Advanced Predicates
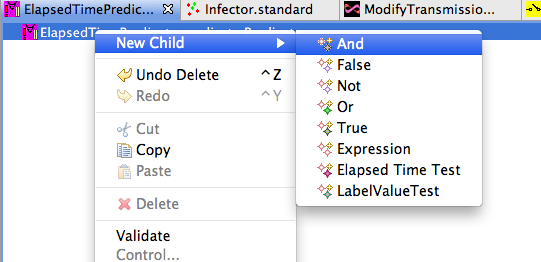
Now, let's say we want to only implement social distancing for a period of time. This is common since social distancing measures usually have economic impact. For instance, in Mexico City during the swine flu outbreak in 2009, restaurants, schools and public buildings were closed for approximately two weeks. While the outbreak was slowed down by that action, it bounced back when businesses re-opened again. Implementing social distancing for only a period of time can be accomplished in STEM simply by modifying the predicate we just created. We can use a boolean expression using an 'AND' clause and a 'NOT' clause. First, delete the Elapsed Time Test under your 'ElapsedTimePredicate'. Next create a new child under 'ElapsedTimePredicate' by selecting 'And' from the popup menu:
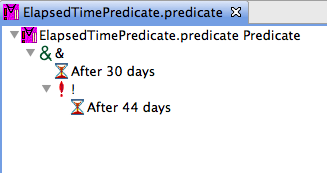
Now right click on the & symbol and select "New Child" then "Elapsed Time Test". Use the properties sheet to set the number of days to 30. Right-click on the & symbol again, select "New Child" then "Not". Finally right-click on the ! symbol, select "New Child" then "Elapsed Time Test". Set the number of days to 44 in the properties sheet for the new elapsed time test (so the window of reduced transmissibility will be 2 weeks). In the end, it should look like this:
When you run the scenario again, you'll notice how the outbreak at first is halted after 30 days, but that it bounces back later since the social distancing policy stops:
Vaccination Example
In the social distancing example above, a reduction of the transmission rate applied globally and equally in all regions. In STEM, it is possible to handle interventions on a regional level by adding a control graph to your model. A control graph contains intervention labels that supports:
- Vaccinations - The total number of vaccinations carried out in a region in a time period. The time period is the period specified in the disease model (i.e. the same time period used for rate parameters).
- Isolations - The total number of patients isolated in a region in a time period.
When a developer implements a disease model in STEM, it is up to the developer to determine how vaccinations and isolations should be handled. This can be done using the vaccinations and isolations functions, see the discussion of "STEM Expression Language Functions" [[1]]. Currently, for the deterministic SIR and SEIR models, vaccinations move people from the susceptible compartment to the recovered compartment, and isolations move people from the infectious compartment to the recovered compartment. Observe that in a more realistic model, vaccinations and isolations should have compartments of their own.
Creating a Control Graph
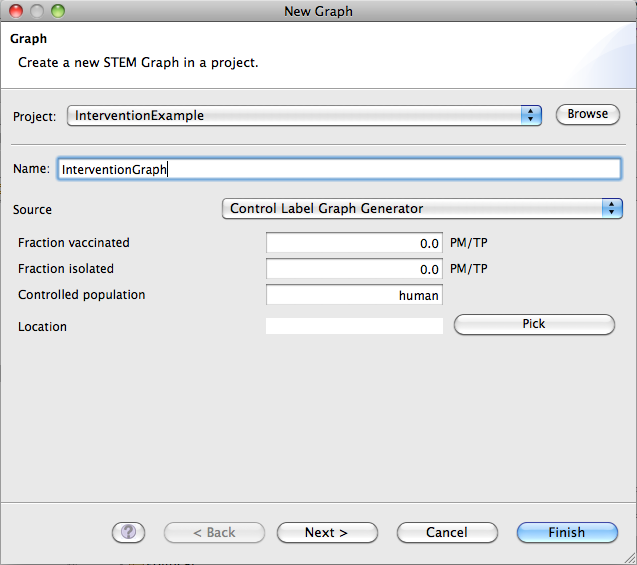
First, to add a control graph to your model press the "Define a new graph" button in the STEM toolbar and from the Source drop-down select "Control Label Graph Generator":
You have the option of entering values for the Fraction vaccinated and Fraction isolated. It is assumed that your project already has a model containing regional population graphs with population data. The new control graph will contain intervention labels for each region that exist in any model of your project, and the number of vaccinations/isolations in each region is the local population scaled by the fractions specified. If you only want to create a control graph for a subset of the regions in your model, you can pick a location and intervention labels will only be created for that region and any regions contained within.
For now, we will keep the Vaccinated and Isolated fractions as 0 meaning that no intervention are in place initially. We will change this later by a trigger in our scenario. Give the new control graph a name (e.g. InterventionGraph) and click 'Finish'. Ignore any warning messages that show up here.
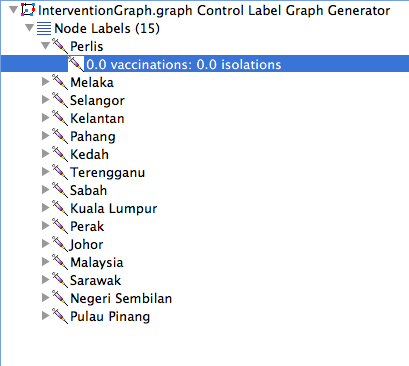
Given that our project contained a model of Malaysia, the new InterventionGraph.graph should have intervention labels for the 15 regions in Malaysia with vaccinations and isolations set to 0 each each region:
Next, drag the InterventionGraph into the model in your scenario and save the model:
Interventions in a Specific Region
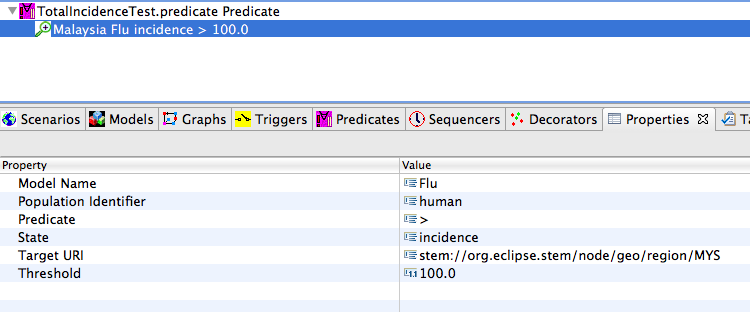
We now have the capability needed to implement interventions at a regional level, but so far no interventions are taking place. Let's say we want to start a mass-vaccination program when the total number of daily cases showing up in Malaysia goes above a threshold, say 100. First, we need to create a new predicate of the type 'Label Value Test'. Use the toolbar in STEM to create a new predicate, give it a name (e.g. "TotalIncidenceTest'). Next, right click on the new predicate, select "New Child", then "LabelValue Test". Select the new "Label Value Test" item in the editor and then open the property sheet. For the Model Name, enter the name of your disease (in this case 'Flu'). Observe this is the disease name attribute specified in your disease model, not the name of the disease file. Keep the Population Identifier as 'human', Predicate '>' (can be >, <, >=, <= or =), State 'incidence' (this is the value we want to test), Target URI 'stem://org.eclipse.stem/node/geo/region/MYS' (the URI of the target node, in this case Malaysia. You can find the URI from the Identifier Dublin Core attribute of the node in the graph containing the level 0 node of Malaysia. Keep the threshold at 100.
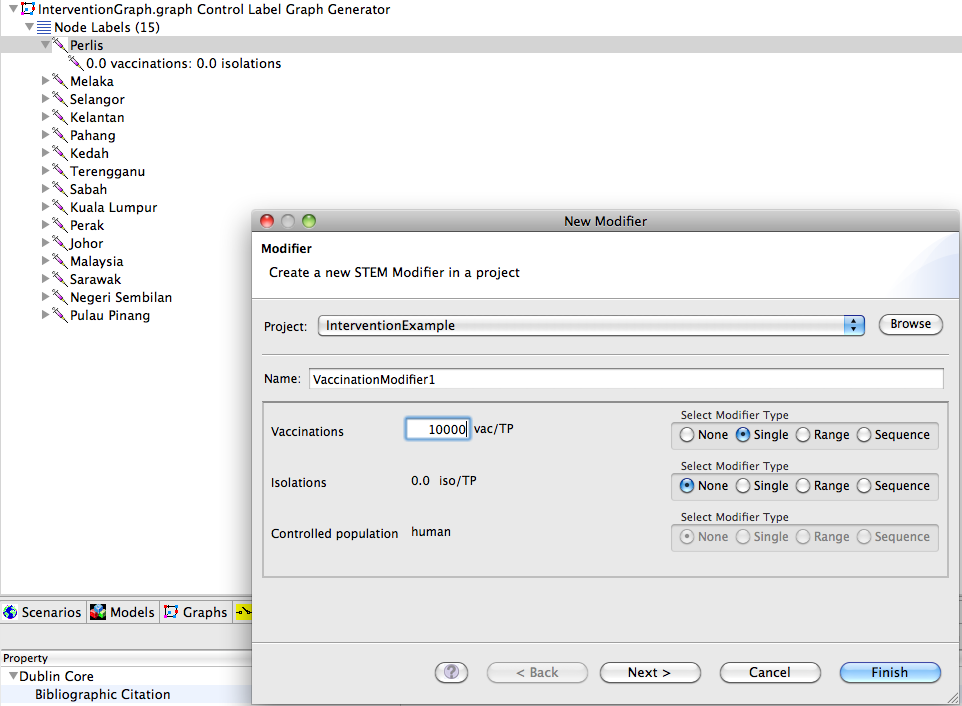
The new predicate aggregates the total incidence in all of Malaysia and when it goes above 100 total cases per day the predicate is satisfied and modifications are triggered. We want to implement a mass vaccination program, and to do this we increase the vaccination rate in each of the 15 regions from the current value of 0 to 10,000 (in reality the number should match the actual capacity which depends on the number of hospitals and clinics available in each region). We create 15 new modifiers for the vaccination labels in our InterventionGraph.graph file. Open the file in the editor, right click on the vaccination label (one at a time) then select "New Modifier". Give it a name, e.g. 'VaccinationModifier1", select Modifier type as 'Single' then enter 10000 for the number of vaccinations. Click finish. Repeat 15 times for each vaccination label in Malaysia.
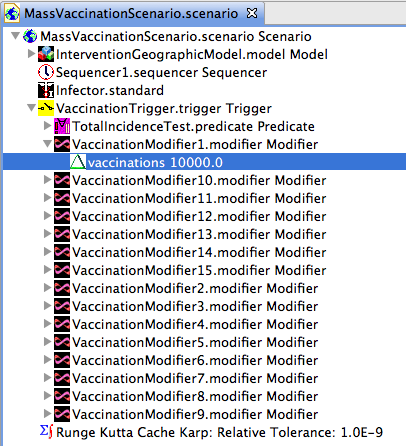
Finally, create a new Trigger (using the New Trigger button in the toolbar), drag your predicate and the 15 modifiers into the trigger, then drag the trigger into your scenario.
When we run the scenario with the mass vaccination trigger, we get a dramatic difference in the total disease deaths at the end of the outbreak:
Periodic vaccinations
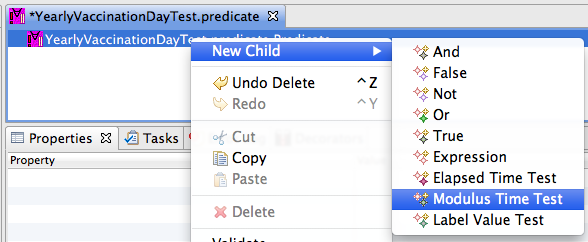
It's also possible to implement periodic vaccination programs (e.g. "vaccination day"). You can accomplish this by creating a "Modulus Time Test" predicate and insert into your trigger.
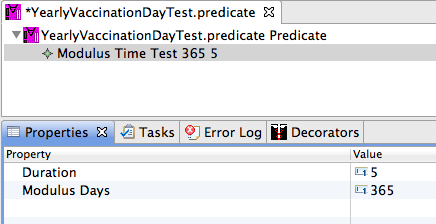
You need to specify two attributes for the Modulus Time Test predicate. "Modulus days" specifies how frequently you want the trigger to be invoked. So if you enter 365 your trigger is invoked every year. "Duration" indicates for how many days after the trigger is invoked to keep invoking the trigger. So if say you enter 5, the trigger will invoke every year for 5 consecutive days. This makes it possible to implement a yearly 5 days vaccination program.
Importing vaccination data from an external file
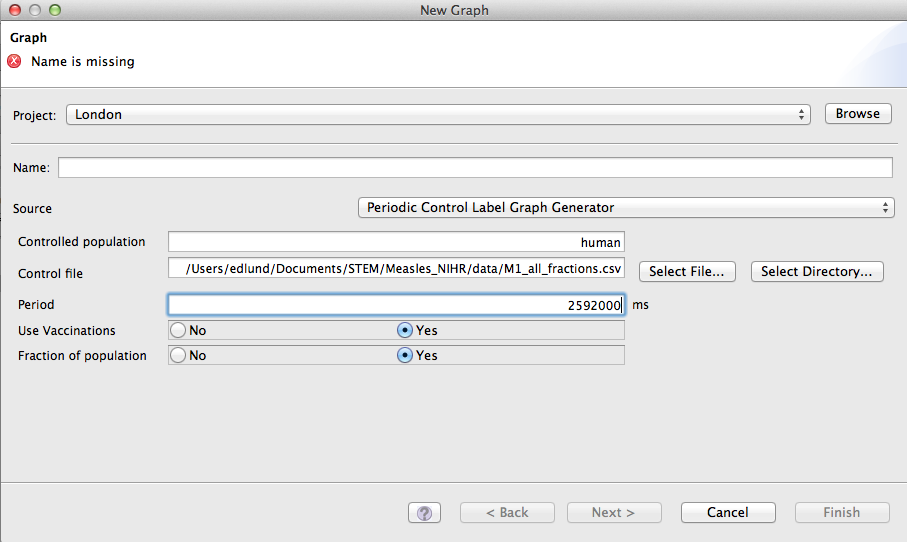
New in STEM 2.0, you can import a time series of vaccination data from an external file using the "Periodic Control Graph Generator" import function:
Specify the name of the population in the Controlled Population field, and then pick a .csv file containing vaccination (or isolation) data by entering a path in the Control file field (Use the Select File button to navigate to the file on your file system). The format of the file is a comma separated value (csv) structure, where each row contains either a fraction of the population vaccinated or the total number of population members vaccinated. Here is an example of how such a file might look like:
US-VT-50013-67000,US-VT-50027-77500,US-VT-50021-16825,US-VT-50021-75925
0.2, 0.3, 0.1, 0.4
0.3, 0.3, 0.12, 0.15
                            ...
In the Period filed you enter the time step used in the file (in ms). Finally, you indicate whether the data is vaccination data or isolation data as well as whether the file contains fractions of population or absolute counts. Any disease model that is taking vaccinations or isolations into account will automatically use the data in the generated graph once it's dragged into a model.
Evacuation Example
You can evacuate people from a region by modifying the rate at which people migrate to other regions. In this example, we will outline the steps to recreate the example scenario you can download here: [[2]]. The scenario contains two regions (simple square regions generated by the graph generator) connected via migration edges. One of the regions has a hospital, and a disease outbreak occurs in the region without a hospital. When the daily incidence reaches a critical threshold, the migration rate to the hospital increases and the migration rate to the infected region is set to 0. Also, the daily vaccination rate at the hospital is increased from 50 to 100 vaccinations / day.
Setting up the Scenario
First, create a scenario (EvacuationDemo) and then three models named EvacuationGeography, EvacuationDisease and EvacuationPopulation. EvacuationGeography contains all the geographic data (square regions, migration edges) as well as the hospital graph. EvacuationPopulation will contain EvacuationGeography as well as a background model for the human population (background births and death rates). EvacuationDisease will contain EvacuationPopulation and the disease model itself.
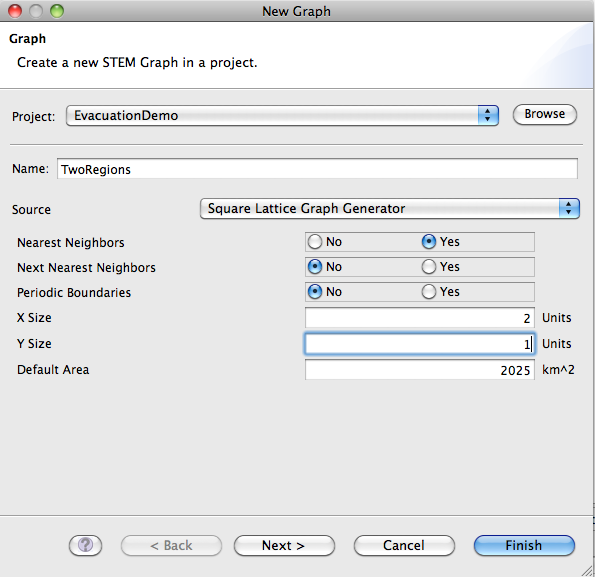
Now we create the two square regions. Select the "New Graph" button in the toolbar and in the drop-down pick the "Square Lattice Graph Generator". Fill in the values and buttons like this:
Adding Migration Edges
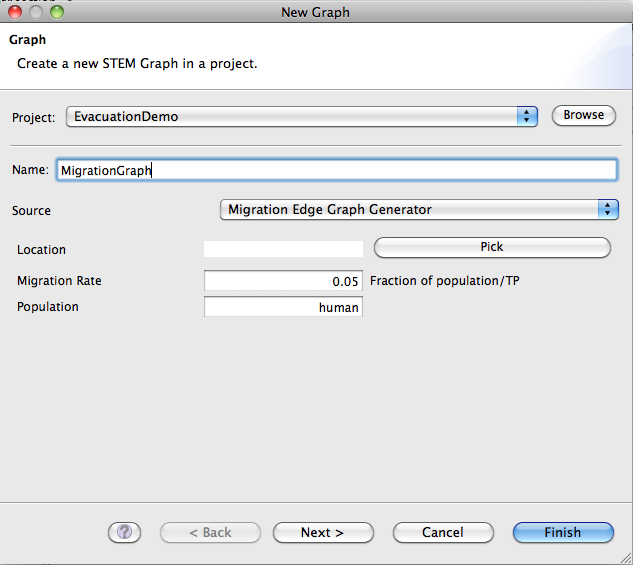
Drag the generated square lattice graph into the EvacuationGeography model. Open up the "New Graph" wizard again and this time select the "Migration Edge Graph Generator" in the drop-down. Fill it in like this:
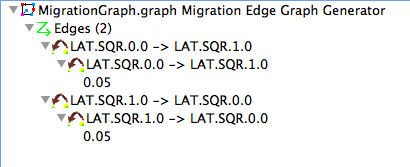
A new migration graph should open up with two symmetrical migration edges:
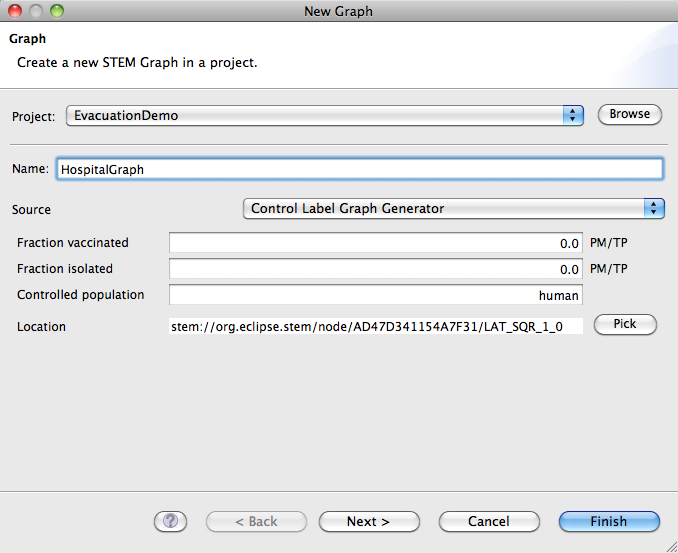
Drag the new migration graph into the EvacuationGeography model. Next, open the "New Graph" wizard a third time and select the "Control Label Graph Generator" in the drop-down. Fill it in as such (use the location picker and use the option "Select Within Project" and then pick the LAT_SQR_1_0). Leave the fractions as 0:
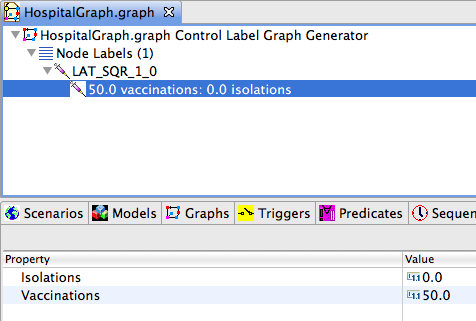
Expand HospitalGraph in the editor a navigate down to the item for vaccinations/isolations. Use the property sheet to change the vaccinations to 50 and then save the graph.
Drag HospitalGraph into the HospitalGeography.
Initializing the Population
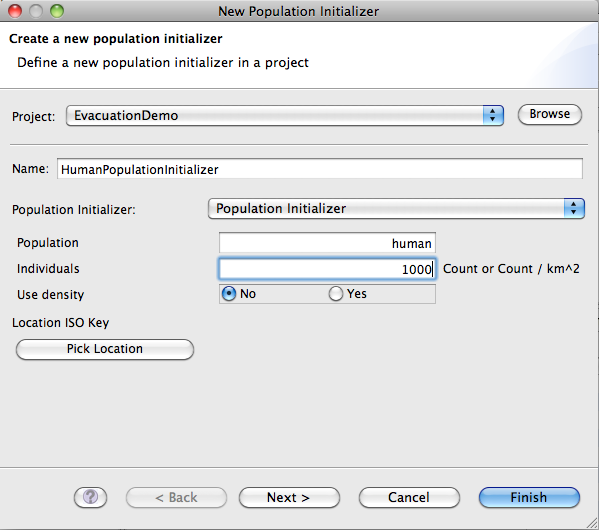
Next, use the "Define New Population Initializer" button in the toolbar and create an new instance of Population Model like this:
Drag the new population initializer into the EvacuationGeography model. EvacuationGeography should now look like this:
Next we need a background model for the human population (background birth/death rate). Use the "Define a new Population Model" button in the toolbar to create a new instance of a Standard Population Model (named HumanPopulationModel). Set the background birth rate and mortality rate to any values you like. I'm leaving them at 0.
Creating the Disease Model
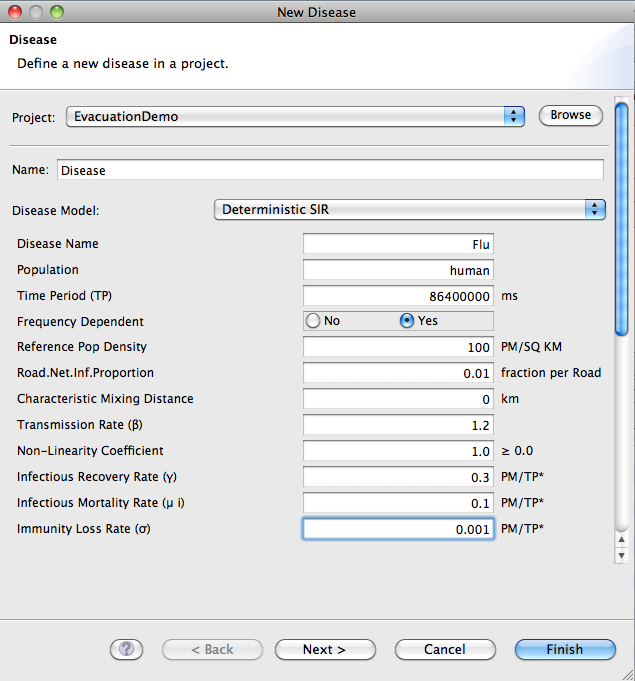
Finally we need a model for the disease. Use the "Define a new Disease" button and create an instance of Deterministic SIR. Name the disease 'Flu' and fill in the values for the disease parameters. I used these values:
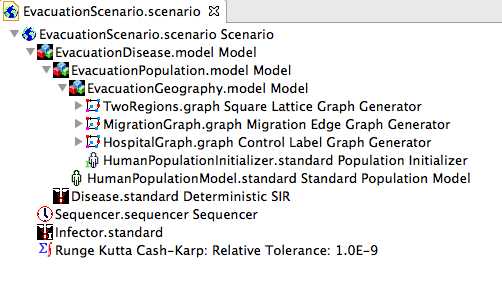
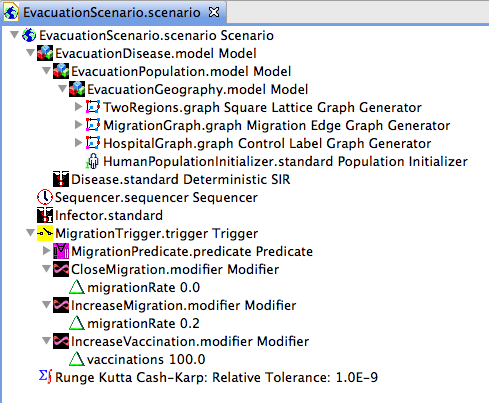
Now we have most things we need to build a working scenario. Drag the new population model (HumanPopulationModel) into the EvacuationPopulation.model file and also drag the EvacuationGeography into the EvacuationPopulation.model. Drag the disease (Disease.standard) into the EvacuationDisease.model file and the EvacuationPopulation.model file into the EvacuationDisease.model. Add EvacuationDisease.model to your scenario and create a new Sequencer (that runs forever) and a new infector that infects 1 person in the region LAT_SQR_0_0 (use the location picker and select "Within Project" to pick this region). Drag the sequencer and the infector into your scenario. In the end, you should have a scenario organized like this:
You can run this scenario and you'll notice how the disease spreads (via migration) from the infected region to the non-infected region. Now we want to implement the intervention. Create a new Trigger ('MigrationTrigger') and a new Predicate ('MigrationPredicate'). Right-click on the new predicate and select "Add Child", then "Label Value Test".
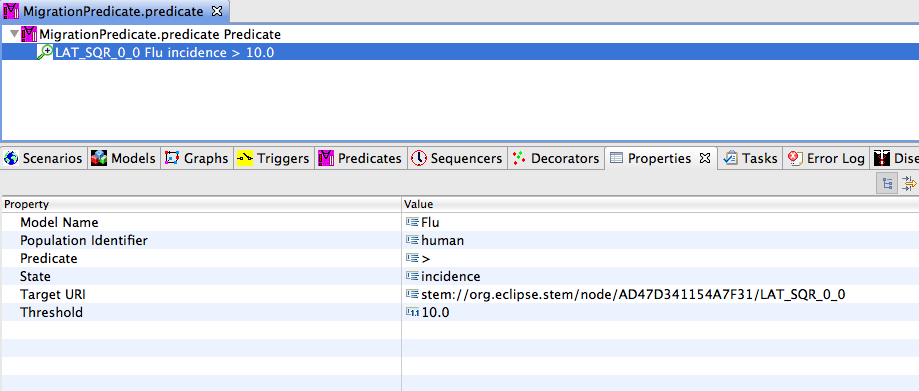
Fill in the values of the test in the properties sheet as follows:
(the TargetURI contains a part that is auto-generated. If you open your square graph (TwoRegions.graph) then select the LAT_SQR_0_0 node you'll find the correct URI to use under the Identifier in the Dublin Core). Drag the new predicate into the trigger you just created.
Modeling Evacuations
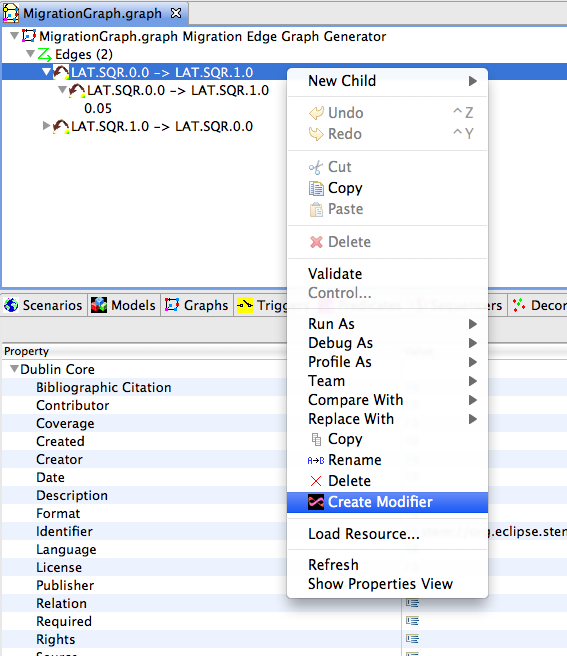
We want to increase the migration from the infected region (LAT_SQR_0_0) to the region with a hospital (LAT_SQR_1_0). To do this, open up the migration graph (MigrationGraph.graph), then right click on the edge with the name "LAT.SQR.0.0 -> LAT.SQR.1.0", select "Create Modifier":
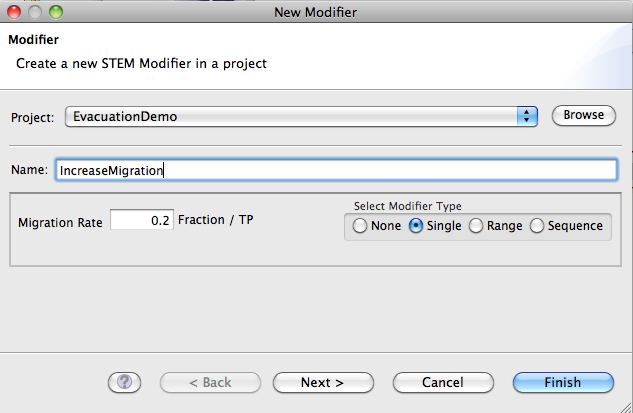
Give the modifier a name and change the Migration Rate to say 0.2:
Repeat the process, i.e. create a modifier for the edge named LAT.SQR.1.0 -> LAT.SQR.0.0 and set the migration rate to 0 (shut down the migration). Drag the two modifiers into your trigger. We also want to increase the vaccination capacity at the hospital in the LAT.SQR.1.0 region. Open the hospital graph (HospitalGraph.graph) and create a modifier for the LAT_SQR_1.0 vaccination label changing the Vaccinations from 50 to 100. Drag this modifier into your trigger and then drag the trigger into your scenario. The scenario should look like this:
If you run the scenario, you'll see how the population count drops in LAT.SQR.0.0 when the incidence threshold is reached. Once the incidence drops below the threshold, the migration rates are set back to their original values and the population counts converged back to 1000 people in each region:
The effect of the evacuation (and vaccination) intervention is clearly visible in the epidemic curves for both regions:
Air Transportation Example
Controlling an outbreak by shutting down air transportation out and in of a region is one option a policy maker can decide to do. To model this in STEM, you can can create a modifier that changes the total number of passengers traveling to/from a region. It is possible to shut down traffic at any regional administrative level. For instance, you can shut down all air traffic traveling to/from Santa Clara county in California, or you can decide to shut down air traffic to/from California to other states, or even shut down all international travel.
Air Traffic Interventions
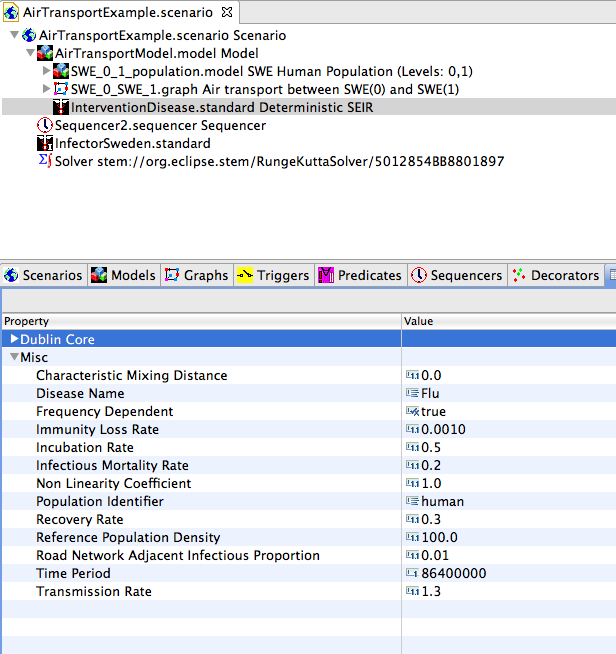
You shut down air traffic by modifying the "maxFlow" parameter of the air transportation edges. In this example, let's say we already have a scenario of an outbreak occurring in Sweden, starting in Stockholm and spreading via air transportation only to other counties in Sweden.
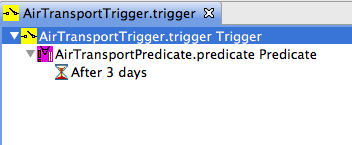
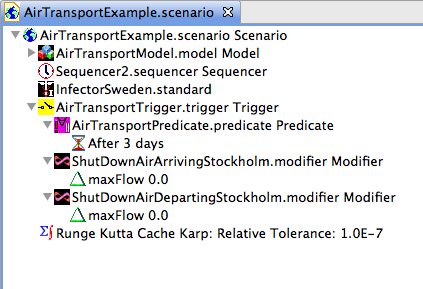
You'll notice how the model scenario has the graph with air travel data for Sweden. It's the edges (and associated edge labels) you want to modify to shut down air transportation. Create a trigger (using the "New Trigger" icon in the toolbar) and give it a name, e.g. "AirTransportTrigger". Next, create a new Predicate that is true after 3 days of elapsed simulation time and drag it into your trigger (see first tutorial above if you need more information).
Modifying the Air Transportation Graph
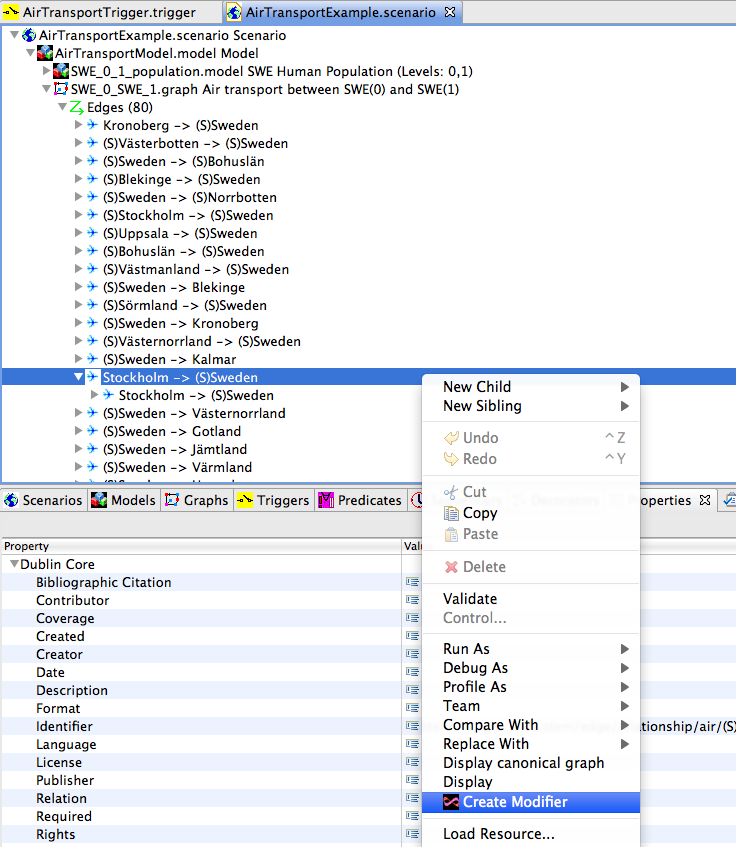
In this case, we want to shut down all air traffic in and out of Stockholm 3 days after the first case is detected. Open up the air transportation graph in your scenario and locate the edge (under Edges) with the title "Stockholm -> (S)Sweden". This is the edge that represents all passengers traveling from Stockholm in a day. Right-click on the edge (or the edge label underneath) and select "Create Modifier".
The wizard for creating a new modifier pops up. Give the new modifier a name, e.g. "ShutDownAirArrivingStockholm" and select "Single" for "Modifier Type", then enter 0 for "Max flow". This will effectively shut down all passengers leaving Stockholm via air transportation. Now we need to also shut down all passengers arriving to Stockholm. Locate the edge with the name "(S)Sweden -> Stockholm" and repeat the process above to create a new modifier name e.g. "ShutDownAirTrafficDepartingStockholm" setting maxFlow to 0. Drag the two new modifiers into your trigger and drag the trigger into your scenario.
In this case, we can see how quickly the epidemic spreads to the northern most county in Sweden (Norrbotten) with and without air traffic in and out of Stockholm:
Without Stockholm Air Traffic: 
The incidence peaks about 8 days later in Norrbotten when air transportation is shut down.
Using Containment
To shut down say all air transportation in and out of California, you can modify the two edges named "(S)USA -> (S)CA" and "(S)CA ->(S)USA" in the air transportation graph for the United States. This will effectively prevent people in California from mixing with air travel passengers in other states. However, people in California are still mixing via air transportation for flight departing and arriving within California. To shut down all air transportation in the state, you need to create modifiers for all air transportation edges arriving or departing in a California county.
To shut down international air transportation, look for the edges that have the "(S)ZZZ" inside their names. Those control international passenger traffic.
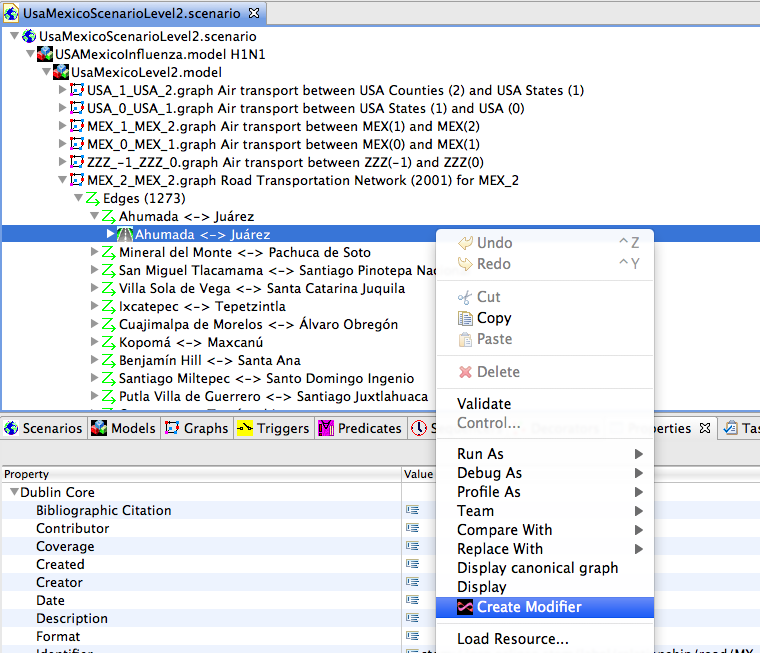
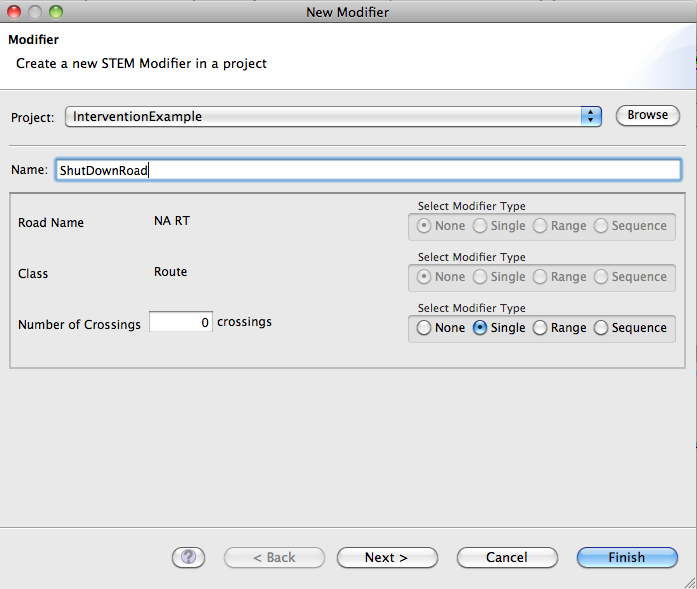
Now that you have a good understanding how how interventions work in STEM (I hope), there are a few other intervention policies you can use in STEM. For instance, if you want to shut down the road transportation between two regions (shutting it down globally is simply a matter of modifying the RoadNetworkInfectiousProportion in you disease model), you create a modifier for the edge in the road transportation graph. Here is an example that shuts down traffic between Ahumada and Juarez in Mexico:
You shut down traffic by setting the "Number of Crossings" attribute to 0. Alternatively you can increase traffic by setting this attribute higher than 1.
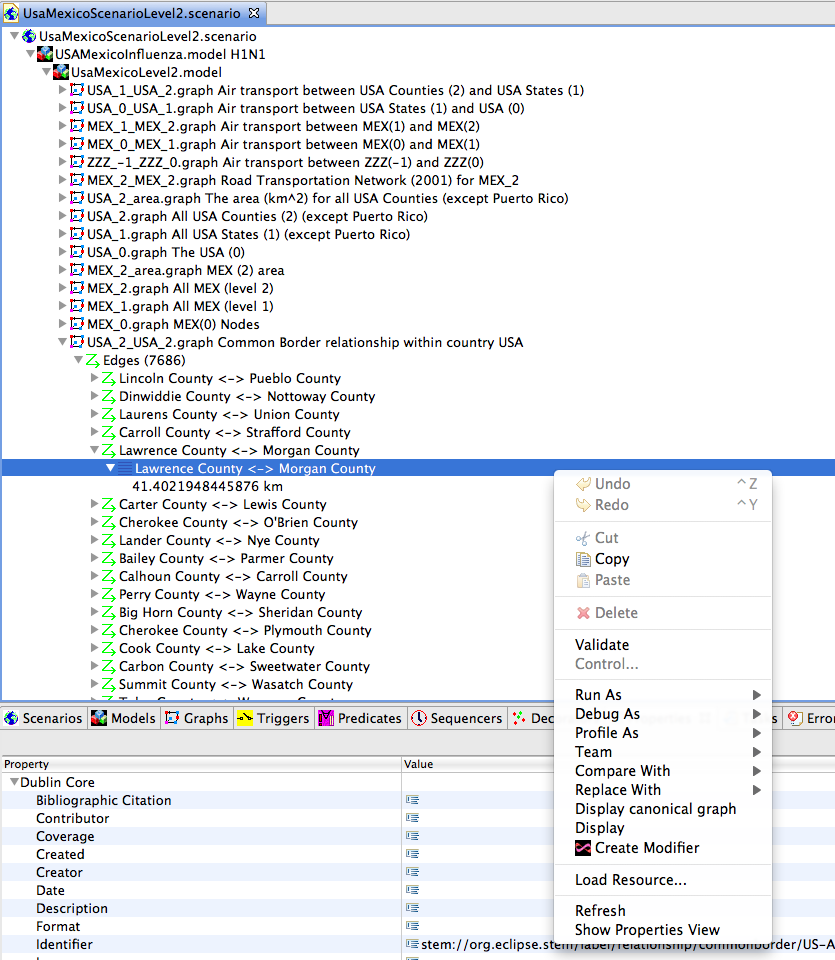
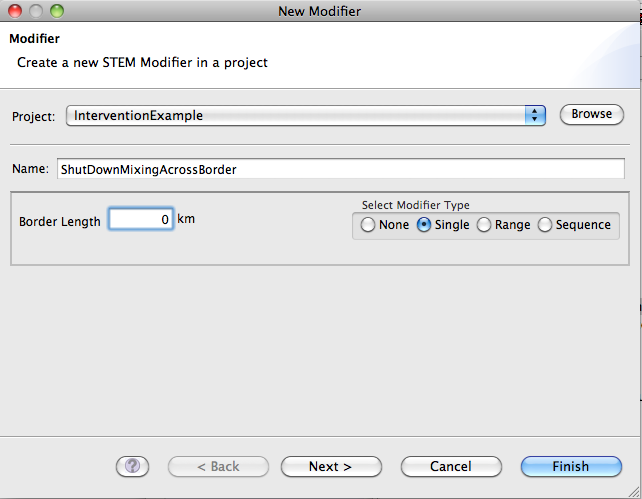
Similarly, the mixing that occurs of infected individuals across common borders can either be shut down globally (using the CharacteristicMixingDistance in the disease model), or only for a particular border. You modify the common border edge in the common border graph for your particular scenario. In this case, we shut down the common border mixing between Lawrence County and Morgan County in the United States:
You set the mixing to 0 by setting the Border Length attribute to 0:


