Notice: This Wiki is now read only and edits are no longer possible. Please see: https://gitlab.eclipse.org/eclipsefdn/helpdesk/-/wikis/Wiki-shutdown-plan for the plan.
STEM Map View
Contents
The STEM U.I.
STEM has several perspectives in the UI. This page discusses controls available the Runtime perspective.
STEM Simulation Controls
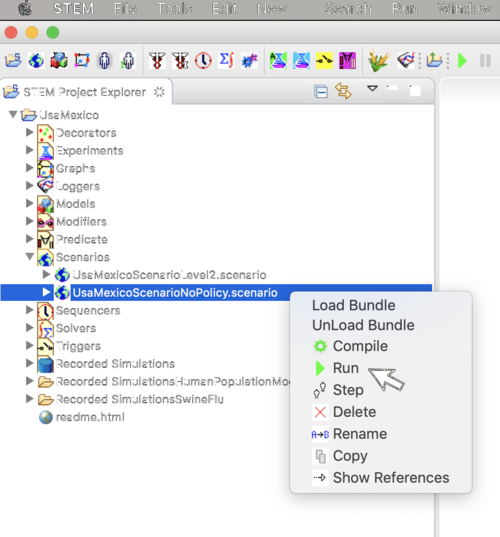
The simplest way to start a simulation is to go to the project explorer.
- Open any Project
- Open the scenarios folder
- Right click on a scenario
- and select Run.
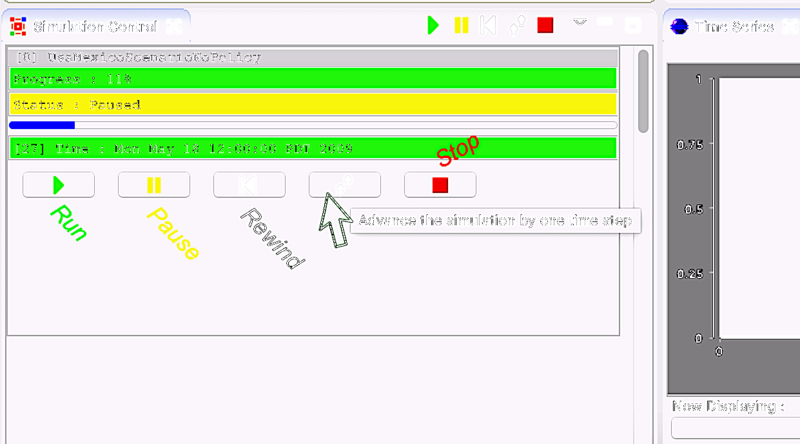
Once a simulation is running you can control it with the Simulation Control view. This view provides buttons to:
- Run
- Pause
- Step
- Stop (or end)
Mouse over a button to see a tool tip. Click to activate it.
STEM Map
The STEM Map View is a light weight build in viewer that allows a user to watch a simulation at run time. Just start a new simulation with the STEM application by selecting any scenario, right-click and select run. STEM will automatically switch to the Run-time perspective and you should see the map view by default. STEM also supports other viewers including GoogleEarth(TM) and GoogleMaps(TM).
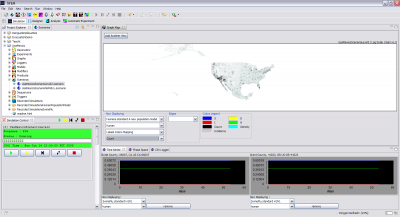
The internal Map View should is visible by default in the run time perspective. When a valid simulation is started, after the data is loaded into memory the map should display the polygons corresponding to the administrative divisions in the region being modeled.
The following images were made while running the UsaMexico H1N1 project (the UsaMexicoScenarioNoPolicy.scenario)
Zooming the Map
To Zoom the map use the up and down arrows on you keyboard
To Zoom the map use the up and down arrows on you keyboard
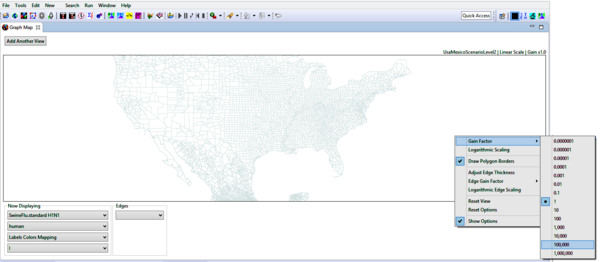
Gain Factor
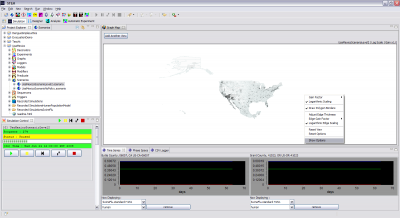
Right clicking anywhere on the map brings up a dialog that allows a user to:
- Change the gain factor or "brightness" of the display
You my also:
- Toggle between logarithmic or linear mapping between (e.g.) the fraction of infectious people and color intensity
- Turn polygon borders on/off
Time Series and Phase Space Charts
Monitor a First Region
- Start the USA Mexico Scenario an then click Pause.
- Then Click and Hold the map and drag it until Mexico is Centered
- Set the gain factor very high (eg 100,000)
- Start the simulation, hitting play, until you first see the red outbreak
- Pause the simulation
- Recenter and zoom in until you can see the location the Epidemic starts. This is near Mexico City.
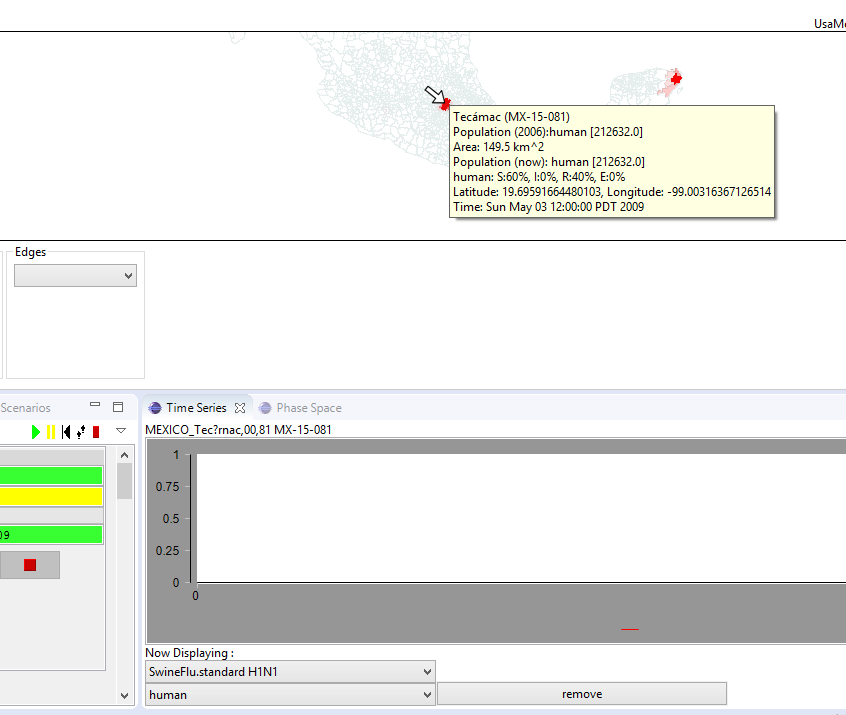
- Mouse over to see information on the regions
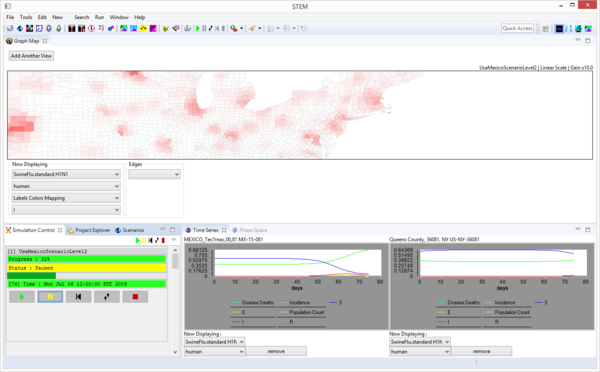
- Double click to launch a Time Series monitor of the region.
- The exact same process works for the Phase Space view but you have to click on the Phase Space tab first. The Phase Space view works best when you right click to suggest log-log axes.
double click on a region to launch a time series monitor for that region
Monitor a Second Region
- Click and Drag the Map until you see Long Island New York
- Start the simulation, hitting play, until you first see the red outbreak
- Pause the simulation
- Then Click and Hold the map and drag it until Queens N.Y. is Centered
- Double click to launch a Time Series monitor of the region. (Go to the Phase Space view to do the same for Phase Space)
STEM Preference will remember your Time Series and Phase Space selections by project. To get rid of them just click: Remove
Try it out
- Now hit Rewind (the back arrow), and then Play (the rightward pointing green arrow in the controls view.
- You will see the time series charts update as the simulation runs.
- Right click on a Time Series graph to change the values that are plotted, the axis scale, etc.
- To move or recenter the map, simply click, hold, and drag to the region of interest.
- To zoom in or out, use the up and down arrow keys
SEE the page on STEM Loggers to log data so you can plot it yourself
Right clicking anywhere on the map brings up a dialog that allows a user to:
- Change the gain factor or "brightness" of the display
- Toggle between logarithmic or linear mapping between (e.g.) the fraction of infectious people and color intensity
- Turn polygon borders on/off
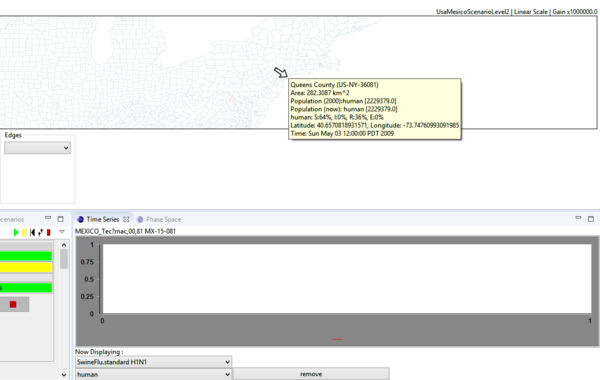
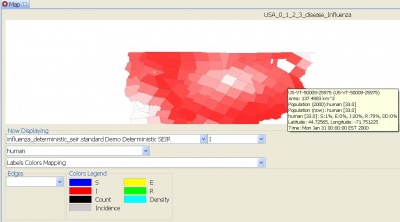
During a running simulation if you hover the cursor over the map an informational dialog will appear with:
- The name and ID of the location the cursor is over
- The area
- Information on populations present
- SEIR indicators and the current percent value
- Latitude and Longitude of cursor location
- Timestamp value
Displaying Edges in the Graph
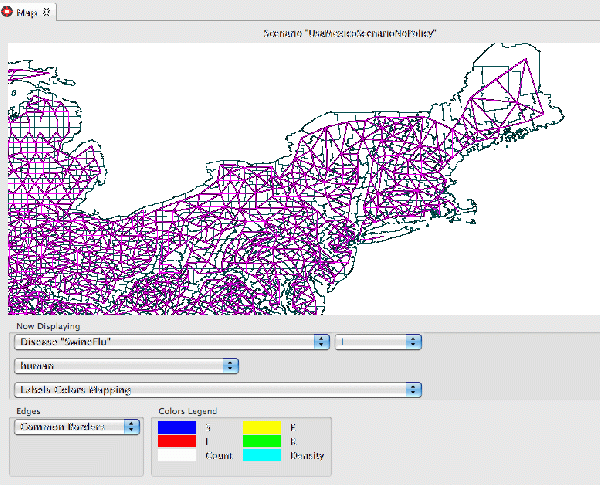
On the lower left hand side of the map view (see above) is a combo box that allows a viewer to select different types of edges to display. By default, no edges are displayed. If the graph in a running simulation contains edges such as common borders or roads, you can select them with this combo box and see them on the map. In the example above, common borders between physically adjacent regions are shown. Do you see the places where neighboring regions are separated by a river? These have no connecting edge. Users can add new edge collections to STEM (for example bridges) and add them to a graph. In the future we will also provide an interactive graphical editor.
STEM Runtime Preferences
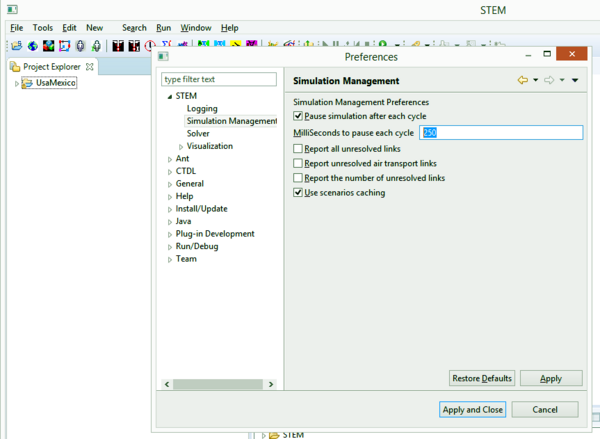
Simulation Management
- Go to >Window>Preference>STEM>Simulation Management
- From this view you can add or remove a simulation delay. The default delay is 250ms to slow STEM down for running demos.
- You can set the delay to zero or 10ms to speed STEM up
- Under SOLVERS you can tell STEM to run multi-threaded. Be careful not to tell STEM to use more thread than you machine has available core.
Visualization Preferences
STEM also provides the ability for users to customize colors used in the system. To use this feature, when the simulation is running simply go to the top menu-bar and click
>window>preferences
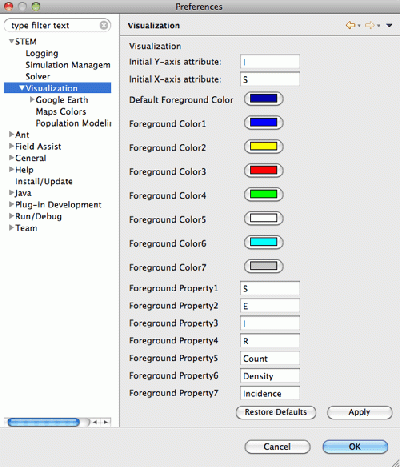
This will bring up a dialog for user preferences. Expand the tags
>STEM>Visualization
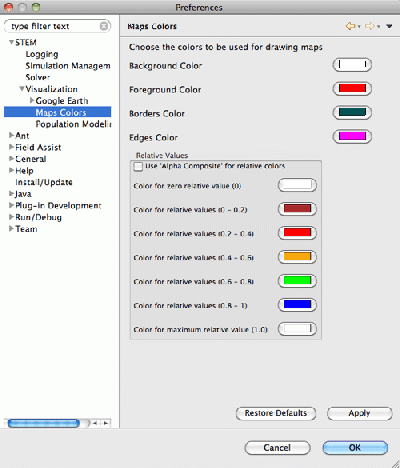
The Visualization tag itself allows a user to assign a particular color to particular types of data
(for example, 'I' => RED). The Map Colors tab allow customization of Map Foreground and Background colors, polygon border colors, edge Colors, etc.
Hide options bar
- In order to increase the map area, the lower options bar can be hidden by toggling "Show Options" in the context menu.
- Or, you can click and drag the frame aounnd any view.
- Like any Eclipse application you can also rearrange views or open and close them in different Perspectives.
View preferences
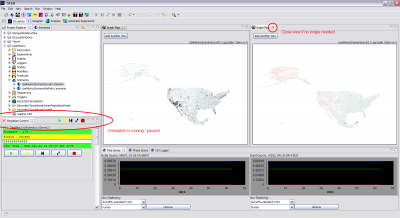
The number of open map views, map position and zoom, view adaptions in the context menu as well as in the the options bar are automatically stored as preferences as a function of the running simulation. If this simulation is run another time, the preferences will be restored. If a view is no longer needed, it must be closed while the simulation is running/paused. Consequently the view will be removed from the preferences and no longer opens up when the simulation is started again.


