Notice: This Wiki is now read only and edits are no longer possible. Please see: https://gitlab.eclipse.org/eclipsefdn/helpdesk/-/wikis/Wiki-shutdown-plan for the plan.
STEM Import Discrete Transportation Events
This tutorial shows how to import the discrete transporation events from a Pajek file and visualize the events. Documentation on the Pajek format is available at Importing a Pajek Graph. The import of transportation data of beef for Austria is used as an example here.
Contents
- 1 The Pajek File
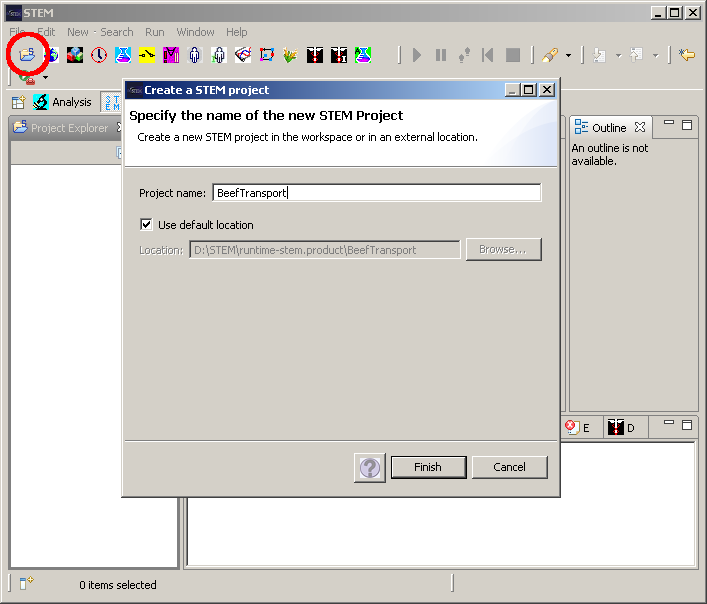
- 2 Create a New Project
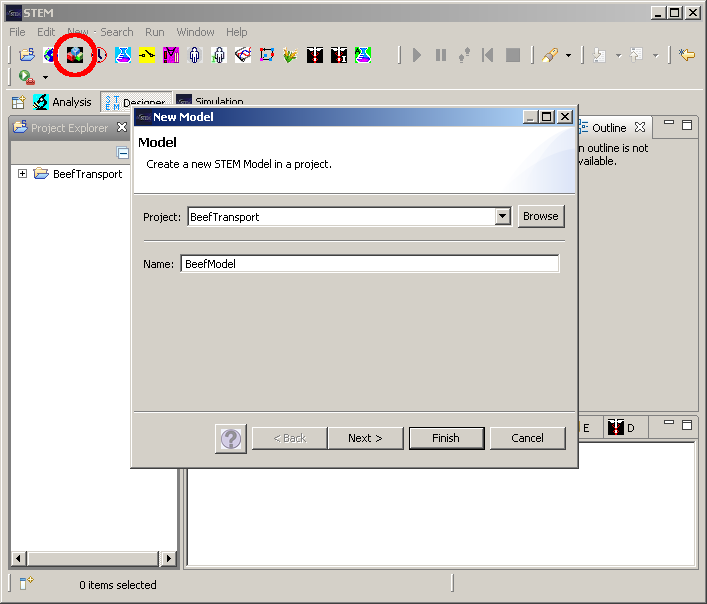
- 3 Create a New Model
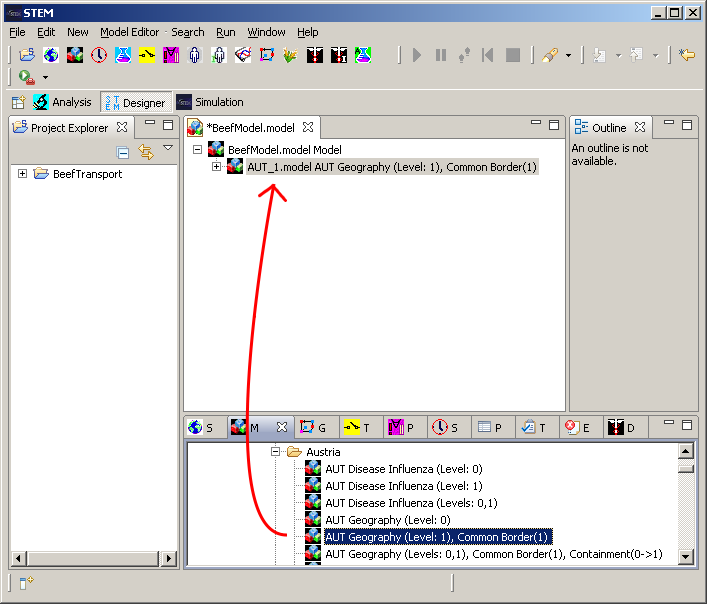
- 4 Drag the Austria Geography Model into the New Model
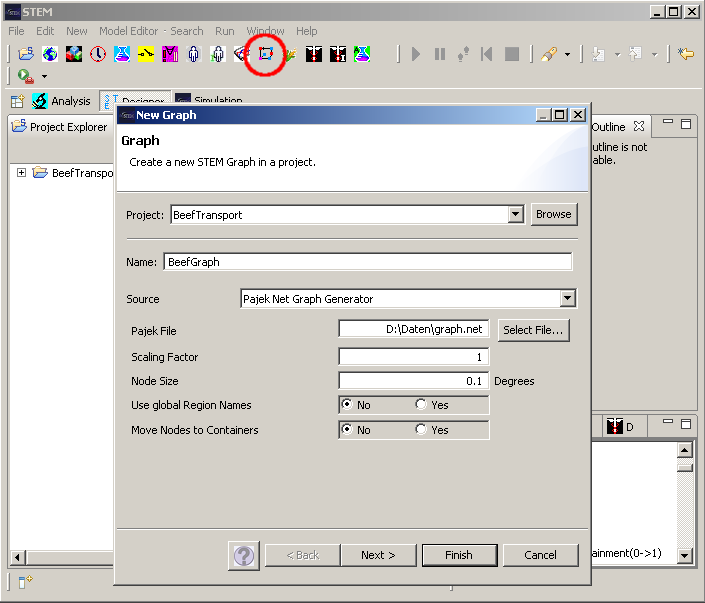
- 5 Import the Pajek Graph
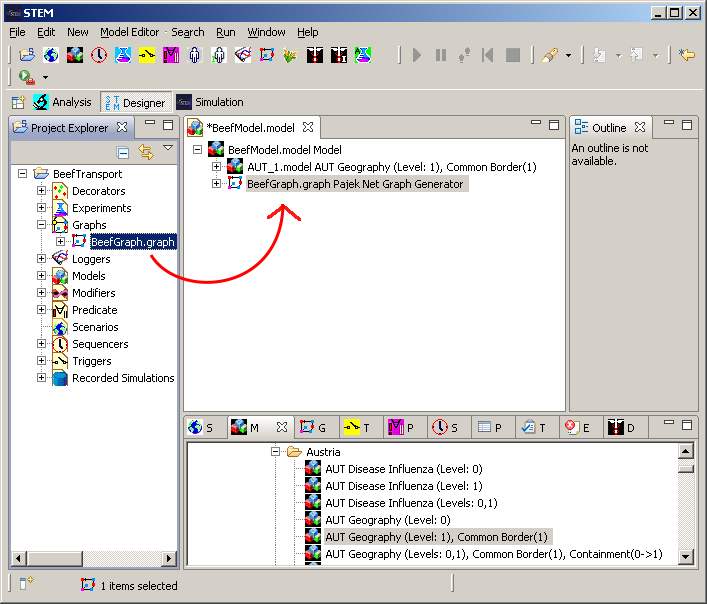
- 6 Drag the Imported Graph into the Model
- 7 Create a Population Initializer
- 8 Drag the Initializer into the Model
- 9 Create a New Scenario
- 10 Drag the Model into the Scenario
- 11 Drag the Trigger (created during Pajek Import) to the Scenario
- 12 Create a Sequencer
- 13 Drag the Sequencer into the Scenario
- 14 Create a Population Model for Beef
- 15 Drag the Population Model into the Scenario
- 16 Start the Simulation
- 17 Configure the GraphMapView (1)
- 18 Configure the GraphMapView (2)
- 19 Run the Simulation Step by Step
The Pajek File
The following text must be copied into a new textfile named graph.net. In the Vertices* section node references are specified for AT-2, AT-3, ... AT-10. These are nodes from the STEM library graph of Austria. In the Edges* section migration edges between these nodes are defined. The edges have default migration rate of zero and a rate >0 for a specified date. That means on this particular date beef moves from one region to another.
*Vertices 9
1 AT-10
2 AT-2
3 AT-3
4 AT-4
5 AT-5
6 AT-6
7 AT-7
8 AT-8
9 AT-9
*Edges
1 2 popID beef rate 0 date 2012-01-01 rate 10.0
1 3 popID beef rate 0 date 2012-01-01 rate 10.0
1 4 popID beef rate 0 date 2012-01-01 rate 10.0
1 5 popID beef rate 0 date 2012-01-01 rate 10.0
1 6 popID beef rate 0 date 2012-01-01 rate 10.0
1 7 popID beef rate 0 date 2012-01-01 rate 10.0
1 8 popID beef rate 0 date 2012-01-01 rate 10.0
1 9 popID beef rate 0 date 2012-01-01 rate 10.0
2 3 popID beef rate 0 date 2012-01-02 rate 20.0
2 4 popID beef rate 0 date 2012-01-02 rate 20.0
2 5 popID beef rate 0 date 2012-01-02 rate 20.0
2 6 popID beef rate 0 date 2012-01-02 rate 20.0
2 7 popID beef rate 0 date 2012-01-02 rate 20.0
2 8 popID beef rate 0 date 2012-01-02 rate 20.0
2 9 popID beef rate 0 date 2012-01-02 rate 20.0
3 4 popID beef rate 0 date 2012-01-03 rate 30.0
3 5 popID beef rate 0 date 2012-01-03 rate 30.0
3 6 popID beef rate 0 date 2012-01-03 rate 30.0
3 7 popID beef rate 0 date 2012-01-03 rate 30.0
3 8 popID beef rate 0 date 2012-01-03 rate 30.0
3 9 popID beef rate 0 date 2012-01-03 rate 30.0
4 5 popID beef rate 0 date 2012-01-04 rate 40.0
4 6 popID beef rate 0 date 2012-01-04 rate 40.0
4 7 popID beef rate 0 date 2012-01-04 rate 40.0
4 8 popID beef rate 0 date 2012-01-04 rate 40.0
4 9 popID beef rate 0 date 2012-01-04 rate 40.0
5 6 popID beef rate 0 date 2012-01-05 rate 50.0
5 7 popID beef rate 0 date 2012-01-05 rate 50.0
5 8 popID beef rate 0 date 2012-01-05 rate 50.0
5 9 popID beef rate 0 date 2012-01-05 rate 50.0
6 7 popID beef rate 0 date 2012-01-06 rate 60.0
6 8 popID beef rate 0 date 2012-01-06 rate 60.0
6 9 popID beef rate 0 date 2012-01-06 rate 60.0
7 8 popID beef rate 0 date 2012-01-07 rate 70.0
7 9 popID beef rate 0 date 2012-01-07 rate 70.0
8 9 popID beef rate 0 date 2012-01-08 rate 80.0
Create a New Project
Create a New Model
This model is created as a container for all graphs used in this tutorial.
Drag the Austria Geography Model into the New Model
Import the Pajek Graph
The Pajek file must contain the text from The Pajek File.
Drag the Imported Graph into the Model
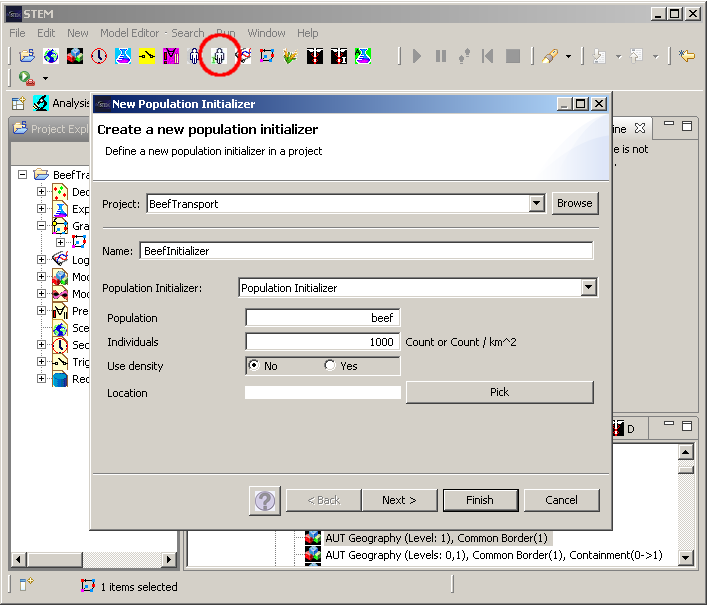
Create a Population Initializer
The population initializer is needed for initializing the regions from the Austria with the population beef. Each region is initialized with 1000 units of beef.
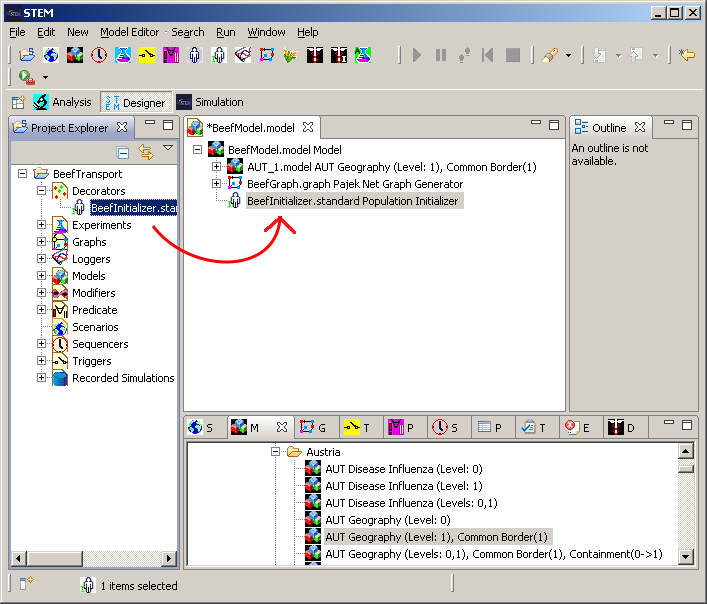
Drag the Initializer into the Model
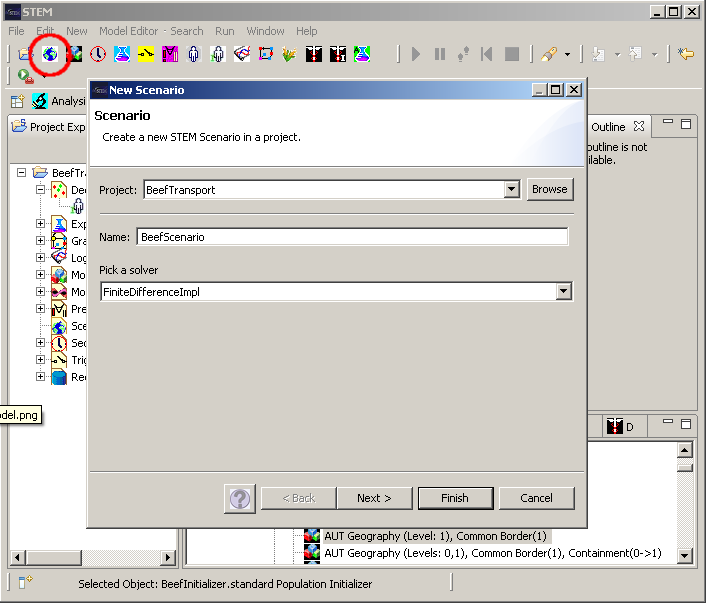
Create a New Scenario
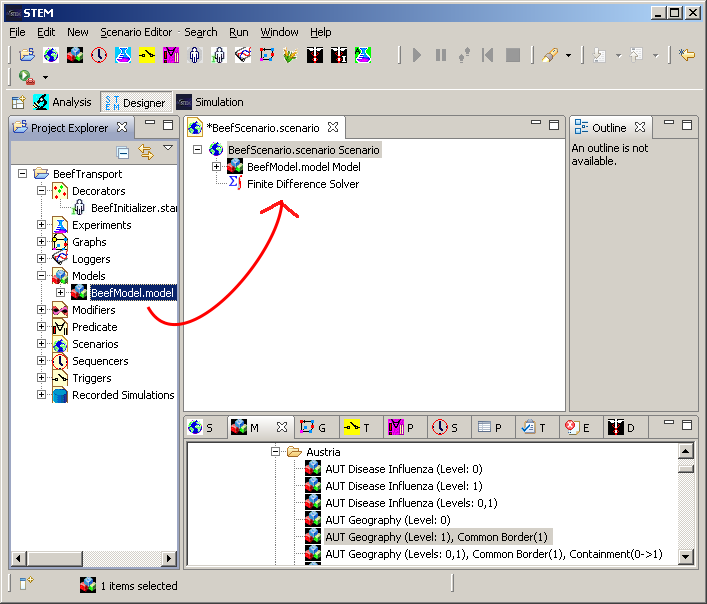
Drag the Model into the Scenario
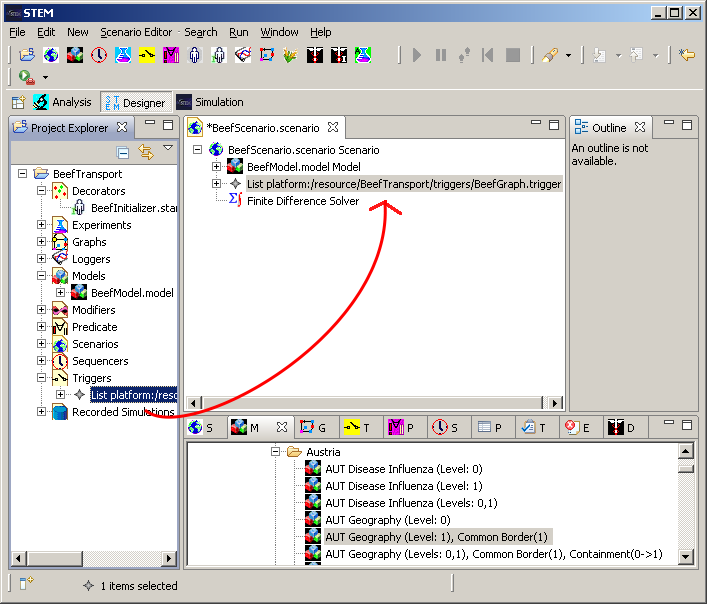
Drag the Trigger (created during Pajek Import) to the Scenario
The trigger was automatically created during the Pajek-Import step. It contains the time dependent migration rates.
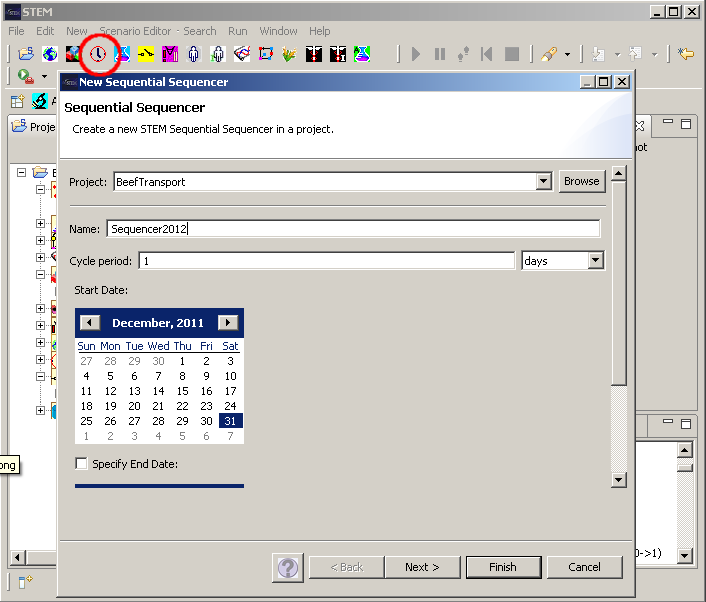
Create a Sequencer
Since the dates in the Pajek file are the first 8 days of 2012, our Sequencer will start on December 31st 2011.
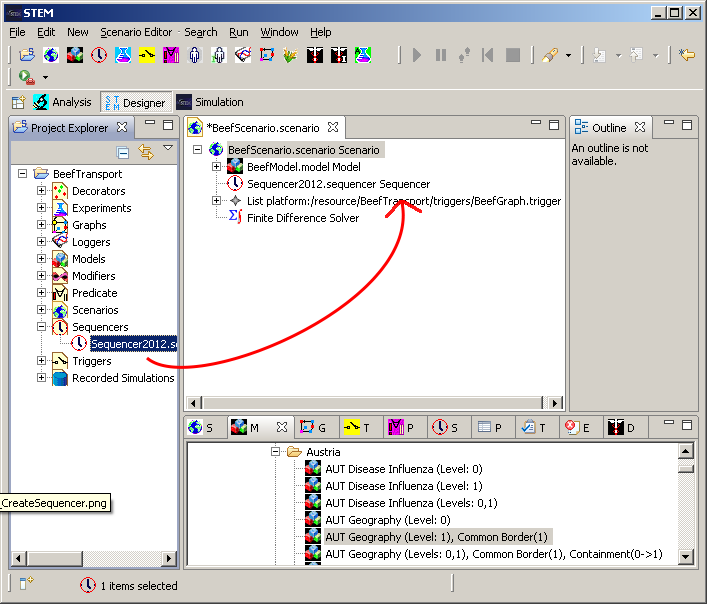
Drag the Sequencer into the Scenario
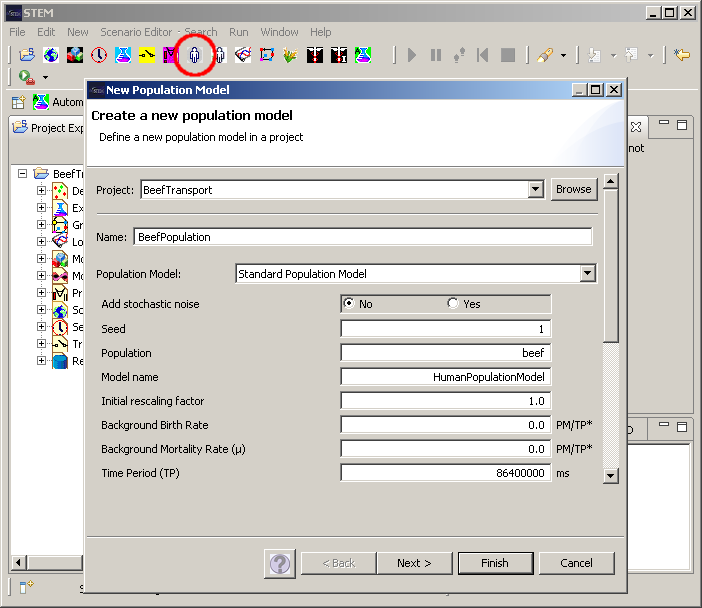
Create a Population Model for Beef
In STEM there has to be a population model for each population. We just set the birth and death rates to zero.
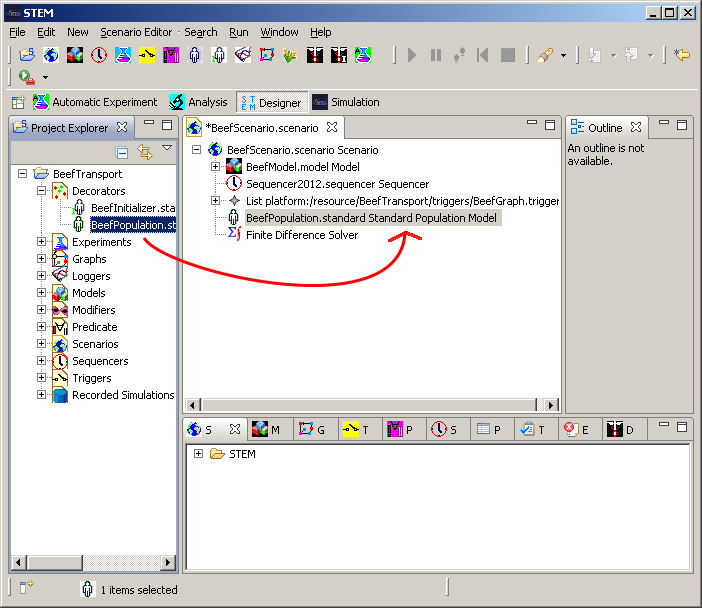
Drag the Population Model into the Scenario
Start the Simulation
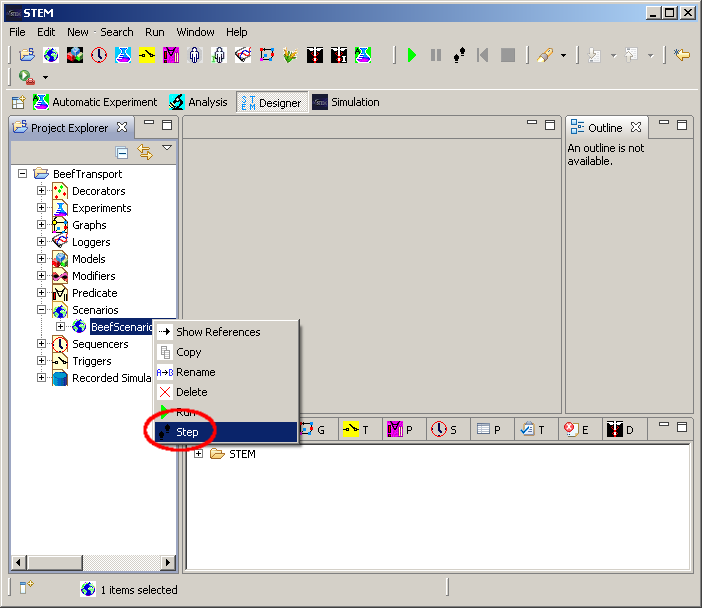
We have finished creating the Scenario. Now we can start the Simulation. We press the step button to perform the initial step.
Configure the GraphMapView (1)
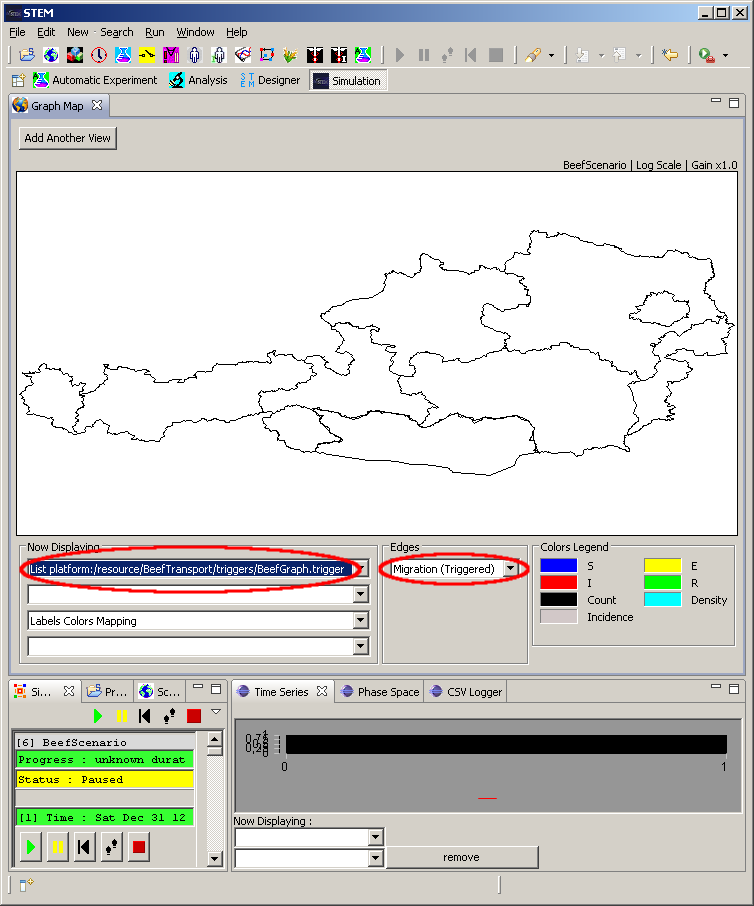
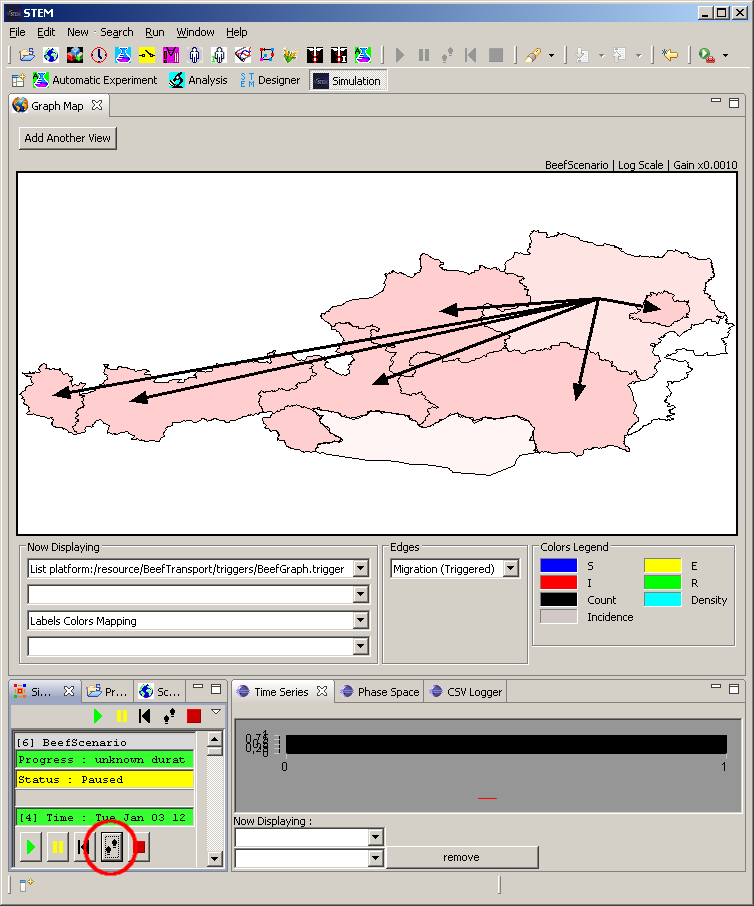
We need to select the Trigger using the upper left combo box. This colors regions based on the number of beef units already transported to the regions. If we select Migration (Triggered) in the Edges combo box, all migration edges with rates >0 at the current date are shown.
Configure the GraphMapView (2)
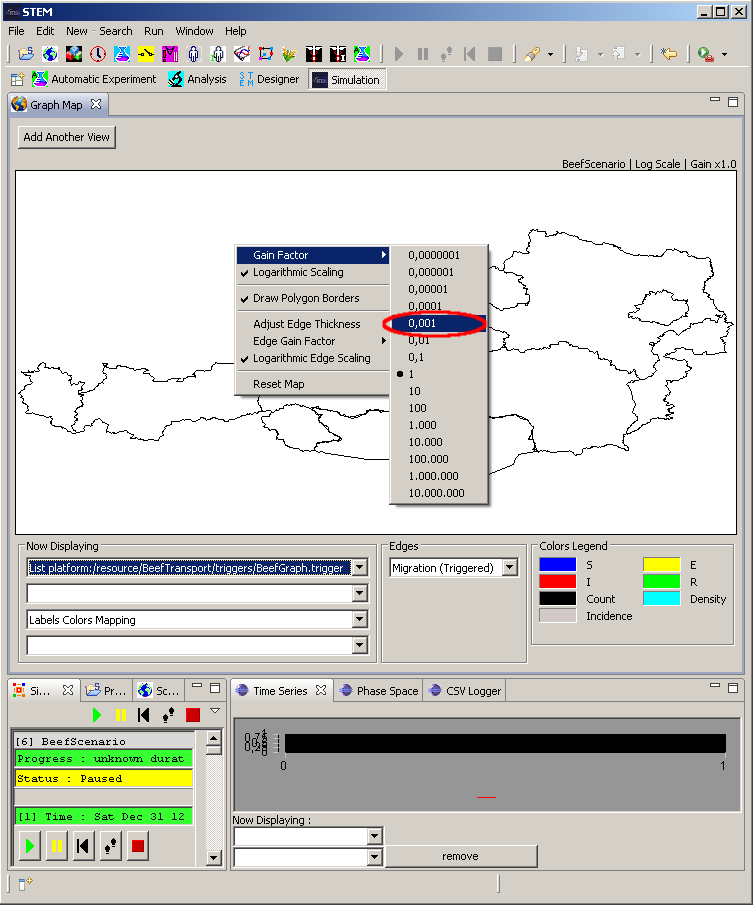
Now we set the Gain Factor in the context menu to 0.001. This factor scales the red coloration of the regions.
Run the Simulation Step by Step
Now you can run the simulation step by step by pressing the step button.

