Notice: This Wiki is now read only and edits are no longer possible. Please see: https://gitlab.eclipse.org/eclipsefdn/helpdesk/-/wikis/Wiki-shutdown-plan for the plan.
SCA/SCA Component/SCA Java Run and Debug Platform
Contents
Introduction
When you debug an SCA Java project on an SCA platform, it is also possible to debug the platform itself.
Obviously, the developers of the platform did not wait for us to provide such a solution. But we signal it on this wiki because it can be quite useful to see how to do that.
It also opens some perspectives to add breakpoints and debugging features for composite elements.
Notice: obviously, to ease the debugging, you should have both the binary and the source distribution of the SCA platform you are using.
Debugging from the main class
Find the main class file in your Eclipse.
You can find it either because you already have the source, or by using the Java search feature of Eclipse (Java > Search Java... and search the type you gave in the master launch configuration).
Go into the debug perspective: Window > Open perspective > Debug.
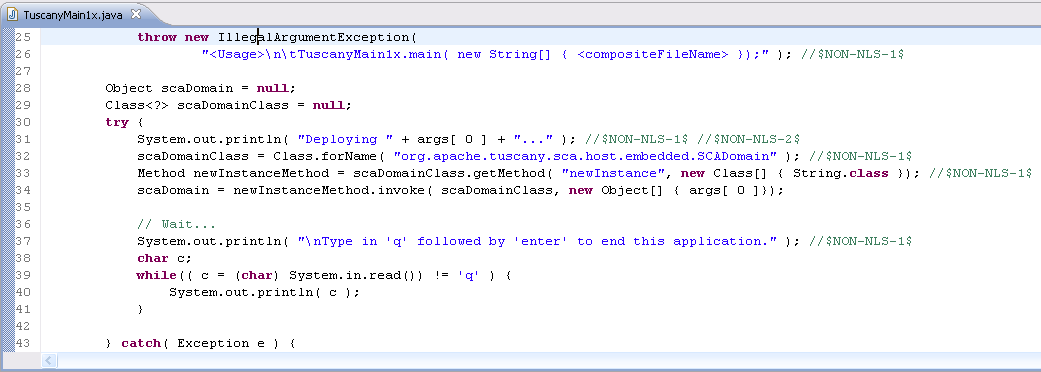
We are now going to add a breakpoint somewhere in your main.
Starting from the main source file...
Open the source file.
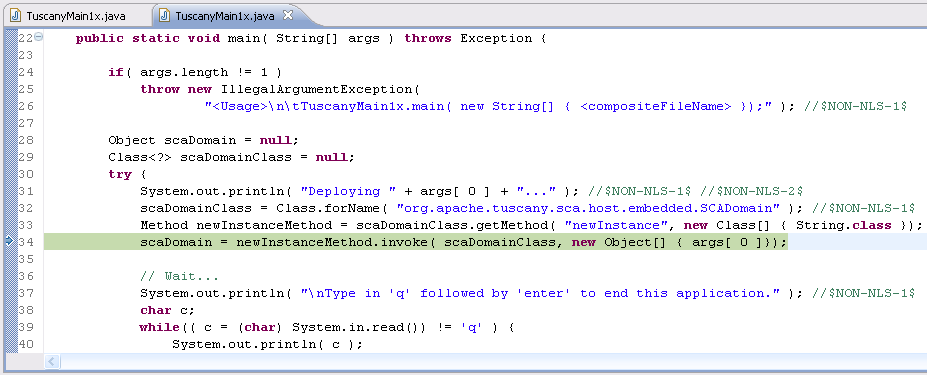
Make a right-click somewhere on the left margin of the editor and select Toggle breakpoint.
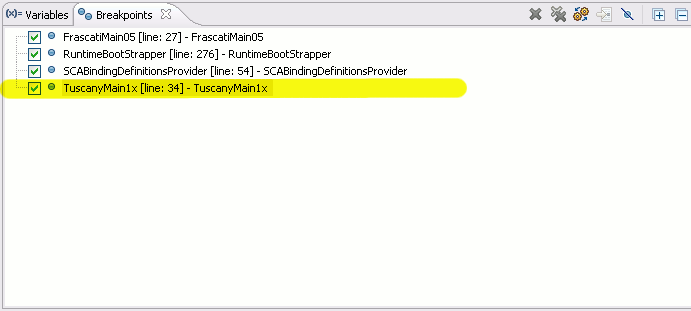
This breakpoint may not be visible in the editor, but it will be visible in the Breakpoints view.
Now, right-click on your composite and select Debug as... > SCA application.
Select the configuration you want to debug and click OK.
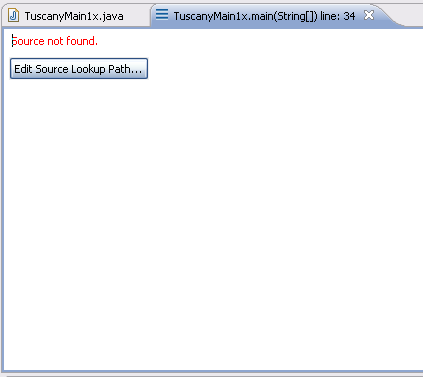
If your main class is not in the workspace, the debug editor will show you an empty editor.
You will have to associate the sources manually. In this case, click Edit Source Lookup Path....
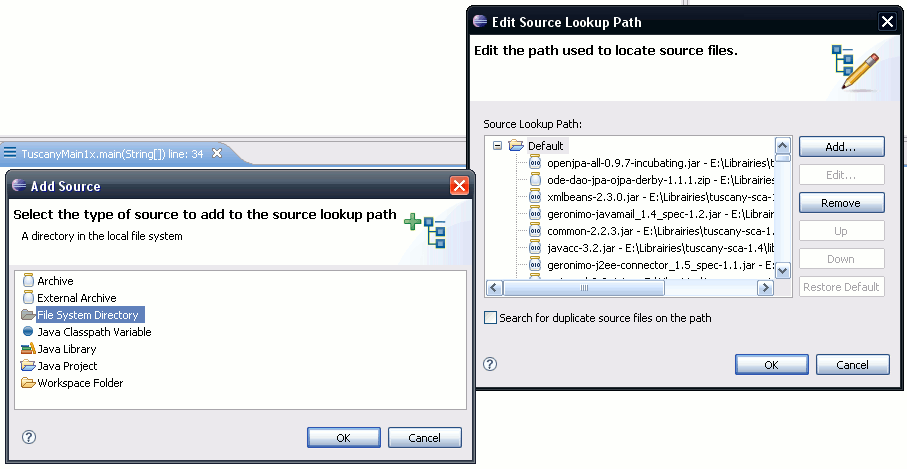
Select Default and click Add.... In the second dialog, select the appropriate choice.
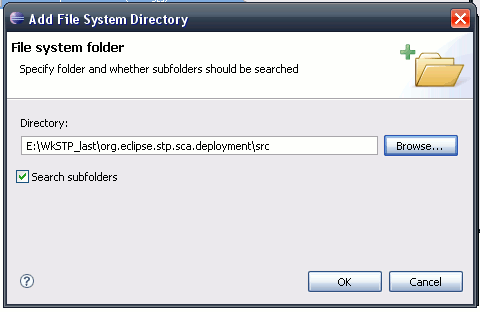
For this tutorial, since I have the source of TuscanyMain1x, I can select File System Directory and give the right location.
Click OK until you get back to the source. You have your source now.
Starting from the main class file...
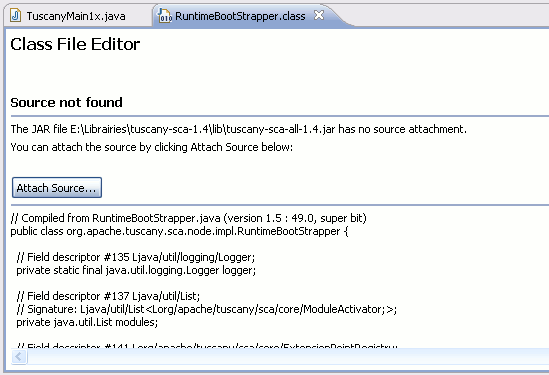
The editor should only show bytecode.
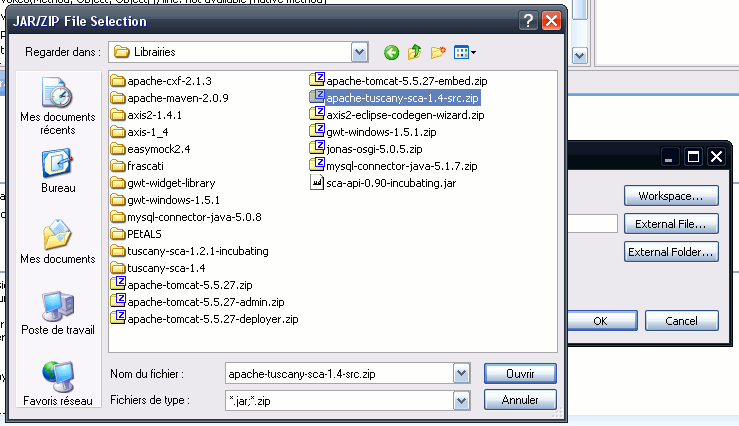
Click Attach Source..., select External File..., choose the source file on your disk. Then click OK until you are back to the editor. You should now see the main class code. In this source file, make a right-click somewhere on the left margin of the editor and select Toggle breakpoint (or make a double-click). This breakpoint should be visible in both the editor and the Breakpoints view.
Now, right-click on your composite and select Debug as... > SCA application. Select the configuration you want to debug and click OK.
Getting into the platform code
You are now moving into the main class code.
Use the Step Into, Step Over and Step Return buttons to navigate into the code.
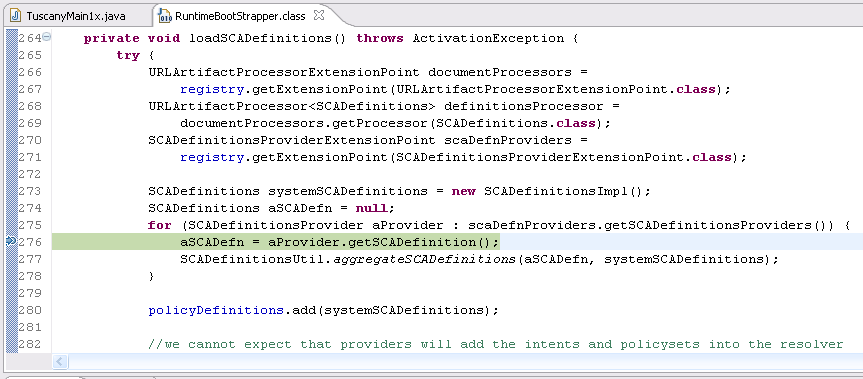
You should finally arrive to a runtime class. Once again, you will most likely have to associate the source code.
Click Attach Source..., select External File.... On your disk, choose the source distribution of the platform.
Then click OK until you are back to the editor. You should now be in the platform code.
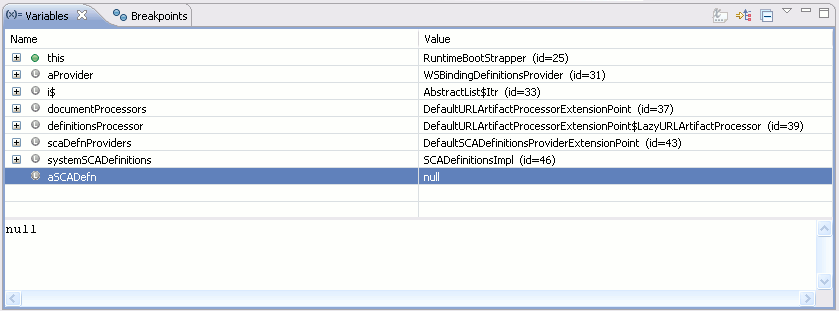
You can add breakpoints into this code, check the variables... in short, debug the platform code.
Debugging from a stack trace
Let's assume you deployed a project and that it failed.
You have a stack trace in the console, referencing some classes of the platform and lines indicating where it failed.
This case is even more simple than previously.
In the console, click the class link. It should be open in the editor and be displayed as bytecode.
Associate the source as described previously and then add breakpoints.
Run the composite once again in debug mode and check what went wrong.

