Notice: This Wiki is now read only and edits are no longer possible. Please see: https://gitlab.eclipse.org/eclipsefdn/helpdesk/-/wikis/Wiki-shutdown-plan for the plan.
PTP/System Monitoring FAQ
Contents
- 1 Q: What is PTP System Monitoring?
- 2 Q: What target systems are supported by PTP system monitoring?
- 3 Q: Where are references, links, and more design information on PTP System Monitoring?
- 4 Q: Where is system monitoring information stored on the remote target?
- 5 Q: How do I debug the server part of PTP's system monitoring capability?
- 6 Q: How can I tell what's running on the server and hopefully see any errors?
- 7 Q: How do I specify a custom layout file to determine how the frames, drawers, nodes, etc. are drawn on my remote target system?
Q: What is PTP System Monitoring?
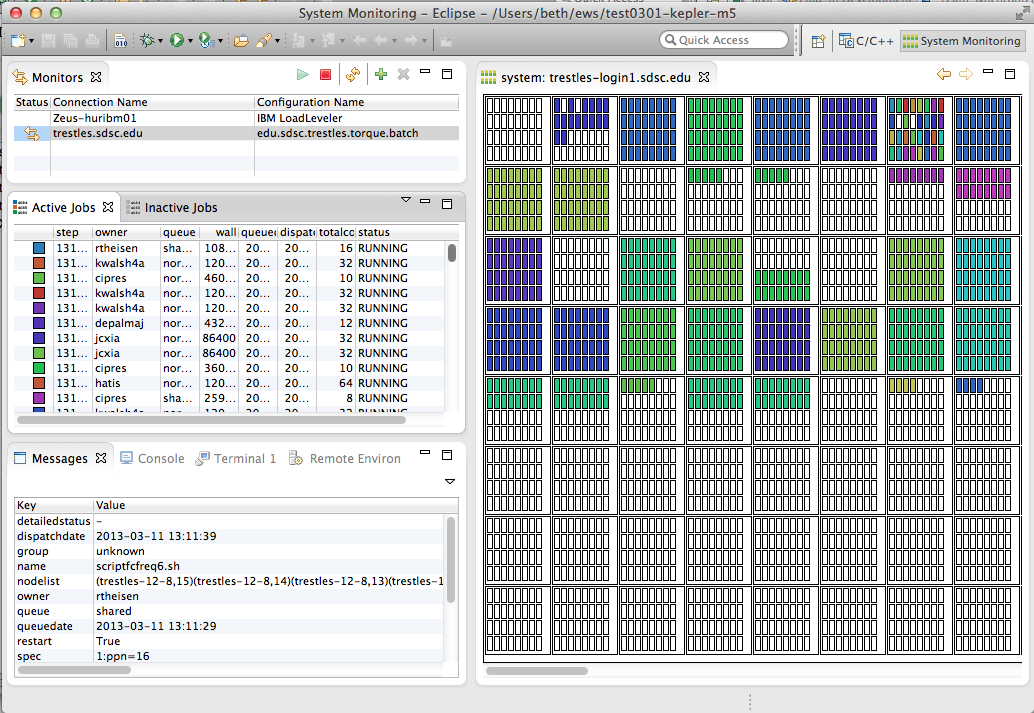
PTP System Monitoring is a perspective within the PTP workbench that allows display of jobs and their location on the target system. See the PTP online help section on monitoring. It is based on the LML (Large-scale system Markup Language) at Juelich Supercomputing Centre (need link).
PTP System Monitoring is also available as a stand-alone executable, PTP "SysMon", starting with Eclipse PTP Kepler release - PTP 7.0 (release scheduled for Jun 2013). For pre-release Kepler downloads including the SysMon executable, see the PTP Kepler download page. SysMon and the PTP System Monitoring Perspective of the full Eclipse PTP workbench (such as the Eclipse for Parallel Application Developers package on the [http://eclipse.org/downloads Eclipse download page) work essentially the same.
To start a monitor, in the System Monitoring Perspective (or in SysMon) create a new monitor in the upper-left 'Monitors' view. To refresh a monitor, select it and hit the refresh button. Monitors are refreshed automatically ever approx. 60 seconds.
For more info on usage, see the PTP Help for Monitoring
Q: What target systems are supported by PTP system monitoring?
See Running programs in the PTP online help, which include a list of available target system configurations, some general, and some specific.
Q: Where are references, links, and more design information on PTP System Monitoring?
- Scalability and monitoring designs
- LML DA Driver - Architecture of the backend data collection engine
- LML - Description of the LML specification
- LML Schema - Schema for the LML protocol
- Bug 403179 has some sysmon info
- Monitoring system basics, and adding support for a new batch system - Carsten Karbach and Wolfgang Frings, Jülich Supercomputing Centre - 2012 PTP User-Developer Workshop
- News on Monitoring - Wolfgang Frings at Nov. 2012 PTP BOF at SC12 Conference
Q: Where is system monitoring information stored on the remote target?
In the home directory of the userid used to connect with PTP, a directory ".eclipsesettings" is created when the monitor is created and started.
If you should need to reset a monitor to all default information, e.g. during debugging, you can safely delete this directory if needed and it will be recreated (with defaults) at the next monitor refresh.
- Colors: You can delete .eclipsesettings/perm_loginXXX/colormap.db to make it reassign job colors.
Q: How do I debug the server part of PTP's system monitoring capability?
If the Active Jobs view is empty when you know jobs are running on the system, perhaps the commands queried from the monitoring system are not successful.
1. On the remote machine, go to the ".eclipsesettings" directory, located in your home directory (Note you must start a monitor, and it must (attempt to) refresh at least once, for this directory to be created.)
2. Create a file called ".LML_da_options" containing a single line "keeptmp=1" (no quotes).
3. Refresh the monitor.
4. You should now find a directory called "tmp_<hostname>_<pid>" in the ".eclipsesettings" directory. It should contain an error log file, plus a bunch of other files. Check these files to see if you can see the cause of the error. This is also useful to sysmon developers, so you may be asked to zip it up and send it.
5. Remember to remove the ".LML_da_options" file (or at least remove the "keeptmp=1" line from .LML_da_options ) once you have finished, since it will continue to make a new dir at each monitor refresh.
Q: How can I tell what's running on the server and hopefully see any errors?
You can also check the LML_da.errlog file for further output on possible errors.
In addition, you can run the PERL script da_jobs_info_LML.pl directly from within the .eclipsesettings directory and check for error outputs: e.g. are the paths to any needed query command correct?
See also https://bugs.eclipse.org/bugs/show_bug.cgi?id=395517
Q: How do I specify a custom layout file to determine how the frames, drawers, nodes, etc. are drawn on my remote target system?
Layout files are in .eclipsesettings/samples directory. You can write your own LML layout files to customize the layout of the system monitoring perspective. See Customize PTP monitoring layout for a step by step tutorial on how to setup your customized layout. For more documentation on writing your own LML layouts see also LML layouts.

