Notice: This Wiki is now read only and edits are no longer possible. Please see: https://gitlab.eclipse.org/eclipsefdn/helpdesk/-/wikis/Wiki-shutdown-plan for the plan.
MoDisco/BugzillaMetrics
Contents
- 1 General Description & Objectives
- 2 Architecture
- 3 Metamodels
- 4 Transformations
- 4.1 Inject HTML “XML” file to XML model
- 4.2 Transform XML model to Bugzilla model
- 4.3 Transform Bugzilla model to Metrics model
- 4.4 Transform Metrics model to Table model
- 4.5 Generate HTML file from Table model
- 4.6 Generate Microsoft Excel file from Table model
- 4.7 Generate SVG files from Table model
- 5 References
General Description & Objectives
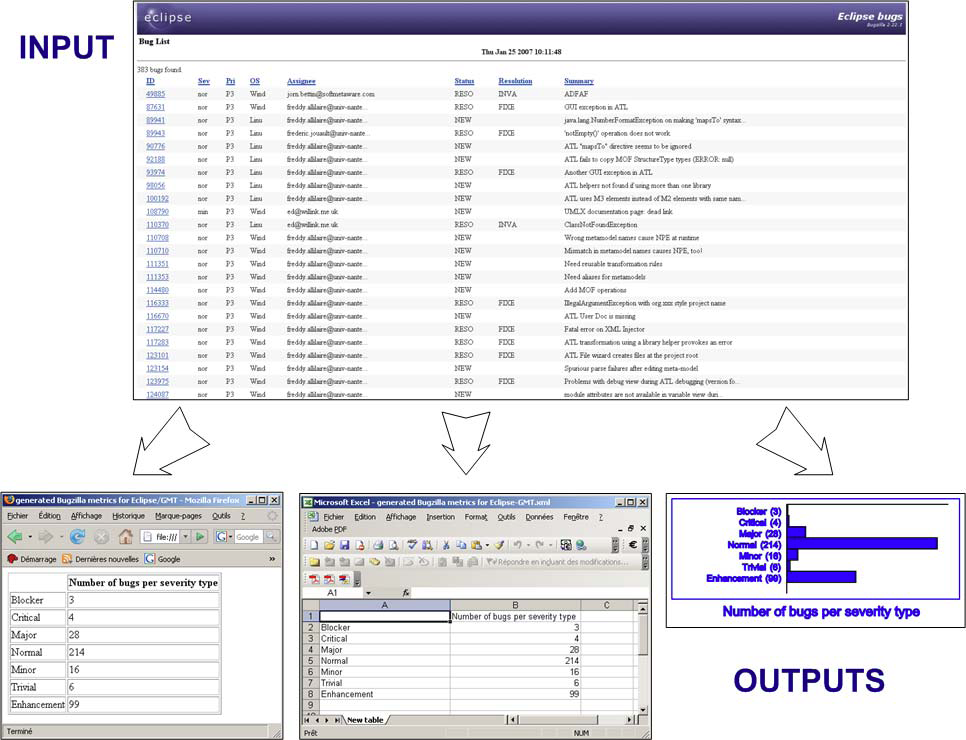
“Bugzilla Metrics” is a complex and complete use case [1], part of the MoDisco component use cases [2] [3], that has been designed and developed in order to build different representations (i.e. visualizations) of metrics computed from bugs Bugzilla data [4] in HTML format. The generated output files are readable with a simple Web navigator, Microsoft Office Excel 2003 [5] or any SVG-supporting software [6]. Note that this use case requires the “Metrics Visualization Builder” Tool [7] from the MoDisco tool box in order to perform the generation of the output files.
The development of this use case, realized by INRIA ATLAS [8], has been supported by the IST European MODELPLEX project (MODELing solution for comPLEX software systems, FP6-IP 34081) [9].
This use case covers both the Model Discovery and Model Understanding phases:
- The first step, which is about discovering bugs information expressed in HTML format and building a Bugzilla model from these data, is a Model Discovery process.
- The second step, which is about computing this generated model in order to produce a Metrics model and to finally build different visualizations from these calculated metrics, is a Model Understanding process.
The following schema shows the input and outputs of this use case:
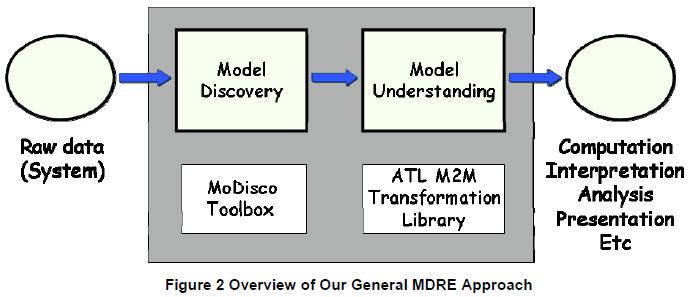
The overall idea behind this use case is to apply MDE principles and methodologies (and more precisely concerning Model-Driven Reverse Engineering or MDRE) in order to provide a generic and easily extensible solution for the automatic generation of metrics visualizations from system raw data. The proposed approach is a combination of Model Discovery and Model Understanding processes, as it is shown in the following schema.
Within the remainder of this document, we will present the overall architecture of the use case. We will also list and briefly describe the set of the used metamodels, as well as the corresponding transformations that have been implemented.
Architecture
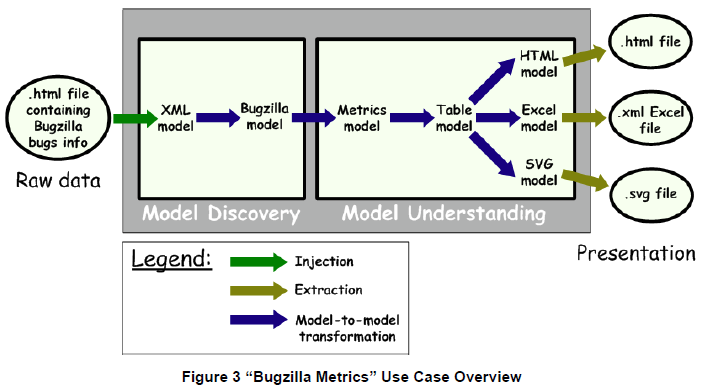
As previously mentioned, this use case is implemented by the composition of Model Discovery and Model Understanding processes. Nevertheless, the overall approach stays quite simple and can be easily summarized in a single schema. Figure 3 provides the description of the “Bugzilla Metrics” use case general structure.
The Model Discovery phase is implemented by applying the XML Discovery general methodology, i.e. the input file is first injected into a XML model which is then transformed into a domain-specific model thanks to an ATL model-to-model transformation [10]. The created model conforms to the Bugzilla metamodel.
The Model Understanding phase is also implemented by using a set of ATL model-to-model transformations [11]. A Metrics model, containing the data concerning the computed metrics, is first generated from the Bugzilla model. This Metrics model is then transformed into a Table model that provides a simple tabular representation of the data. After that, different visualization's formats specific models (i.e. HTML, Excel and SVG models) are built from the Table model. These generated models are finally extracted into software readable files. Note that the last step, which goes from the building of the Table model to the generation of the final output files, requires the “Metrics Visualization Builder” Tool [12] from the MoDisco tool box. All the metamodels mentioned in the previous schema (and so used within this use case) are listed and briefly described in section 3. The different developed transformations are indexed and presented in section 4.
Metamodels
We provide in this subsection some general descriptions of the different metamodels that have been used within this “Bugzilla Metrics” use case. Each of the presented metamodels is available in several different formats from the metamodel libraries in [13].
XML
This metamodel defines a sufficient subset of Extensible Markup Language (XML) for representing any XML document (usually composed of one root element). Each element (i.e. XML tag) can be composed of several nodes that may be other elements but also attribute or text nodes. Elements and attributes are identified by a name. Attribute and text nodes have a value (which is a string that can be empty).
Bugzilla
This metamodel defines the simple and structured representation used by the Bugzilla free bug-tracking system [14] for describing information on bugs. A Bugzilla data source is a set of bugs, each of them being characterized by different fields such as the name of the product and/or component that is concerned, the priority and severity of the bug, the person who assigned it, its status, its description, etc.
Metrics
This metamodel defines a simple generic structure for expressing any kind of metrics. A metric is identified by a name that describes its purpose (for example “Number of bugs per severity type”). Each metric is considered as a set of tag-value pairs that store the computed/extracted metric values. These values may be of different natures, i.e. string, boolean, integer or double.
Table
This is a very basic abstract table metamodel which has been designed for being easily mapped to other existing representations, including of course tabular ones (such as XHTML, Excel, etc). A table is simply composed of a set of rows that are themselves composed of a set of cells. Each cell has a content which is a string that can be empty.
HTML
This metamodels defines a way to describe HTML models from HTML files, according to the W3C specification. A HTML model is composed of a root “HTML” element. This root element contains a “HEAD” and a “BODY” element. The “BODY” element can contain other elements such as paragraphs (“P” elements), tables (“TABLE” elements), lists (“UL” elements), etc.
SpreadsheetMLSimplified (Excel)
This metamodel describes a simplified subset of SpreadsheetML [15], an XML dialect developed by Microsoft to represent the information in an Excel spreadsheet. The root element for an XML spreadsheet is the “Workbook” element. A “Workbook” element can contain multiple “Worksheet” elements. A “Worksheet” element can contain a “Table” element. It holds the “Row” elements that define a spreadsheet. A row holds the “Cell” elements that make it up. A cell holds the data. In addition to this, “Column” elements (children of the “Table” element) can be used to define the attributes of the columns in the spreadsheet.
SVG
This metamodel defines a subset of the W3C standard SVG (Scalable Vector Graphics) [16], an XML-based format for graphical rendering. The different elements specified in this metamodel (more especially the geometrical and textual ones) are sufficient for describing bar charts and pie charts.
Transformations
The “Bugzilla Metrics” use case has been implemented by developing different transformations. As we are applying a MDRE approach, most of them are model-to-model (M2M) transformations. However, in order to be able to switch from the heterogeneous “real” world of systems to the homogeneous world of models, we also use some projectors (i.e. injectors and extractors, cf. Figure 3). Note that within this subsection, the different transformations are presented in the order in which they are applied in the use case complete execution process.
Inject HTML “XML” file to XML model
The first step is about injecting the content of the HTML table containing bugs information into a model that conforms to the XML metamodel (see section 3.1). This injection phase is performed thanks to the injector natively provided with ATL [17].
Transform XML model to Bugzilla model
This transformation is about performing a mapping from the bugs structured information stored into the XML model to the Bugzilla concepts. Thus, the transformation build a model that conforms to the Bugzilla metamodel (see section 3.2) from the input XML model.
Transform Bugzilla model to Metrics model
This transformation is the core of the “Bugzilla Metrics” use case since it computes the metrics from the Bugzilla data: it produces a model that conforms to the Metrics metamodel (see section 3.3) from a Bugzilla model. In the provided prototype, it generates the two following metrics: “Number of bugs per severity type” and “Percentage of bugs per severity type”. Note that it is possible to change the metrics generated within this use case by only modifying/improving this single transformation.
Transform Metrics model to Table model
This is a generic transformation that produces a model that conforms to the Table metamodel (see section 3.4) from any Metrics model. Note that this transformation is totally independent of the kind of metrics that is stored into the Metrics model.
Generate HTML file from Table model
This last step (concerning the HTML output) is composed of three sub-steps which are respectively implemented by two transformations and one extraction. These steps are briefly described in the following sub-sections.
Transform Table model to HTML model
This transformation is about simply mapping the generic table concepts of the Table metamodel to the HTML table ones (which are very similar): it produces a model that conforms to the HTML metamodel (see section 3.5) from a Table model.
Transform HTML model to XML model
The goal of this transformation is only to produce an intermediate XML model in order to facilitate the extraction by allowing reusing the already existing XML extractor.
Extract HTML file from XML model
The produced XML model is then extracted into a web navigator readable file, with the “.html” extension, thanks to the XML extractor natively provided with ATL [18].
Generate Microsoft Excel file from Table model
This last step (concerning the Excel output) is composed of three sub-steps which are respectively implemented by two transformations and one extraction. These steps are briefly described in the following sub-sections.
Transform Table model to SpreadsheetMLSimplified model
This transformation is about mapping the generic table concepts of the Table metamodel to the Microsoft Excel ones (i.e. a workbook that contains worksheets storing tables, etc): it produces a model that conforms to the SpreadsheetMLSimplified metamodel (see section 3.6) from a Table model.
Transform SpreadsheetMLSimplified model to XML model
The goal of this transformation is only to produce an intermediate XML model in order to facilitate the extraction by allowing reusing the already existing XML extractor.
Extract Excel XML file from XML model
The produced XML model is then extracted into a Microsoft Excel readable file, with the “.xml” extension, thanks to the XML extractor natively provided with ATL [19].
Generate SVG files from Table model
This last step (concerning the SVG outputs) is composed of three sub-steps which are respectively implemented by two transformations and one extraction. These steps are briefly described in the following sub-sections.
Transform Table model to SVG models
This transformation is about mapping the generic table concepts of the Table metamodel to the SVG ones (i.e. in our case generating bar charts and pie charts from tabular data): it produces a model that conforms to the SVG metamodel (see section 3.7) from a Table model.
Transform SVG models to XML models
The goal of this transformation is only to produce intermediate XML models in order to facilitate the extraction by allowing reusing the already existing XML extractor.
Extract SVG XML files from XML models
The produced XML models are then extracted into SVG-supporting software readable files, with the “.svg” extension, thanks to the XML extractor natively provided with ATL [20].
References
- ↑ The Bugzilla Metrics Use Case: http://www.eclipse.org/gmt/modisco/useCases/BugzillaMetrics/
- ↑ The Eclipse/GMT MoDisco Component: http://www.eclipse.org/gmt/modisco/
- ↑ MoDisco Use Cases: http://www.eclipse.org/MoDisco/useCases/
- ↑ Bugzilla Defect-Tracking System: http://www.bugzilla.org/
- ↑ Microsoft Office 2003 XML Schemas: http://www.microsoft.com/office/xml/default.mspx
- ↑ W3C SVG (Scalable Vector Graphics) Specification: http://www.w3.org/Graphics/SVG/
- ↑ The Metrics Visualization Builder Tool: http://www.eclipse.org/gmt/modisco/toolBox/MetricsVisualizationBuilder/
- ↑ INRIA ATLAS Team: http://www.inria.fr/recherche/equipes/atlas.en.html
- ↑ The MODELPLEX IST European Project: http://www.modelplex-ist.org
- ↑ The Eclipse/M2M ATL Component: http://www.eclipse.org/m2m/atl/
- ↑ The Eclipse/M2M ATL Component: http://www.eclipse.org/m2m/atl/
- ↑ The Metrics Visualization Builder Tool: http://www.eclipse.org/gmt/modisco/toolBox/MetricsVisualizationBuilder/
- ↑ Eclipse/GMT AM3 metamodels zoos: http://www.eclipse.org/gmt/am3/zoos/
- ↑ Bugzilla Defect-Tracking System: http://www.bugzilla.org/
- ↑ Microsoft Office 2003 XML Schemas: http://www.microsoft.com/office/xml/default.mspx
- ↑ W3C SVG (Scalable Vector Graphics) Specification: http://www.w3.org/Graphics/SVG/
- ↑ The Eclipse/M2M ATL Component: http://www.eclipse.org/m2m/atl/
- ↑ The Eclipse/M2M ATL Component: http://www.eclipse.org/m2m/atl/
- ↑ The Eclipse/M2M ATL Component: http://www.eclipse.org/m2m/atl/
- ↑ The Eclipse/M2M ATL Component: http://www.eclipse.org/m2m/atl/


