Notice: This Wiki is now read only and edits are no longer possible. Please see: https://gitlab.eclipse.org/eclipsefdn/helpdesk/-/wikis/Wiki-shutdown-plan for the plan.
Linux Tools Project/TMF/User Guide
Contents
- 1 Introduction
- 2 Implementing a New Trace Type
- 3 View Tutorial
- 4 Component Interaction
- 4.1 Sending Signals
- 4.2 Receiving Signals
- 4.3 Signal Throttling
- 4.4 Signal Reference
- 4.4.1 TmfStartSynchSignal
- 4.4.2 TmfEndSynchSignal
- 4.4.3 TmfTraceOpenedSignal
- 4.4.4 TmfTraceSelectedSignal
- 4.4.5 TmfTraceClosedSignal
- 4.4.6 TmfTraceRangeUpdatedSignal
- 4.4.7 TmfTraceUpdatedSignal
- 4.4.8 TmfTimeSynchSignal
- 4.4.9 TmfRangeSynchSignal
- 4.4.10 TmfEventFilterAppliedSignal
- 4.4.11 TmfEventSearchAppliedSignal
- 4.4.12 TmfTimestampFormatUpdateSignal
- 4.4.13 TmfStatsUpdatedSignal
- 4.4.14 TmfPacketStreamSelected
- 4.5 Debugging
- 5 Generic State System
- 5.1 Introduction
- 5.2 High-level components
- 5.3 Definitions
- 5.4 Relevant interfaces/classes
- 5.5 Comparison of state system backends
- 5.6 State System Operations
- 5.7 Code example
- 5.8 Mipmap feature
- 6 UML2 Sequence Diagram Framework
- 6.1 TMF UML2 Sequence Diagram Extensions
- 6.2 Management of the Extension Point
- 6.3 Sequence Diagram View
- 6.4 Tutorial
- 6.4.1 Prerequisites
- 6.4.2 Creating an Eclipse UI Plug-in
- 6.4.3 Creating a Sequence Diagram View
- 6.4.4 Defining the uml2SDLoader Extension
- 6.4.5 Implementing the Loader Class
- 6.4.6 Adding time information
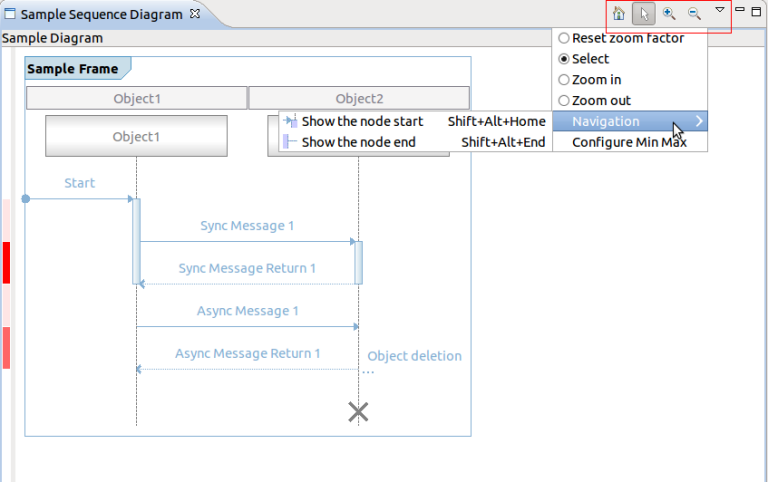
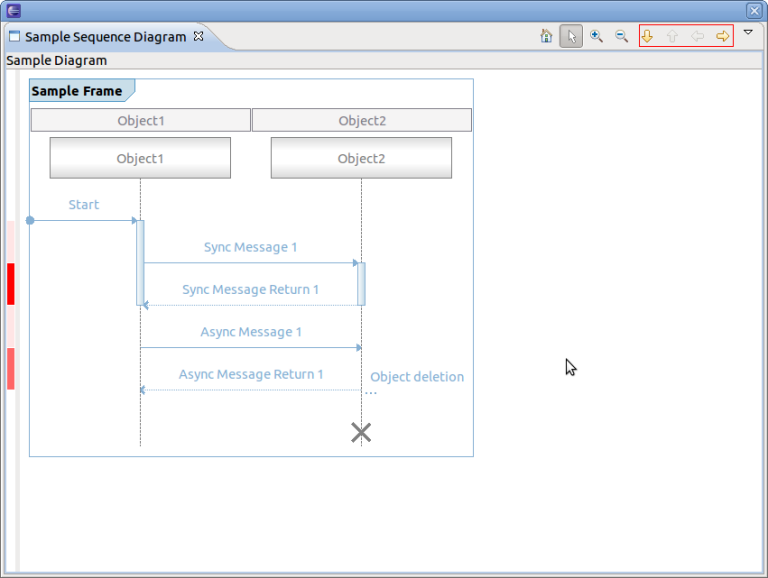
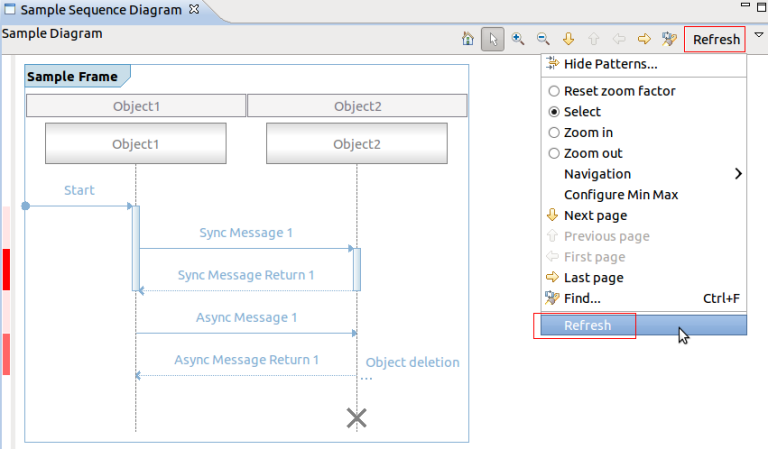
- 6.4.7 Default Coolbar and Menu Items
- 6.4.8 Implementing Optional Callbacks
- 6.4.8.1 Using the Paging Provider Interface
- 6.4.8.2 Using the Find Provider Interface
- 6.4.8.3 Using the Filter Provider Interface
- 6.4.8.4 Using the Extended Action Bar Provider Interface
- 6.4.8.5 Using the Properties Provider Interface
- 6.4.8.6 Using the Collapse Provider Interface
- 6.4.8.7 Using the Selection Provider Service
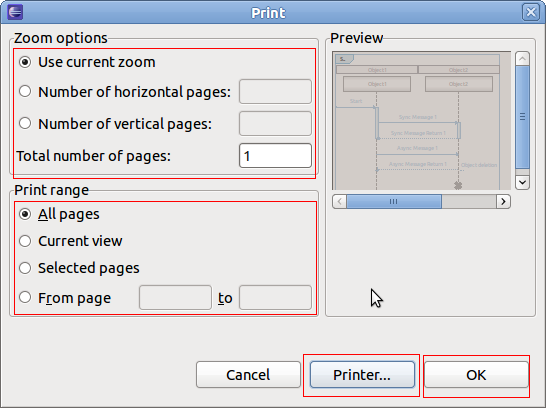
- 6.4.9 Printing a Sequence Diagram
- 6.4.10 Using one Sequence Diagram View with Multiple Loaders
- 6.4.11 Downloading the Tutorial
- 6.5 Integration of Tracing and Monitoring Framework with Sequence Diagram Framework
- 7 CTF Parser
- 8 Event matching and trace synchronization
- 9 Analysis Framework
- 10 Performance Tests
- 11 Network Tracing
Introduction
The purpose of the Tracing Monitoring Framework (TMF) is to facilitate the integration of tracing and monitoring tools into Eclipse, to provide out-of-the-box generic functionalities/views and provide extension mechanisms of the base functionalities for application specific purposes.
Implementing a New Trace Type
The framework can easily be extended to support more trace types. To make a new trace type, one must define the following items:
- The event type
- The trace reader
- The trace context
- The trace location
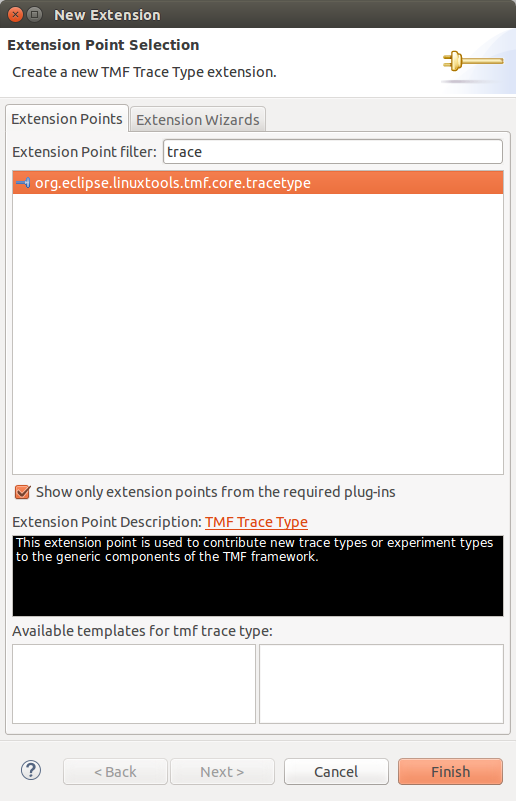
- The org.eclipse.linuxtools.tmf.core.tracetype plug-in extension point
- (Optional) The org.eclipse.linuxtools.tmf.ui.tracetypeui plug-in extension point
The event type must implement an ITmfEvent or extend a class that implements an ITmfEvent. Typically it will extend TmfEvent. The event type must contain all the data of an event. The trace reader must be of an ITmfTrace type. The TmfTrace class will supply many background operations so that the reader only needs to implement certain functions. The trace context can be seen as the internals of an iterator. It is required by the trace reader to parse events as it iterates the trace and to keep track of its rank and location. It can have a timestamp, a rank, a file position, or any other element, it should be considered to be ephemeral. The trace location is an element that is cloned often to store checkpoints, it is generally persistent. It is used to rebuild a context, therefore, it needs to contain enough information to unambiguously point to one and only one event. Finally the tracetype plug-in extension associates a given trace, non-programmatically to a trace type for use in the UI.
An Example: Nexus-lite parser
Description of the file
This is a very small subset of the nexus trace format, with some changes to make it easier to read. There is one file. This file starts with 64 Strings containing the event names, then an arbitrarily large number of events. The events are each 64 bits long. the first 32 are the timestamp in microseconds, the second 32 are split into 6 bits for the event type, and 26 for the data payload.
The trace type will be made of two parts, part 1 is the event description, it is just 64 strings, comma seperated and then a line feed.
Startup,Stop,Load,Add, ... ,reserved\n
Then there will be the events in this format
| timestamp (32 bits) | type (6 bits) | payload (26 bits) |
| 64 bits total | ||
all events will be the same size (64 bits).
NexusLite Plug-in
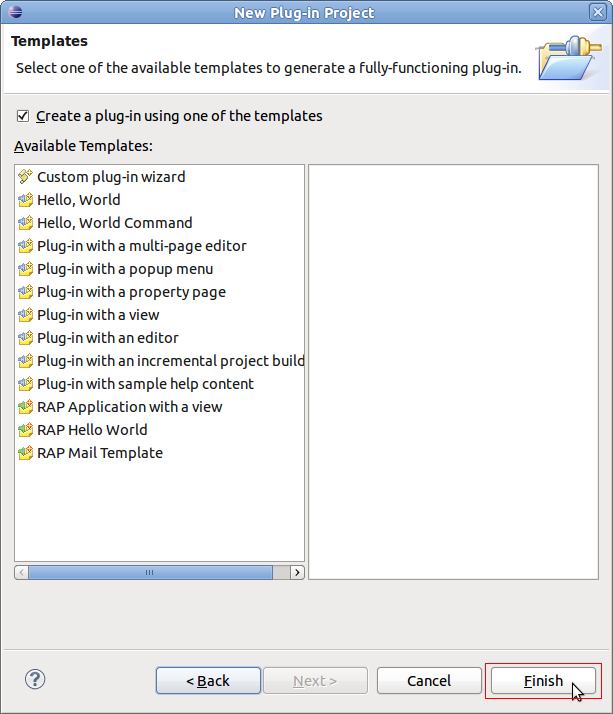
Create a New, Project..., Plug-in Project, set the title to com.example.nexuslite, click Next > then click on Finish.
Now the structure for the Nexus trace Plug-in is set up.
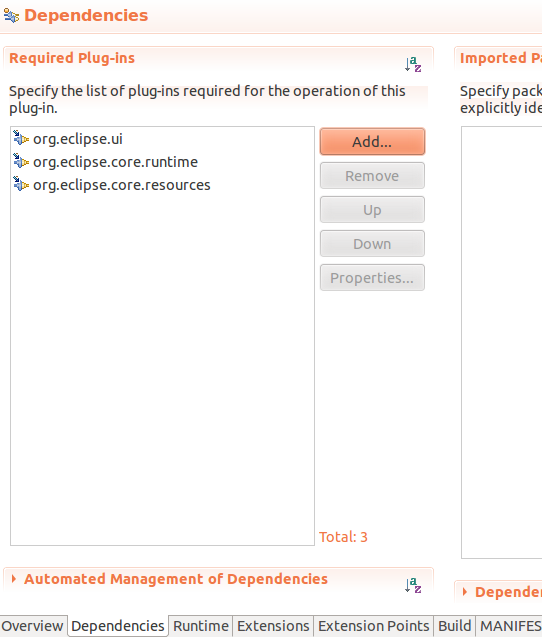
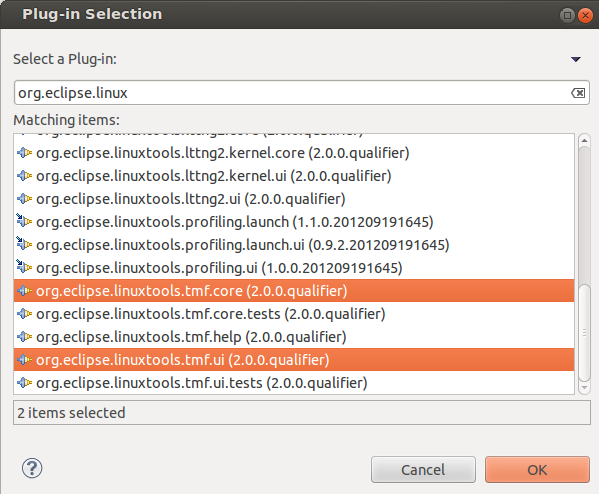
Add a dependency to TMF core and UI by opening the MANIFEST.MF in META-INF, selecting the Dependencies tab and Add ... org.eclipse.linuxtools.tmf.core and org.eclipse.linuxtools.tmf.ui.
Now the project can access TMF classes.
Trace Event
The TmfEvent class will work for this example. No code required.
Trace Reader
The trace reader will extend a TmfTrace class.
It will need to implement:
- validate (is the trace format valid?)
- initTrace (called as the trace is opened
- seekEvent (go to a position in the trace and create a context)
- getNext (implemented in the base class)
- parseEvent (read the next element in the trace)
For reference, there is an example implementation of the Nexus Trace file in org.eclipse.linuxtools.tracing.examples.core.trace.nexus.NexusTrace.java.
In this example, the validate function checks first checks if the file exists, then makes sure that it is really a file, and not a directory. Then we attempt to read the file header, to make sure that it is really a Nexus Trace. If that check passes, we return a TmfValidationStatus with a confidence of 20.
Typically, TmfValidationStatus confidences should range from 1 to 100. 1 meaning "there is a very small chance that this trace is of this type", and 100 meaning "it is this type for sure, and cannot be anything else". At run-time, the auto-detection will pick the the type which returned the highest confidence. So checks of the type "does the file exist?" should not return a too high confidence.
Here we used a confidence of 20, to leave "room" for more specific trace types in the Nexus format that could be defined in TMF.
The initTrace function will read the event names, and find where the data starts. After this, the number of events is known, and since each event is 8 bytes long according to the specs, the seek is then trivial.
The seek here will just reset the reader to the right location.
The parseEvent method needs to parse and return the current event and store the current location.
The getNext method (in base class) will read the next event and update the context. It calls the parseEvent method to read the event and update the location. It does not need to be overridden and in this example it is not. The sequence of actions necessary are parse the next event from the trace, create an ITmfEvent with that data, update the current location, call updateAttributes, update the context then return the event.
Traces will typically implement an index, to make seeking faster. The index can be rebuilt every time the trace is opened. Alternatively, it can be saved to disk, to make future openings of the same trace quicker. To do so, the trace object can implement the ITmfPersistentlyIndexable interface.
Trace Context
The trace context will be a TmfContext
Trace Location
The trace location will be a long, representing the rank in the file. The TmfLongLocation will be the used, once again, no code is required.
The org.eclipse.linuxtools.tmf.core.tracetype and org.eclipse.linuxtools.tmf.ui.tracetypeui plug-in extension point
One should implement the tmf.core.tracetype extension in their own plug-in. In this example, the Nexus trace plug-in will be modified.
The plugin.xml file in the ui plug-in needs to be updated if one wants users to access the given event type. It can be updated in the Eclipse plug-in editor.
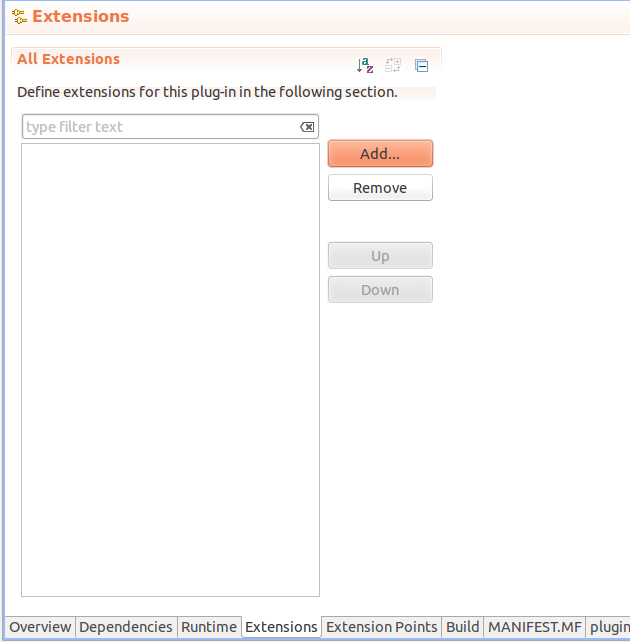
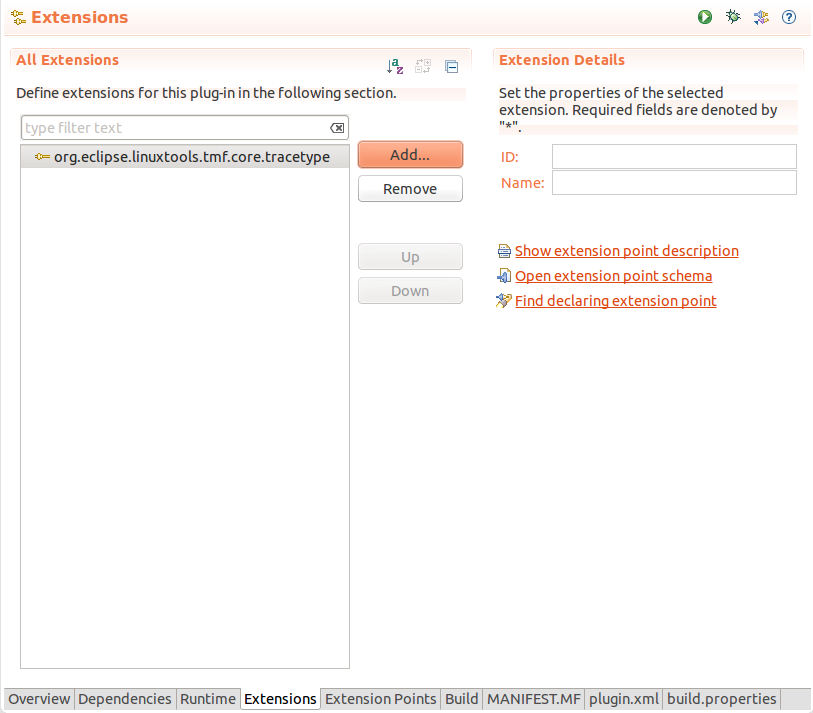
- In Extensions tab, add the org.eclipse.linuxtools.tmf.core.tracetype extension point.
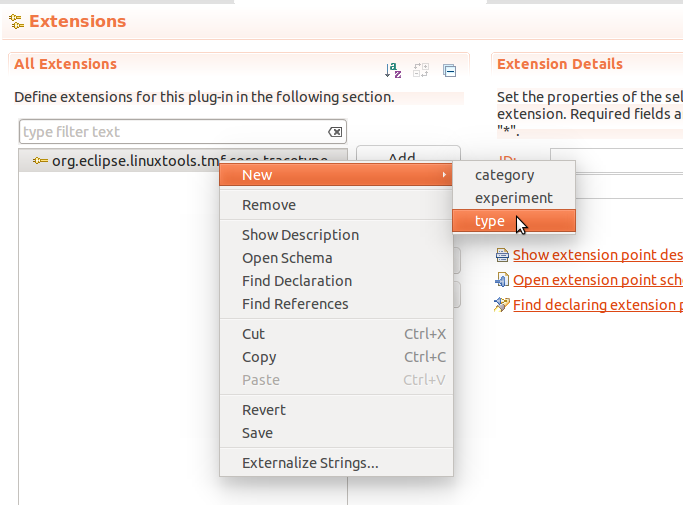
- Add in the org.eclipse.linuxtools.tmf.ui.tracetype extension a new type. To do that, right click on the extension then in the context menu, go to New >, type.
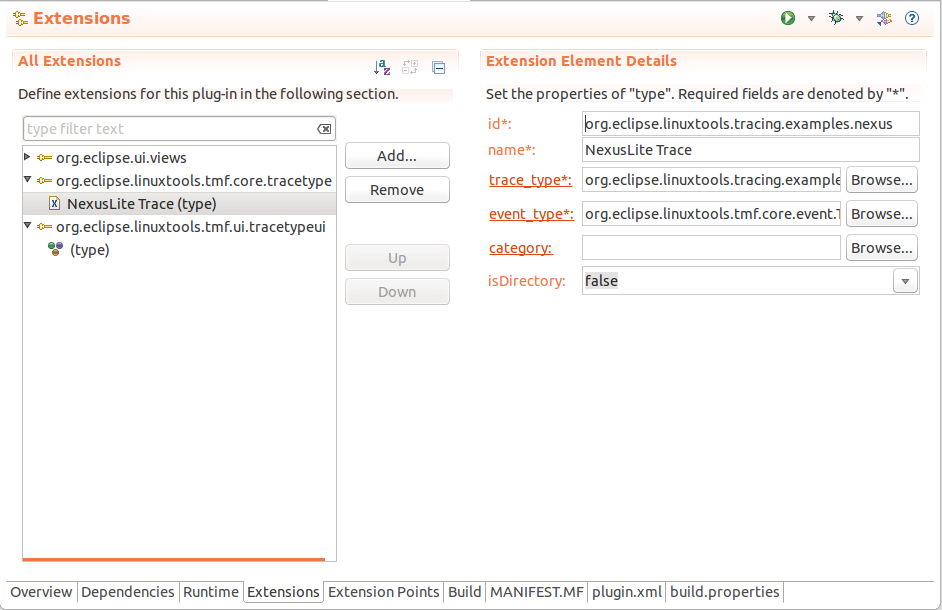
The id is the unique identifier used to refer to the trace.
The name is the field that shall be displayed when a trace type is selected.
The trace type is the canonical path refering to the class of the trace.
The event type is the canonical path refering to the class of the events of a given trace.
The category (optional) is the container in which this trace type will be stored.
- (Optional) To also add UI-specific properties to your trace type, use the org.eclipse.linuxtools.tmf.ui.tracetypeui extension. To do that,
right click on the extension then in the context menu, go to New >, type.
The tracetype here is the id of the org.eclipse.linuxtools.tmf.core.tracetype mentioned above.
The icon is the image to associate with that trace type.
In the end, the extension menu should look like this.
Best Practices
- Do not load the whole trace in RAM, it will limit the size of the trace that can be read.
- Reuse as much code as possible, it makes the trace format much easier to maintain.
- Use Eclipse's editor instead of editing the XML directly.
- Do not forget Java supports only signed data types, there may be special care needed to handle unsigned data.
- If the support for your trace has custom UI elements (like icons, views, etc.), split the core and UI parts in separate plugins, named identically except for a .core or .ui suffix.
- Implement the tmf.core.tracetype extension in the core plugin, and the tmf.ui.tracetypeui extension in the UI plugin if applicable.
Download the Code
The described example is available in the org.eclipse.linuxtools.tracing.examples.(tests.)trace.nexus packages with a trace generator and a quick test case.
Optional Trace Type Attributes
After defining the trace type as described in the previous chapters it is possible to define optional attributes for the trace type.
Default Editor
The defaultEditor attribute of the org.eclipse.tmf.ui.tracetypeui extension point allows for configuring the editor to use for displaying the events. If omitted, the TmfEventsEditor is used as default.
To configure an editor, first add the defaultEditor attribute to the trace type in the extension definition. This can be done by selecting the trace type in the plug-in manifest editor. Then click the right mouse button and select New -> defaultEditor in the context sensitive menu. Then select the newly added attribute. Now you can specify the editor id to use on the right side of the manifest editor. For example, this attribute could be used to implement an extension of the class org.eclipse.ui.part.MultiPageEditor. The first page could use the TmfEventsEditor' to display the events in a table as usual and other pages can display other aspects of the trace.
Events Table Type
The eventsTableType attribute of the org.eclipse.tmf.ui.tracetypeui extension point allows for configuring the events table class to use in the default events editor. If omitted, the default events table will be used.
To configure a trace type specific events table, first add the eventsTableType attribute to the trace type in the extension definition. This can be done by selecting the trace type in the plug-in manifest editor. Then click the right mouse button and select New -> eventsTableType in the context sensitive menu. Then select the newly added attribute and click on class on the right side of the manifest editor. The new class wizard will open. The superclass field will be already filled with the class org.eclipse.linuxtools.tmf.ui.viewers.events.TmfEventsTable.
By using this attribute, a table with different columns than the default columns can be defined. See the class org.eclipse.linuxtools.internal.lttng2.kernel.ui.viewers.events.Lttng2EventsTable for an example implementation.
View Tutorial
This tutorial describes how to create a simple view using the TMF framework and the SWTChart library. SWTChart is a library based on SWT that can draw several types of charts including a line chart which we will use in this tutorial. We will create a view containing a line chart that displays time stamps on the X axis and the corresponding event values on the Y axis.
This tutorial will cover concepts like:
- Extending TmfView
- Signal handling (@TmfSignalHandler)
- Data requests (TmfEventRequest)
- SWTChart integration
Note: TMF 3.0.0 provides base implementations for generating SWTChart viewers and views. For more details please refer to chapter #TMF Built-in Views and Viewers.
Prerequisites
The tutorial is based on Eclipse 4.4 (Eclipse Luna), TMF 3.0.0 and SWTChart 0.7.0. If you are using TMF from the source repository, SWTChart is already included in the target definition file (see org.eclipse.linuxtools.lttng.target). You can also install it manually by using the Orbit update site. http://download.eclipse.org/tools/orbit/downloads/
Creating an Eclipse UI Plug-in
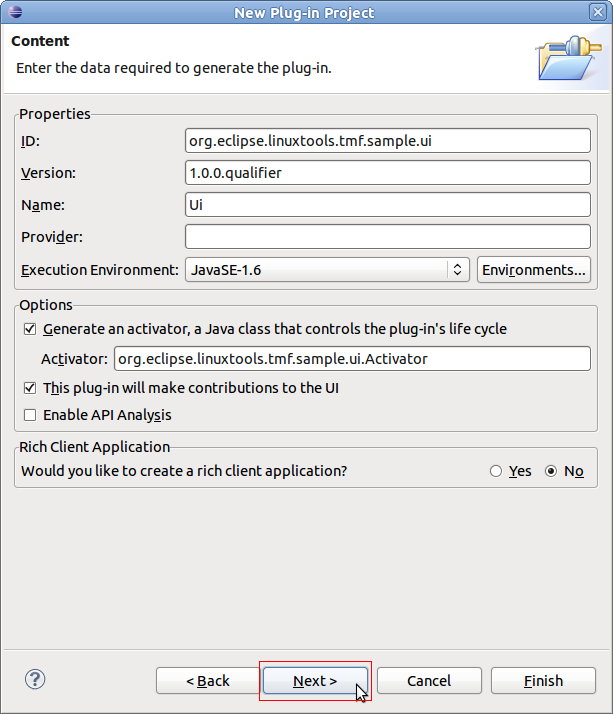
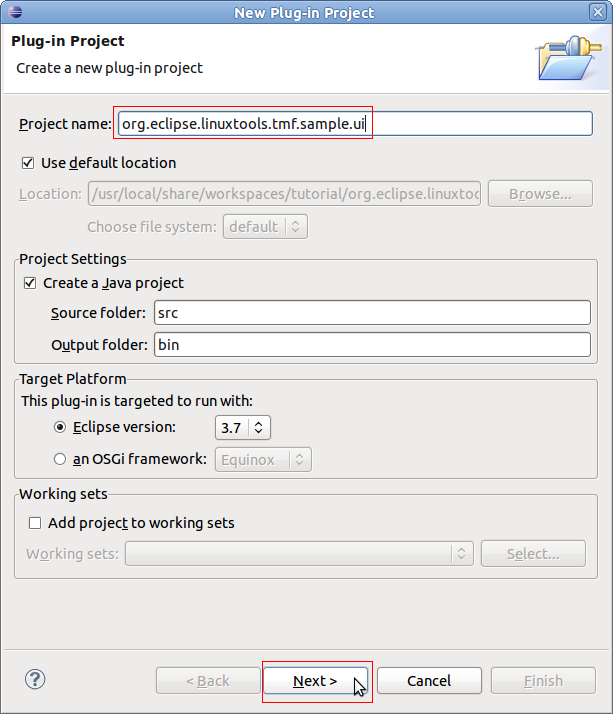
To create a new project with name org.eclipse.linuxtools.tmf.sample.ui select File -> New -> Project -> Plug-in Development -> Plug-in Project.
Creating a View
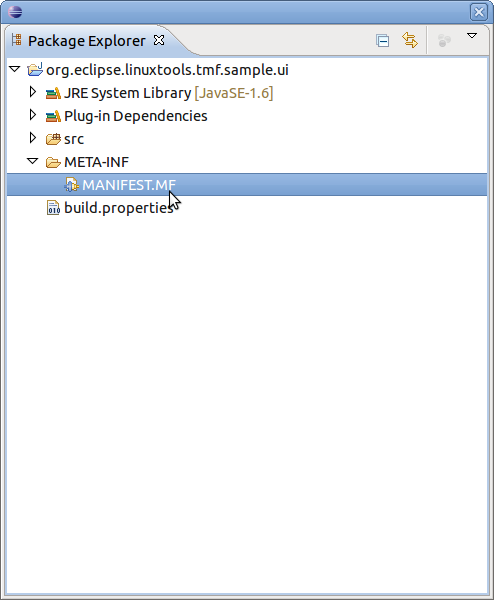
To open the plug-in manifest, double-click on the MANIFEST.MF file.
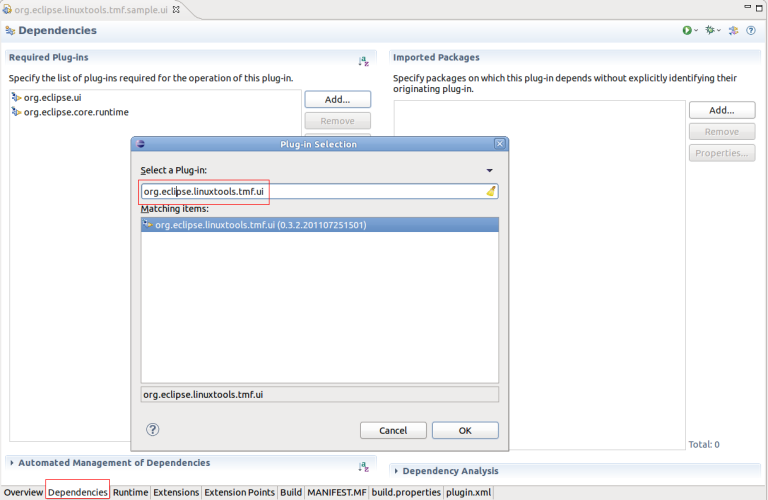
Change to the Dependencies tab and select Add... of the Required Plug-ins section. A new dialog box will open. Next find plug-in org.eclipse.linuxtools.tmf.core and press OK
Following the same steps, add org.eclipse.linuxtools.tmf.ui and org.swtchart.
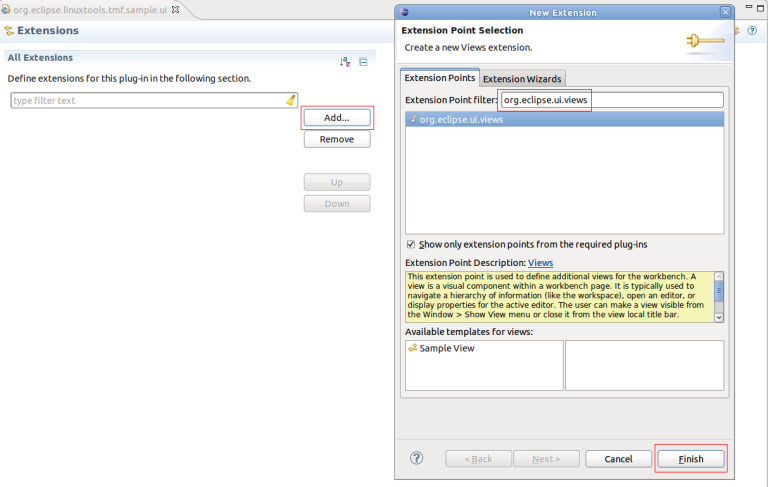
Change to the Extensions tab and select Add... of the All Extension section. A new dialog box will open. Find the view extension org.eclipse.ui.views and press Finish.
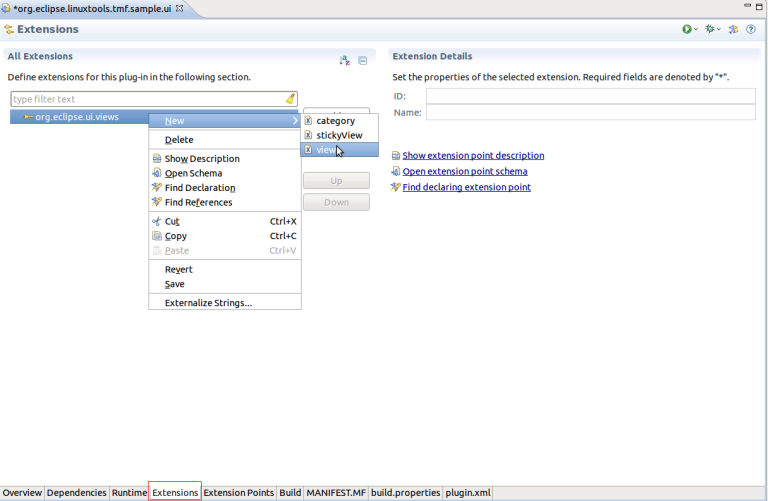
To create a view, click the right mouse button. Then select New -> view
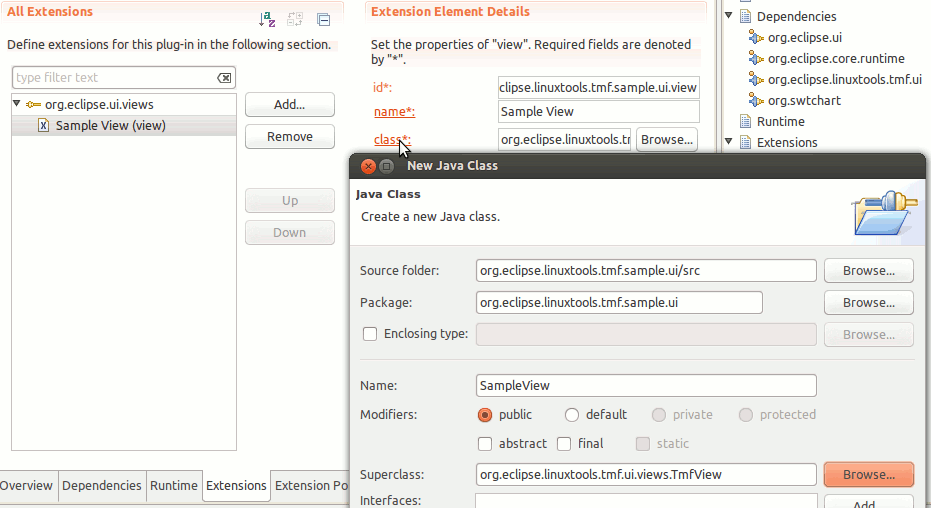
A new view entry has been created. Fill in the fields id and name. For class click on the class hyperlink and it will show the New Java Class dialog. Enter the name SampleView, change the superclass to TmfView and click Finish. This will create the source file and fill the class field in the process. We use TmfView as the superclass because it provides extra functionality like getting the active trace, pinning and it has support for signal handling between components.
This will generate an empty class. Once the quick fixes are applied, the following code is obtained:
package org.eclipse.linuxtools.tmf.sample.ui;

import org.eclipse.swt.widgets.Composite;
import org.eclipse.ui.part.ViewPart;

public class SampleView extends TmfView {

    public SampleView(String viewName) {
        super(viewName);
        // TODO Auto-generated constructor stub
    }

    @Override
    public void createPartControl(Composite parent) {
        // TODO Auto-generated method stub

    }

    @Override
    public void setFocus() {
        // TODO Auto-generated method stub

    }

}
This creates an empty view, however the basic structure is now is place.
Implementing a view
We will start by adding a empty chart then it will need to be populated with the trace data. Finally, we will make the chart more visually pleasing by adjusting the range and formating the time stamps.
Adding an Empty Chart
First, we can add an empty chart to the view and initialize some of its components.
    private static final String SERIES_NAME = "Series";
    private static final String Y_AXIS_TITLE = "Signal";
    private static final String X_AXIS_TITLE = "Time";
    private static final String FIELD = "value"; // The name of the field that we want to display on the Y axis
    private static final String VIEW_ID = "org.eclipse.linuxtools.tmf.sample.ui.view";
    private Chart chart;
    private ITmfTrace currentTrace;

    public SampleView() {
        super(VIEW_ID);
    }

    @Override
    public void createPartControl(Composite parent) {
        chart = new Chart(parent, SWT.BORDER);
        chart.getTitle().setVisible(false);
        chart.getAxisSet().getXAxis(0).getTitle().setText(X_AXIS_TITLE);
        chart.getAxisSet().getYAxis(0).getTitle().setText(Y_AXIS_TITLE);
        chart.getSeriesSet().createSeries(SeriesType.LINE, SERIES_NAME);
        chart.getLegend().setVisible(false);
    }

    @Override
    public void setFocus() {
        chart.setFocus();
    }
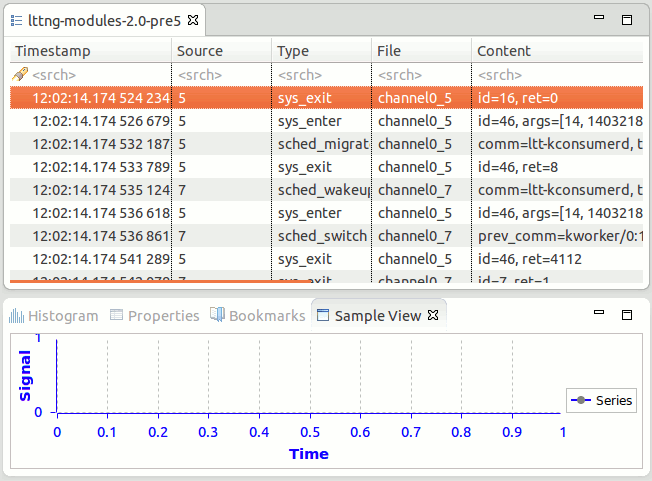
The view is prepared. Run the Example. To launch the an Eclipse Application select the Overview tab and click on Launch an Eclipse Application
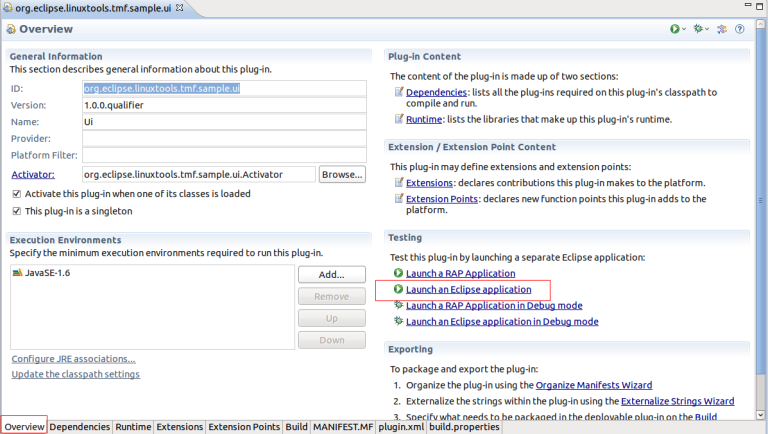
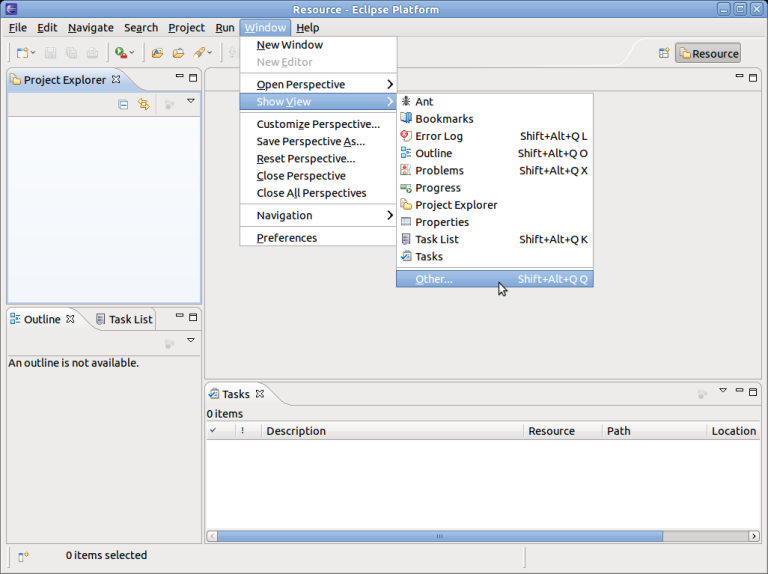
A new Eclipse application window will show. In the new window go to Windows -> Show View -> Other... -> Other -> Sample View.
You should now see a view containing an empty chart
Signal Handling
We would like to populate the view when a trace is selected. To achieve this, we can use a signal hander which is specified with the @TmfSignalHandler annotation.
    @TmfSignalHandler
    public void traceSelected(final TmfTraceSelectedSignal signal) {

    }
Requesting Data
Then we need to actually gather data from the trace. This is done asynchronously using a TmfEventRequest
    @TmfSignalHandler
    public void traceSelected(final TmfTraceSelectedSignal signal) {
        // Don't populate the view again if we're already showing this trace
        if (currentTrace == signal.getTrace()) {
            return;
        }
        currentTrace = signal.getTrace();

        // Create the request to get data from the trace

        TmfEventRequest req = new TmfEventRequest(TmfEvent.class,
                TmfTimeRange.ETERNITY, 0, ITmfEventRequest.ALL_DATA,
                ITmfEventRequest.ExecutionType.BACKGROUND) {

            @Override
            public void handleData(ITmfEvent data) {
                // Called for each event
                super.handleData(data);
            }

            @Override
            public void handleSuccess() {
                // Request successful, not more data available
                super.handleSuccess();
            }

            @Override
            public void handleFailure() {
                // Request failed, not more data available
                super.handleFailure();
            }
        };
        ITmfTrace trace = signal.getTrace();
        trace.sendRequest(req);
    }
Transferring Data to the Chart
The chart expects an array of doubles for both the X and Y axis values. To provide that, we can accumulate each event's time and value in their respective list then convert the list to arrays when all events are processed.
        TmfEventRequest req = new TmfEventRequest(TmfEvent.class,
                TmfTimeRange.ETERNITY, 0, ITmfEventRequest.ALL_DATA,
                ITmfEventRequest.ExecutionType.BACKGROUND) {

            ArrayList<Double> xValues = new ArrayList<Double>();
            ArrayList<Double> yValues = new ArrayList<Double>();

            @Override
            public void handleData(ITmfEvent data) {
                // Called for each event
                super.handleData(data);
                ITmfEventField field = data.getContent().getField(FIELD);
                if (field != null) {
                    yValues.add((Double) field.getValue());
                    xValues.add((double) data.getTimestamp().getValue());
                }
            }

            @Override
            public void handleSuccess() {
                // Request successful, not more data available
                super.handleSuccess();

                final double x[] = toArray(xValues);
                final double y[] = toArray(yValues);

                // This part needs to run on the UI thread since it updates the chart SWT control
                Display.getDefault().asyncExec(new Runnable() {

                    @Override
                    public void run() {
                        chart.getSeriesSet().getSeries()[0].setXSeries(x);
                        chart.getSeriesSet().getSeries()[0].setYSeries(y);

                        chart.redraw();
                    }

                });
            }

            /**
             * Convert List<Double> to double[]
             */
            private double[] toArray(List<Double> list) {
                double[] d = new double[list.size()];
                for (int i = 0; i < list.size(); ++i) {
                    d[i] = list.get(i);
                }

                return d;
            }
        };
Adjusting the Range
The chart now contains values but they might be out of range and not visible. We can adjust the range of each axis by computing the minimum and maximum values as we add events.
            ArrayList<Double> xValues = new ArrayList<Double>();
            ArrayList<Double> yValues = new ArrayList<Double>();
            private double maxY = -Double.MAX_VALUE;
            private double minY = Double.MAX_VALUE;
            private double maxX = -Double.MAX_VALUE;
            private double minX = Double.MAX_VALUE;

            @Override
            public void handleData(ITmfEvent data) {
                super.handleData(data);
                ITmfEventField field = data.getContent().getField(FIELD);
                if (field != null) {
                    Double yValue = (Double) field.getValue();
                    minY = Math.min(minY, yValue);
                    maxY = Math.max(maxY, yValue);
                    yValues.add(yValue);

                    double xValue = (double) data.getTimestamp().getValue();
                    xValues.add(xValue);
                    minX = Math.min(minX, xValue);
                    maxX = Math.max(maxX, xValue);
                }
            }

            @Override
            public void handleSuccess() {
                super.handleSuccess();
                final double x[] = toArray(xValues);
                final double y[] = toArray(yValues);

                // This part needs to run on the UI thread since it updates the chart SWT control
                Display.getDefault().asyncExec(new Runnable() {

                    @Override
                    public void run() {
                        chart.getSeriesSet().getSeries()[0].setXSeries(x);
                        chart.getSeriesSet().getSeries()[0].setYSeries(y);

                        // Set the new range
                        if (!xValues.isEmpty() && !yValues.isEmpty()) {
                            chart.getAxisSet().getXAxis(0).setRange(new Range(0, x[x.length - 1]));
                            chart.getAxisSet().getYAxis(0).setRange(new Range(minY, maxY));
                        } else {
                            chart.getAxisSet().getXAxis(0).setRange(new Range(0, 1));
                            chart.getAxisSet().getYAxis(0).setRange(new Range(0, 1));
                        }
                        chart.getAxisSet().adjustRange();

                        chart.redraw();
                    }
                });
            }
Formatting the Time Stamps
To display the time stamps on the X axis nicely, we need to specify a format or else the time stamps will be displayed as long. We use TmfTimestampFormat to make it consistent with the other TMF views. We also need to handle the TmfTimestampFormatUpdateSignal to make sure that the time stamps update when the preferences change.
    @Override
    public void createPartControl(Composite parent) {
        ...

        chart.getAxisSet().getXAxis(0).getTick().setFormat(new TmfChartTimeStampFormat());
    }

    public class TmfChartTimeStampFormat extends SimpleDateFormat {
        private static final long serialVersionUID = 1L;
        @Override
        public StringBuffer format(Date date, StringBuffer toAppendTo, FieldPosition fieldPosition) {
            long time = date.getTime();
            toAppendTo.append(TmfTimestampFormat.getDefaulTimeFormat().format(time));
            return toAppendTo;
        }
    }

    @TmfSignalHandler
    public void timestampFormatUpdated(TmfTimestampFormatUpdateSignal signal) {
        // Called when the time stamp preference is changed
        chart.getAxisSet().getXAxis(0).getTick().setFormat(new TmfChartTimeStampFormat());
        chart.redraw();
    }
We also need to populate the view when a trace is already selected and the view is opened. We can reuse the same code by having the view send the TmfTraceSelectedSignal to itself.
    @Override
    public void createPartControl(Composite parent) {
        ...

        ITmfTrace trace = getActiveTrace();
        if (trace != null) {
            traceSelected(new TmfTraceSelectedSignal(this, trace));
        }
    }
The view is now ready but we need a proper trace to test it. For this example, a trace was generated using LTTng-UST so that it would produce a sine function.
In summary, we have implemented a simple TMF view using the SWTChart library. We made use of signals and requests to populate the view at the appropriate time and we formated the time stamps nicely. We also made sure that the time stamp format is updated when the preferences change.
TMF Built-in Views and Viewers
TMF provides base implementations for several types of views and viewers for generating custom X-Y-Charts, Time Graphs, or Trees. They are well integrated with various TMF features such as reading traces and time synchronization with other views. They also handle mouse events for navigating the trace and view, zooming or presenting detailed information at mouse position. The code can be found in the TMF UI plug-in org.eclipse.linuxtools.tmf.ui. See below for a list of relevant java packages:
- Generic
- org.eclipse.linuxtools.tmf.ui.views: Common TMF view base classes
- X-Y-Chart
- org.eclipse.linuxtools.tmf.ui.viewers.xycharts: Common base classes for X-Y-Chart viewers based on SWTChart
- org.eclipse.linuxtools.tmf.ui.viewers.xycharts.barcharts: Base classes for bar charts
- org.eclipse.linuxtools.tmf.ui.viewers.xycharts.linecharts: Base classes for line charts
- Time Graph View
- org.eclipse.linuxtools.tmf.ui.widgets.timegraph: Base classes for time graphs e.g. Gantt-charts
- Tree Viewer
- org.eclipse.linuxtools.tmf.ui.viewers.tree: Base classes for TMF specific tree viewers
Several features in TMF and the Eclipse LTTng integration are using this framework and can be used as example for further developments:
- X-Y- Chart
- org.eclipse.linuxtools.internal.lttng2.ust.ui.views.memusage.MemUsageView.java
- org.eclipse.linuxtools.internal.lttng2.kernel.ui.views.cpuusage.CpuUsageView.java
- org.eclipse.linuxtools.tracing.examples.ui.views.histogram.NewHistogramView.java
- Time Graph View
- org.eclipse.linuxtools.internal.lttng2.kernel.ui.views.controlflow.ControlFlowView.java
- org.eclipse.linuxtools.internal.lttng2.kernel.ui.views.resources.ResourcesView.java
- Tree Viewer
- org.eclipse.linuxtools.tmf.ui.views.statesystem.TmfStateSystemExplorer.java
- org.eclipse.linuxtools.internal.lttng2.kernel.ui.views.cpuusage.CpuUsageComposite.java
Component Interaction
TMF provides a mechanism for different components to interact with each other using signals. The signals can carry information that is specific to each signal.
The TMF Signal Manager handles registration of components and the broadcasting of signals to their intended receivers.
Components can register as VIP receivers which will ensure they will receive the signal before non-VIP receivers.
Sending Signals
In order to send a signal, an instance of the signal must be created and passed as argument to the signal manager to be dispatched. Every component that can handle the signal will receive it. The receivers do not need to be known by the sender.
TmfExampleSignal signal = new TmfExampleSignal(this, ...);
TmfSignalManager.dispatchSignal(signal);
If the sender is an instance of the class TmfComponent, the broadcast method can be used:
TmfExampleSignal signal = new TmfExampleSignal(this, ...);
broadcast(signal);
Receiving Signals
In order to receive any signal, the receiver must first be registered with the signal manager. The receiver can register as a normal or VIP receiver.
TmfSignalManager.register(this);
TmfSignalManager.registerVIP(this);
If the receiver is an instance of the class TmfComponent, it is automatically registered as a normal receiver in the constructor.
When the receiver is destroyed or disposed, it should deregister itself from the signal manager.
TmfSignalManager.deregister(this);
To actually receive and handle any specific signal, the receiver must use the @TmfSignalHandler annotation and implement a method that will be called when the signal is broadcast. The name of the method is irrelevant.
@TmfSignalHandler
public void example(TmfExampleSignal signal) {
    ...
}
The source of the signal can be used, if necessary, by a component to filter out and ignore a signal that was broadcast by itself when the component is also a receiver of the signal but only needs to handle it when it was sent by another component or another instance of the component.
Signal Throttling
It is possible for a TmfComponent instance to buffer the dispatching of signals so that only the last signal queued after a specified delay without any other signal queued is sent to the receivers. All signals that are preempted by a newer signal within the delay are discarded.
The signal throttler must first be initialized:
final int delay = 100; // in ms
TmfSignalThrottler throttler = new TmfSignalThrottler(this, delay);
Then the sending of signals should be queued through the throttler:
TmfExampleSignal signal = new TmfExampleSignal(this, ...);
throttler.queue(signal);
When the throttler is no longer needed, it should be disposed:
throttler.dispose();
Signal Reference
The following is a list of built-in signals defined in the framework.
TmfStartSynchSignal
Purpose
This signal is used to indicate the start of broadcasting of a signal. Internally, the data provider will not fire event requests until the corresponding TmfEndSynchSignal signal is received. This allows coalescing of requests triggered by multiple receivers of the broadcast signal.
Senders
Sent by TmfSignalManager before dispatching a signal to all receivers.
Receivers
Received by TmfDataProvider.
TmfEndSynchSignal
Purpose
This signal is used to indicate the end of broadcasting of a signal. Internally, the data provider fire all pending event requests that were received and buffered since the corresponding TmfStartSynchSignal signal was received. This allows coalescing of requests triggered by multiple receivers of the broadcast signal.
Senders
Sent by TmfSignalManager after dispatching a signal to all receivers.
Receivers
Received by TmfDataProvider.
TmfTraceOpenedSignal
Purpose
This signal is used to indicate that a trace has been opened in an editor.
Senders
Sent by a TmfEventsEditor instance when it is created.
Receivers
Received by TmfTrace, TmfExperiment, TmfTraceManager and every view that shows trace data. Components that show trace data should handle this signal.
TmfTraceSelectedSignal
Purpose
This signal is used to indicate that a trace has become the currently selected trace.
Senders
Sent by a TmfEventsEditor instance when it receives focus. Components can send this signal to make a trace editor be brought to front.
Receivers
Received by TmfTraceManager and every view that shows trace data. Components that show trace data should handle this signal.
TmfTraceClosedSignal
Purpose
This signal is used to indicate that a trace editor has been closed.
Senders
Sent by a TmfEventsEditor instance when it is disposed.
Receivers
Received by TmfTraceManager and every view that shows trace data. Components that show trace data should handle this signal.
TmfTraceRangeUpdatedSignal
Purpose
This signal is used to indicate that the valid time range of a trace has been updated. This triggers indexing of the trace up to the end of the range. In the context of streaming, this end time is considered a safe time up to which all events are guaranteed to have been completely received. For non-streaming traces, the end time is set to infinity indicating that all events can be read immediately. Any processing of trace events that wants to take advantage of request coalescing should be triggered by this signal.
Senders
Sent by TmfExperiment and non-streaming TmfTrace. Streaming traces should send this signal in the TmfTrace subclass when a new safe time is determined by a specific implementation.
Receivers
Received by TmfTrace, TmfExperiment and components that process trace events. Components that need to process trace events should handle this signal.
TmfTraceUpdatedSignal
Purpose
This signal is used to indicate that new events have been indexed for a trace.
Senders
Sent by TmfCheckpointIndexer when new events have been indexed and the number of events has changed.
Receivers
Received by components that need to be notified of a new trace event count.
TmfTimeSynchSignal
Purpose
This signal is used to indicate that a new time or time range has been selected. It contains a begin and end time. If a single time is selected then the begin and end time are the same.
Senders
Sent by any component that allows the user to select a time or time range.
Receivers
Received by any component that needs to be notified of the currently selected time or time range.
TmfRangeSynchSignal
Purpose
This signal is used to indicate that a new time range window has been set.
Senders
Sent by any component that allows the user to set a time range window.
Receivers
Received by any component that needs to be notified of the current visible time range window.
TmfEventFilterAppliedSignal
Purpose
This signal is used to indicate that a filter has been applied to a trace.
Senders
Sent by TmfEventsTable when a filter is applied.
Receivers
Received by any component that shows trace data and needs to be notified of applied filters.
TmfEventSearchAppliedSignal
Purpose
This signal is used to indicate that a search has been applied to a trace.
Senders
Sent by TmfEventsTable when a search is applied.
Receivers
Received by any component that shows trace data and needs to be notified of applied searches.
TmfTimestampFormatUpdateSignal
Purpose
This signal is used to indicate that the timestamp format preference has been updated.
Senders
Sent by TmfTimestampFormat when the default timestamp format preference is changed.
Receivers
Received by any component that needs to refresh its display for the new timestamp format.
TmfStatsUpdatedSignal
Purpose
This signal is used to indicate that the statistics data model has been updated.
Senders
Sent by statistic providers when new statistics data has been processed.
Receivers
Received by statistics viewers and any component that needs to be notified of a statistics update.
TmfPacketStreamSelected
Purpose
This signal is used to indicate that the user has selected a packet stream to analyze.
Senders
Sent by the Stream List View when the user selects a new packet stream.
Receivers
Received by views that analyze packet streams.
Debugging
TMF has built-in Eclipse tracing support for the debugging of signal interaction between components. To enable it, open the Run/Debug Configuration... dialog, select a configuration, click the Tracing tab, select the plug-in org.eclipse.linuxtools.tmf.core, and check the signal item.
All signals sent and received will be logged to the file TmfTrace.log located in the Eclipse home directory.
Generic State System
Introduction
The Generic State System is a utility available in TMF to track different states over the duration of a trace. It works by first sending some or all events of the trace into a state provider, which defines the state changes for a given trace type. Once built, views and analysis modules can then query the resulting database of states (called "state history") to get information.
For example, let's suppose we have the following sequence of events in a kernel trace:
10 s, sys_open, fd = 5, file = /home/user/myfile
...
15 s, sys_read, fd = 5, size=32
...
20 s, sys_close, fd = 5
Now let's say we want to implement an analysis module which will track the amount of bytes read and written to each file. Here, of course the sys_read is interesting. However, by just looking at that event, we have no information on which file is being read, only its fd (5) is known. To get the match fd5 = /home/user/myfile, we have to go back to the sys_open event which happens 5 seconds earlier.
But since we don't know exactly where this sys_open event is, we will have to go back to the very start of the trace, and look through events one by one! This is obviously not efficient, and will not scale well if we want to analyze many similar patterns, or for very large traces.
A solution in this case would be to use the state system to keep track of the amount of bytes read/written to every *filename* (instead of every file descriptor, like we get from the events). Then the module could ask the state system "what is the amount of bytes read for file "/home/user/myfile" at time 16 s", and it would return the answer "32" (assuming there is no other read than the one shown).
High-level components
The State System infrastructure is composed of 3 parts:
- The state provider
- The central state system
- The storage backend
The state provider is the customizable part. This is where the mapping from trace events to state changes is done. This is what you want to implement for your specific trace type and analysis type. It's represented by the ITmfStateProvider interface (with a threaded implementation in AbstractTmfStateProvider, which you can extend).
The core of the state system is exposed through the ITmfStateSystem and ITmfStateSystemBuilder interfaces. The former allows only read-only access and is typically used for views doing queries. The latter also allows writing to the state history, and is typically used by the state provider.
Finally, each state system has its own separate backend. This determines how the intervals, or the "state history", are saved (in RAM, on disk, etc.) You can select the type of backend at construction time in the TmfStateSystemFactory.
Definitions
Before we dig into how to use the state system, we should go over some useful definitions:
Attribute
An attribute is the smallest element of the model that can be in any particular state. When we refer to the "full state", in fact it means we are interested in the state of every single attribute of the model.
Attribute Tree
Attributes in the model can be placed in a tree-like structure, a bit like files and directories in a file system. However, note that an attribute can always have both a value and sub-attributes, so they are like files and directories at the same time. We are then able to refer to every single attribute with its path in the tree.
For example, in the attribute tree for LTTng kernel traces, we use the following attributes, among others:
|- Processes
|    |- 1000
|    |   |- PPID
|    |   |- Exec_name
|    |- 1001
|    |   |- PPID
|    |   |- Exec_name
|   ...
|- CPUs
     |- 0
     |  |- Status
     |  |- Current_pid
    ...
In this model, the attribute "Processes/1000/PPID" refers to the PPID of process with PID 1000. The attribute "CPUs/0/Status" represents the status (running, idle, etc.) of CPU 0. "Processes/1000/PPID" and "Processes/1001/PPID" are two different attribute, even though their base name is the same: the whole path is the unique identifier.
The value of each attribute can change over the duration of the trace, independently of the other ones, and independently of its position in the tree.
The tree-like organization is optional, all attributes could be at the same level. But it's possible to put them in a tree, and it helps make things clearer.
Quark
In addition to a given path, each attribute also has a unique integer identifier, called the "quark". To continue with the file system analogy, this is like the inode number. When a new attribute is created, a new unique quark will be assigned automatically. They are assigned incrementally, so they will normally be equal to their order of creation, starting at 0.
Methods are offered to get the quark of an attribute from its path. The API methods for inserting state changes and doing queries normally use quarks instead of paths. This is to encourage users to cache the quarks and re-use them, which avoids re-walking the attribute tree over and over, which avoids unneeded hashing of strings.
State value
The path and quark of an attribute will remain constant for the whole duration of the trace. However, the value carried by the attribute will change. The value of a specific attribute at a specific time is called the state value.
In the TMF implementation, state values can be integers, longs, doubles, or strings. There is also a "null value" type, which is used to indicate that no particular value is active for this attribute at this time, but without resorting to a 'null' reference.
Any other type of value could be used, as long as the backend knows how to store it.
Note that the TMF implementation also forces every attribute to always carry the same type of state value. This is to make it simpler for views, so they can expect that an attribute will always use a given type, without having to check every single time. Null values are an exception, they are always allowed for all attributes, since they can safely be "unboxed" into all types.
State change
A state change is the element that is inserted in the state system. It consists of:
- a timestamp (the time at which the state change occurs)
- an attribute (the attribute whose value will change)
- a state value (the new value that the attribute will carry)
It's not an object per se in the TMF implementation (it's represented by a function call in the state provider). Typically, the state provider will insert zero, one or more state changes for every trace event, depending on its event type, payload, etc.
Note, we use "timestamp" here, but it's in fact a generic term that could be referred to as "index". For example, if a given trace type has no notion of timestamp, the event rank could be used.
In the TMF implementation, the timestamp is a long (64-bit integer).
State interval
State changes are inserted into the state system, but state intervals are the objects that come out on the other side. Those are stocked in the storage backend. A state interval represents a "state" of an attribute we want to track. When doing queries on the state system, intervals are what is returned. The components of a state interval are:
- Start time
- End time
- State value
- Quark
The start and end times represent the time range of the state. The state value is the same as the state value in the state change that started this interval. The interval also keeps a reference to its quark, although you normally know your quark in advance when you do queries.
State history
The state history is the name of the container for all the intervals created by the state system. The exact implementation (how the intervals are stored) is determined by the storage backend that is used.
Some backends will use a state history that is peristent on disk, others do not. When loading a trace, if a history file is available and the backend supports it, it will be loaded right away, skipping the need to go through another construction phase.
Construction phase
Before we can query a state system, we need to build the state history first. To do so, trace events are sent one-by-one through the state provider, which in turn sends state changes to the central component, which then creates intervals and stores them in the backend. This is called the construction phase.
Note that the state system needs to receive its events into chronological order. This phase will end once the end of the trace is reached.
Also note that it is possible to query the state system while it is being build. Any timestamp between the start of the trace and the current end time of the state system (available with ITmfStateSystem#getCurrentEndTime()) is a valid timestamp that can be queried.
Queries
As mentioned previously, when doing queries on the state system, the returned objects will be state intervals. In most cases it's the state *value* we are interested in, but since the backend has to instantiate the interval object anyway, there is no additional cost to return the interval instead. This way we also get the start and end times of the state "for free".
There are two types of queries that can be done on the state system:
Full queries
A full query means that we want to retrieve the whole state of the model for one given timestamp. As we remember, this means "the state of every single attribute in the model". As parameter we only need to pass the timestamp (see the API methods below). The return value will be an array of intervals, where the offset in the array represents the quark of each attribute.
Single queries
In other cases, we might only be interested in the state of one particular attribute at one given timestamp. For these cases it's better to use a single query. For a single query. we need to pass both a timestamp and a quark in parameter. The return value will be a single interval, representing the state that this particular attribute was at that time.
Single queries are typically faster than full queries (but once again, this depends on the backend that is used), but not by much. Even if you only want the state of say 10 attributes out of 200, it could be faster to use a full query and only read the ones you need. Single queries should be used for cases where you only want one attribute per timestamp (for example, if you follow the state of the same attribute over a time range).
Relevant interfaces/classes
This section will describe the public interface and classes that can be used if you want to use the state system.
Main classes in org.eclipse.linuxtools.tmf.core.statesystem
ITmfStateProvider / AbstractTmfStateProvider
ITmfStateProvider is the interface you have to implement to define your state provider. This is where most of the work has to be done to use a state system for a custom trace type or analysis type.
For first-time users, it's recommended to extend AbstractTmfStateProvider instead. This class takes care of all the initialization mumbo-jumbo, and also runs the event handler in a separate thread. You will only need to implement eventHandle, which is the call-back that will be called for every event in the trace.
For an example, you can look at StatsStateProvider in the TMF tree, or at the small example below.
TmfStateSystemFactory
Once you have defined your state provider, you need to tell your trace type to build a state system with this provider during its initialization. This consists of overriding TmfTrace#buildStateSystems() and in there of calling the method in TmfStateSystemFactory that corresponds to the storage backend you want to use (see the section #Comparison of state system backends).
You will have to pass in parameter the state provider you want to use, which you should have defined already. Each backend can also ask for more configuration information.
You must then call registerStateSystem(id, statesystem) to make your state system visible to the trace objects and the views. The ID can be any string of your choosing. To access this particular state system, the views or modules will need to use this ID.
Also, don't forget to call super.buildStateSystems() in your implementation, unless you know for sure you want to skip the state providers built by the super-classes.
You can look at how LttngKernelTrace does it for an example. It could also be possible to build a state system only under certain conditions (like only if the trace contains certain event types).
ITmfStateSystem
ITmfStateSystem is the main interface through which views or analysis modules will access the state system. It offers a read-only view of the state system, which means that no states can be inserted, and no attributes can be created. Calling TmfTrace#getStateSystems().get(id) will return you a ITmfStateSystem view of the requested state system. The main methods of interest are:
getQuarkAbsolute()/getQuarkRelative()
Those are the basic quark-getting methods. The goal of the state system is to return the state values of given attributes at given timestamps. As we've seen earlier, attributes can be described with a file-system-like path. The goal of these methods is to convert from the path representation of the attribute to its quark.
Since quarks are created on-the-fly, there is no guarantee that the same attributes will have the same quark for two traces of the same type. The views should always query their quarks when dealing with a new trace or a new state provider. Beyond that however, quarks should be cached and reused as much as possible, to avoid potentially costly string re-hashing.
getQuarkAbsolute() takes a variable amount of Strings in parameter, which represent the full path to the attribute. Some of them can be constants, some can come programatically, often from the event's fields.
getQuarkRelative() is to be used when you already know the quark of a certain attribute, and want to access on of its sub-attributes. Its first parameter is the origin quark, followed by a String varagrs which represent the relative path to the final attribute.
These two methods will throw an AttributeNotFoundException if trying to access an attribute that does not exist in the model.
These methods also imply that the view has the knowledge of how the attribute tree is organized. This should be a reasonable hypothesis, since the same analysis plugin will normally ship both the state provider and the view, and they will have been written by the same person. In other cases, it's possible to use getSubAttributes() to explore the organization of the attribute tree first.
waitUntilBuilt()
This is a simple method used to block the caller until the construction phase of this state system is done. If the view prefers to wait until all information is available before starting to do queries (to get all known attributes right away, for example), this is the guy to call.
queryFullState()
This is the method to do full queries. As mentioned earlier, you only need to pass a target timestamp in parameter. It will return a List of state intervals, in which the offset corresponds to the attribute quark. This will represent the complete state of the model at the requested time.
querySingleState()
The method to do single queries. You pass in parameter both a timestamp and an attribute quark. This will return the single state matching this timestamp/attribute pair.
Other methods are available, you are encouraged to read their Javadoc and see if they can be potentially useful.
ITmfStateSystemBuilder
ITmfStateSystemBuilder is the read-write interface to the state system. It extends ITmfStateSystem itself, so all its methods are available. It then adds methods that can be used to write to the state system, either by creating new attributes of inserting state changes.
It is normally reserved for the state provider and should not be visible to external components. However it will be available in AbstractTmfStateProvider, in the field 'ss'. That way you can call ss.modifyAttribute() etc. in your state provider to write to the state.
The main methods of interest are:
getQuark*AndAdd()
getQuarkAbsoluteAndAdd() and getQuarkRelativeAndAdd() work exactly like their non-AndAdd counterparts in ITmfStateSystem. The difference is that the -AndAdd versions will not throw any exception: if the requested attribute path does not exist in the system, it will be created, and its newly-assigned quark will be returned.
When in a state provider, the -AndAdd version should normally be used (unless you know for sure the attribute already exist and don't want to create it otherwise). This means that there is no need to define the whole attribute tree in advance, the attributes will be created on-demand.
modifyAttribute()
This is the main state-change-insertion method. As was explained before, a state change is defined by a timestamp, an attribute and a state value. Those three elements need to be passed to modifyAttribute as parameters.
Other state change insertion methods are available (increment-, push-, pop- and removeAttribute()), but those are simply convenience wrappers around modifyAttribute(). Check their Javadoc for more information.
closeHistory()
When the construction phase is done, do not forget to call closeHistory() to tell the backend that no more intervals will be received. Depending on the backend type, it might have to save files, close descriptors, etc. This ensures that a persitent file can then be re-used when the trace is opened again.
If you use the AbstractTmfStateProvider, it will call closeHistory() automatically when it reaches the end of the trace.
Other relevant interfaces
o.e.l.tmf.core.statevalue.ITmfStateValue
This is the interface used to represent state values. Those are used when inserting state changes in the provider, and is also part of the state intervals obtained when doing queries.
The abstract TmfStateValue class contains the factory methods to create new state values of either int, long, double or string types. To retrieve the real object inside the state value, one can use the .unbox* methods.
Note: Do not instantiate null values manually, use TmfStateValue.nullValue()
o.e.l.tmf.core.interval.ITmfStateInterval
This is the interface to represent the state intervals, which are stored in the state history backend, and are returned when doing state system queries. A very simple implementation is available in TmfStateInterval. Its methods should be self-descriptive.
Exceptions
The following exceptions, found in o.e.l.tmf.core.exceptions, are related to state system activities.
AttributeNotFoundException
This is thrown by getQuarkRelative() and getQuarkAbsolute() (but not byt the -AndAdd versions!) when passing an attribute path that is not present in the state system. This is to ensure that no new attribute is created when using these versions of the methods.
Views can expect some attributes to be present, but they should handle these exceptions for when the attributes end up not being in the state system (perhaps this particular trace didn't have a certain type of events, etc.)
StateValueTypeException
This exception will be thrown when trying to unbox a state value into a type different than its own. You should always check with ITmfStateValue#getType() beforehand if you are not sure about the type of a given state value.
TimeRangeException
This exception is thrown when trying to do a query on the state system for a timestamp that is outside of its range. To be safe, you should check with ITmfStateSystem#getStartTime() and #getCurrentEndTime() for the current valid range of the state system. This is especially important when doing queries on a state system that is currently being built.
StateSystemDisposedException
This exception is thrown when trying to access a state system that has been disposed, with its dispose() method. This can potentially happen at shutdown, since Eclipse is not always consistent with the order in which the components are closed.
Comparison of state system backends
As we have seen in section #High-level components, the state system needs a storage backend to save the intervals. Different implementations are available when building your state system from TmfStateSystemFactory.
Do not confuse full/single queries with full/partial history! All backend types should be able to handle any type of queries defined in the ITmfStateSystem API, unless noted otherwise.
Full history
Available with TmfStateSystemFactory#newFullHistory(). The full history uses a History Tree data structure, which is an optimized structure store state intervals on disk. Once built, it can respond to queries in a log(n) manner.
You need to specify a file at creation time, which will be the container for the history tree. Once it's completely built, it will remain on disk (until you delete the trace from the project). This way it can be reused from one session to another, which makes subsequent loading time much faster.
This the backend used by the LTTng kernel plugin. It offers good scalability and performance, even at extreme sizes (it's been tested with traces of sizes up to 500 GB). Its main downside is the amount of disk space required: since every single interval is written to disk, the size of the history file can quite easily reach and even surpass the size of the trace itself.
Null history
Available with TmfStateSystemFactory#newNullHistory(). As its name implies the null history is in fact an absence of state history. All its query methods will return null (see the Javadoc in NullBackend).
Obviously, no file is required, and almost no memory space is used.
It's meant to be used in cases where you are not interested in past states, but only in the "ongoing" one. It can also be useful for debugging and benchmarking.
In-memory history
Available with TmfStateSystemFactory#newInMemHistory(). This is a simple wrapper using a TreeSet to store all state intervals in memory. The implementation at the moment is quite simple, it will perform a binary search on entries when doing queries to find the ones that match.
The advantage of this method is that it's very quick to build and query, since all the information resides in memory. However, you are limited to 2^31 entries (roughly 2 billions), and depending on your state provider and trace type, that can happen really fast!
There are no safeguards, so if you bust the limit you will end up with ArrayOutOfBoundsException's everywhere. If your trace or state history can be arbitrarily big, it's probably safer to use a Full History instead.
Partial history
Available with TmfStateSystemFactory#newPartialHistory(). The partial history is a more advanced form of the full history. Instead of writing all state intervals to disk like with the full history, we only write a small fraction of them, and go back to read the trace to recreate the states in-between.
It has a big advantage over a full history in terms of disk space usage. It's very possible to reduce the history tree file size by a factor of 1000, while keeping query times within a factor of two. Its main downside comes from the fact that you cannot do efficient single queries with it (they are implemented by doing full queries underneath).
This makes it a poor choice for views like the Control Flow view, where you do a lot of range queries and single queries. However, it is a perfect fit for cases like statistics, where you usually do full queries already, and you store lots of small states which are very easy to "compress".
However, it can't really be used until bug 409630 is fixed.
State System Operations
TmfStateSystemOperations is a static class that implements additional statistical operations that can be performed on attributes of the state system.
These operations require that the attribute be one of the numerical values (int, long or double).
The speed of these operations can be greatly improved for large data sets if the attribute was inserted in the state system as a mipmap attribute. Refer to the Mipmap feature section.
queryRangeMax()
This method returns the maximum numerical value of an attribute in the specified time range. The attribute must be of type int, long or double. Null values are ignored. The returned value will be of the same state value type as the base attribute, or a null value if there is no state interval stored in the given time range.
queryRangeMin()
This method returns the minimum numerical value of an attribute in the specified time range. The attribute must be of type int, long or double. Null values are ignored. The returned value will be of the same state value type as the base attribute, or a null value if there is no state interval stored in the given time range.
queryRangeAverage()
This method returns the average numerical value of an attribute in the specified time range. The attribute must be of type int, long or double. Each state interval value is weighted according to time. Null values are counted as zero. The returned value will be a double primitive, which will be zero if there is no state interval stored in the given time range.
Code example
Here is a small example of code that will use the state system. For this example, let's assume we want to track the state of all the CPUs in a LTTng kernel trace. To do so, we will watch for the "sched_switch" event in the state provider, and will update an attribute indicating if the associated CPU should be set to "running" or "idle".
We will use an attribute tree that looks like this:
CPUs
 |--0
 |  |--Status
 |
 |--1
 |  |--Status
 |
 |  2
 |  |--Status
...
The second-level attributes will be named from the information available in the trace events. Only the "Status" attributes will carry a state value (this means we could have just used "1", "2", "3",... directly, but we'll do it in a tree for the example's sake).
Also, we will use integer state values to represent "running" or "idle", instead of saving the strings that would get repeated every time. This will help in reducing the size of the history file.
First we will define a state provider in MyStateProvider. Then, assuming we have already implemented a custom trace type extending CtfTmfTrace, we will add a section to it to make it build a state system using the provider we defined earlier. Finally, we will show some example code that can query the state system, which would normally go in a view or analysis module.
State Provider
import org.eclipse.linuxtools.tmf.core.ctfadaptor.CtfTmfEvent;
import org.eclipse.linuxtools.tmf.core.event.ITmfEvent;
import org.eclipse.linuxtools.tmf.core.exceptions.AttributeNotFoundException;
import org.eclipse.linuxtools.tmf.core.exceptions.StateValueTypeException;
import org.eclipse.linuxtools.tmf.core.exceptions.TimeRangeException;
import org.eclipse.linuxtools.tmf.core.statesystem.AbstractTmfStateProvider;
import org.eclipse.linuxtools.tmf.core.statevalue.ITmfStateValue;
import org.eclipse.linuxtools.tmf.core.statevalue.TmfStateValue;
import org.eclipse.linuxtools.tmf.core.trace.ITmfTrace;

/**
 * Example state system provider.
 *
 * @author Alexandre Montplaisir
 */
public class MyStateProvider extends AbstractTmfStateProvider {

    /** State value representing the idle state */
    public static ITmfStateValue IDLE = TmfStateValue.newValueInt(0);

    /** State value representing the running state */
    public static ITmfStateValue RUNNING = TmfStateValue.newValueInt(1);

    /**
     * Constructor
     *
     * @param trace
     *            The trace to which this state provider is associated
     */
    public MyStateProvider(ITmfTrace trace) {
        super(trace, CtfTmfEvent.class, "Example"); //$NON-NLS-1$
        /*
         * The third parameter here is not important, it's only used to name a
         * thread internally.
         */
    }

    @Override
    public int getVersion() {
        /*
         * If the version of an existing file doesn't match the version supplied
         * in the provider, a rebuild of the history will be forced.
         */
        return 1;
    }

    @Override
    public MyStateProvider getNewInstance() {
        return new MyStateProvider(getTrace());
    }

    @Override
    protected void eventHandle(ITmfEvent ev) {
        /*
         * AbstractStateChangeInput should have already checked for the correct
         * class type.
         */
        CtfTmfEvent event = (CtfTmfEvent) ev;

        final long ts = event.getTimestamp().getValue();
        Integer nextTid = ((Long) event.getContent().getField("next_tid").getValue()).intValue();

        try {

            if (event.getEventName().equals("sched_switch")) {
                int quark = ss.getQuarkAbsoluteAndAdd("CPUs", String.valueOf(event.getCPU()), "Status");
                ITmfStateValue value;
                if (nextTid > 0) {
                    value = RUNNING;
                } else {
                    value = IDLE;
                }
                ss.modifyAttribute(ts, value, quark);
            }

        } catch (TimeRangeException e) {
            /*
             * This should not happen, since the timestamp comes from a trace
             * event.
             */
            throw new IllegalStateException(e);
        } catch (AttributeNotFoundException e) {
            /*
             * This should not happen either, since we're only accessing a quark
             * we just created.
             */
            throw new IllegalStateException(e);
        } catch (StateValueTypeException e) {
            /*
             * This wouldn't happen here, but could potentially happen if we try
             * to insert mismatching state value types in the same attribute.
             */
            e.printStackTrace();
        }

    }

}
Trace type definition
import java.io.File;

import org.eclipse.core.resources.IProject;
import org.eclipse.core.runtime.IStatus;
import org.eclipse.core.runtime.Status;
import org.eclipse.linuxtools.tmf.core.ctfadaptor.CtfTmfTrace;
import org.eclipse.linuxtools.tmf.core.exceptions.TmfTraceException;
import org.eclipse.linuxtools.tmf.core.statesystem.ITmfStateProvider;
import org.eclipse.linuxtools.tmf.core.statesystem.ITmfStateSystem;
import org.eclipse.linuxtools.tmf.core.statesystem.TmfStateSystemFactory;
import org.eclipse.linuxtools.tmf.core.trace.TmfTraceManager;

/**
 * Example of a custom trace type using a custom state provider.
 *
 * @author Alexandre Montplaisir
 */
public class MyTraceType extends CtfTmfTrace {

    /** The file name of the history file  */
    public final static String HISTORY_FILE_NAME = "mystatefile.ht";

    /** ID of the state system we will build */
    public static final String STATE_ID = "org.eclipse.linuxtools.lttng2.example";

    /**
     * Default constructor
     */
    public MyTraceType() {
        super();
    }

    @Override
    public IStatus validate(final IProject project, final String path)  {
        /*
         * Add additional validation code here, and return a IStatus.ERROR if
         * validation fails.
         */
        return Status.OK_STATUS;
    }

    @Override
    protected void buildStateSystem() throws TmfTraceException {
        super.buildStateSystem();

        /* Build the custom state system for this trace */
        String directory = TmfTraceManager.getSupplementaryFileDir(this);
        final File htFile = new File(directory + HISTORY_FILE_NAME);
        final ITmfStateProvider htInput = new MyStateProvider(this);

        ITmfStateSystem ss = TmfStateSystemFactory.newFullHistory(htFile, htInput, false);
        fStateSystems.put(STATE_ID, ss);
    }

}
Query code
import java.util.List;

import org.eclipse.linuxtools.tmf.core.exceptions.AttributeNotFoundException;
import org.eclipse.linuxtools.tmf.core.exceptions.StateSystemDisposedException;
import org.eclipse.linuxtools.tmf.core.exceptions.TimeRangeException;
import org.eclipse.linuxtools.tmf.core.interval.ITmfStateInterval;
import org.eclipse.linuxtools.tmf.core.statesystem.ITmfStateSystem;
import org.eclipse.linuxtools.tmf.core.statevalue.ITmfStateValue;
import org.eclipse.linuxtools.tmf.core.trace.ITmfTrace;

/**
 * Class showing examples of state system queries.
 *
 * @author Alexandre Montplaisir
 */
public class QueryExample {

    private final ITmfStateSystem ss;

    /**
     * Constructor
     *
     * @param trace
     *            Trace that this "view" will display.
     */
    public QueryExample(ITmfTrace trace) {
        ss = trace.getStateSystems().get(MyTraceType.STATE_ID);
    }

    /**
     * Example method of querying one attribute in the state system.
     *
     * We pass it a cpu and a timestamp, and it returns us if that cpu was
     * executing a process (true/false) at that time.
     *
     * @param cpu
     *            The CPU to check
     * @param timestamp
     *            The timestamp of the query
     * @return True if the CPU was running, false otherwise
     */
    public boolean cpuIsRunning(int cpu, long timestamp) {
        try {
            int quark = ss.getQuarkAbsolute("CPUs", String.valueOf(cpu), "Status");
            ITmfStateValue value = ss.querySingleState(timestamp, quark).getStateValue();

            if (value.equals(MyStateProvider.RUNNING)) {
                return true;
            }

        /*
         * Since at this level we have no guarantee on the contents of the state
         * system, it's important to handle these cases correctly.
         */
        } catch (AttributeNotFoundException e) {
            /*
             * Handle the case where the attribute does not exist in the state
             * system (no CPU with this number, etc.)
             */
             ...
        } catch (TimeRangeException e) {
            /*
             * Handle the case where 'timestamp' is outside of the range of the
             * history.
             */
             ...
        } catch (StateSystemDisposedException e) {
            /*
             * Handle the case where the state system is being disposed. If this
             * happens, it's normally when shutting down, so the view can just
             * return immediately and wait it out.
             */
        }
        return false;
    }


    /**
     * Example method of using a full query.
     *
     * We pass it a timestamp, and it returns us how many CPUs were executing a
     * process at that moment.
     *
     * @param timestamp
     *            The target timestamp
     * @return The amount of CPUs that were running at that time
     */
    public int getNbRunningCpus(long timestamp) {
        int count = 0;

        try {
            /* Get the list of the quarks we are interested in. */
            List<Integer> quarks = ss.getQuarks("CPUs", "*", "Status");

            /*
             * Get the full state at our target timestamp (it's better than
             * doing an arbitrary number of single queries).
             */
            List<ITmfStateInterval> state = ss.queryFullState(timestamp);

            /* Look at the value of the state for each quark */
            for (Integer quark : quarks) {
                ITmfStateValue value = state.get(quark).getStateValue();
                if (value.equals(MyStateProvider.RUNNING)) {
                    count++;
                }
            }

        } catch (TimeRangeException e) {
            /*
             * Handle the case where 'timestamp' is outside of the range of the
             * history.
             */
             ...
        } catch (StateSystemDisposedException e) {
            /* Handle the case where the state system is being disposed. */
            ...
        }
        return count;
    }
}
Mipmap feature
The mipmap feature allows attributes to be inserted into the state system with additional computations performed to automatically store sub-attributes that can later be used for statistical operations. The mipmap has a resolution which represents the number of state attribute changes that are used to compute the value at the next mipmap level.
The supported mipmap features are: max, min, and average. Each one of these features requires that the base attribute be a numerical state value (int, long or double). An attribute can be mipmapped for one or more of the features at the same time.
To use a mipmapped attribute in queries, call the corresponding methods of the static class TmfStateSystemOperations.
AbstractTmfMipmapStateProvider
AbstractTmfMipmapStateProvider is an abstract provider class that allows adding features to a specific attribute into a mipmap tree. It extends AbstractTmfStateProvider.
If a provider wants to add mipmapped attributes to its tree, it must extend AbstractTmfMipmapStateProvider and call modifyMipmapAttribute() in the event handler, specifying one or more mipmap features to compute. Then the structure of the attribute tree will be :
|- <attribute>
|   |- <mipmapFeature> (min/max/avg)
|   |   |- 1
|   |   |- 2
|   |   |- 3
|   |  ...
|   |   |- n (maximum mipmap level)
|   |- <mipmapFeature> (min/max/avg)
|   |   |- 1
|   |   |- 2
|   |   |- 3
|   |  ...
|   |   |- n (maximum mipmap level)
|  ...
UML2 Sequence Diagram Framework
The purpose of the UML2 Sequence Diagram Framework of TMF is to provide a framework for generation of UML2 sequence diagrams. It provides
- UML2 Sequence diagram drawing capabilities (i.e. lifelines, messages, activations, object creation and deletion)
- a generic, re-usable Sequence Diagram View
- Eclipse Extension Point for the creation of sequence diagrams
- callback hooks for searching and filtering within the Sequence Diagram View
- scalability
The following chapters describe the Sequence Diagram Framework as well as a reference implementation and its usage.
TMF UML2 Sequence Diagram Extensions
In the UML2 Sequence Diagram Framework an Eclipse extension point is defined so that other plug-ins can contribute code to create sequence diagram.
Identifier: org.eclipse.linuxtools.tmf.ui.uml2SDLoader
Since: 1.0
Description: This extension point aims to list and connect any UML2 Sequence Diagram loader.
Configuration Markup:
<!ELEMENT extension (uml2SDLoader)+>
<!ATTLIST extension
point CDATA #REQUIRED
id    CDATA #IMPLIED
name  CDATA #IMPLIED
>
- point - A fully qualified identifier of the target extension point.
- id - An optional identifier of the extension instance.
- name - An optional name of the extension instance.
<!ELEMENT uml2SDLoader EMPTY>
<!ATTLIST uml2SDLoader
id      CDATA #REQUIRED
name    CDATA #REQUIRED
class   CDATA #REQUIRED
view    CDATA #REQUIRED
default (true | false)
- id - A unique identifier for this uml2SDLoader. This is not mandatory as long as the id attribute cannot be retrieved by the provider plug-in. The class attribute is the one on which the underlying algorithm relies.
- name - An name of the extension instance.
- class - The implementation of this UML2 SD viewer loader. The class must implement org.eclipse.linuxtools.tmf.ui.views.uml2sd.load.IUml2SDLoader.
- view - The view ID of the view that this loader aims to populate. Either org.eclipse.linuxtools.tmf.ui.views.uml2sd.SDView itself or a extension of org.eclipse.linuxtools.tmf.ui.views.uml2sd.SDView.
- default - Set to true to make this loader the default one for the view; in case of several default loaders, first one coming from extensions list is taken.
Management of the Extension Point
The TMF UI plug-in is responsible for evaluating each contribution to the extension point.
With this extension point, a loader class is associated with a Sequence Diagram View. Multiple loaders can be associated to a single Sequence Diagram View. However, additional means have to be implemented to specify which loader should be used when opening the view. For example, an eclipse action or command could be used for that. This additional code is not necessary if there is only one loader for a given Sequence Diagram View associated and this loader has the attribute "default" set to "true". (see also Using one Sequence Diagram View with Multiple Loaders)
Sequence Diagram View
For this extension point a Sequence Diagram View has to be defined as well. The Sequence Diagram View class implementation is provided by the plug-in org.eclipse.linuxtools.tmf.ui (org.eclipse.linuxtools.tmf.ui.views.uml2sd.SDView) and can be used as is or can also be sub-classed. For that, a view extension has to be added to the plugin.xml.
Supported Widgets
The loader class provides a frame containing all the UML2 widgets to be displayed. The following widgets exist:
- Lifeline
- Activation
- Synchronous Message
- Asynchronous Message
- Synchronous Message Return
- Asynchronous Message Return
- Stop
For a lifeline, a category can be defined. The lifeline category defines icons, which are displayed in the lifeline header.
Zooming
The Sequence Diagram View allows the user to zoom in, zoom out and reset the zoom factor.
Printing
It is possible to print the whole sequence diagram as well as part of it.
Key Bindings
- SHIFT+ALT+ARROW-DOWN - to scroll down within sequence diagram one view page at a time
- SHIFT+ALT+ARROW-UP - to scroll up within sequence diagram one view page at a time
- SHIFT+ALT+ARROW-RIGHT - to scroll right within sequence diagram one view page at a time
- SHIFT+ALT+ARROW-LEFT - to scroll left within sequence diagram one view page at a time
- SHIFT+ALT+ARROW-HOME - to jump to the beginning of the selected message if not already visible in page
- SHIFT+ALT+ARROW-END - to jump to the end of the selected message if not already visible in page
- CTRL+F - to open find dialog if either the basic or extended find provider is defined (see Using the Find Provider Interface)
- CTRL+P - to open print dialog
Preferences
The UML2 Sequence Diagram Framework provides preferences to customize the appearance of the Sequence Diagram View. The color of all widgets and text as well as the fonts of the text of all widget can be adjust. Amongst others the default lifeline width can be alternated. To change preferences select Windows->Preferences->Tracing->UML2 Sequence Diagrams. The following preference page will show:
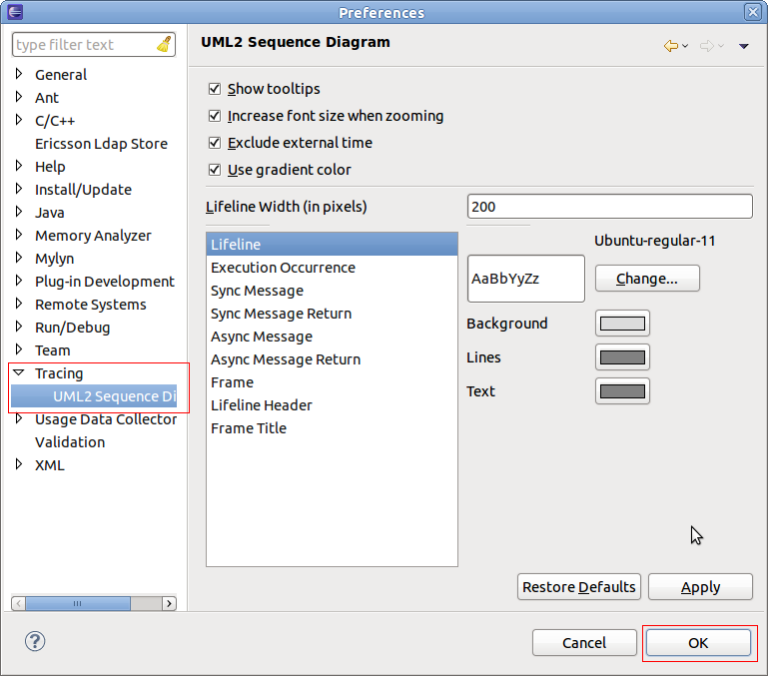
After changing the preferences select OK.
Callback hooks
The Sequence Diagram View provides several callback hooks so that extension can provide application specific functionality. The following interfaces can be provided:
- Basic find provider or extended find Provider
For finding within the sequence diagram - Basic filter provider and extended Filter Provider
For filtering within the sequnce diagram. - Basic paging provider or advanced paging provider
For scalability reasons, used to limit number of displayed messages - Properies provider
To provide properties of selected elements - Collapse provider
To collapse areas of the sequence diagram
Tutorial
This tutorial describes how to create a UML2 Sequence Diagram Loader extension and use this loader in the in Eclipse.
Prerequisites
The tutorial is based on Eclipse 4.4 (Eclipse Luna) and TMF 3.0.0.
Creating an Eclipse UI Plug-in
To create a new project with name org.eclipse.linuxtools.tmf.sample.ui select File -> New -> Project -> Plug-in Development -> Plug-in Project.

Creating a Sequence Diagram View
To open the plug-in manifest, double-click on the MANIFEST.MF file.

Change to the Dependencies tab and select Add... of the Required Plug-ins section. A new dialog box will open. Next find plug-ins org.eclipse.linuxtools.tmf.ui and org.eclipse.linuxtools.tmf.core and then press OK

Change to the Extensions tab and select Add... of the All Extension section. A new dialog box will open. Find the view extension org.eclipse.ui.views and press Finish.

To create a Sequence Diagram View, click the right mouse button. Then select New -> view

A new view entry has been created. Fill in the fields id, name and class. Note that for class the SD view implementation (org.eclipse.linuxtools.tmf.ui.views.SDView) of the TMF UI plug-in is used.
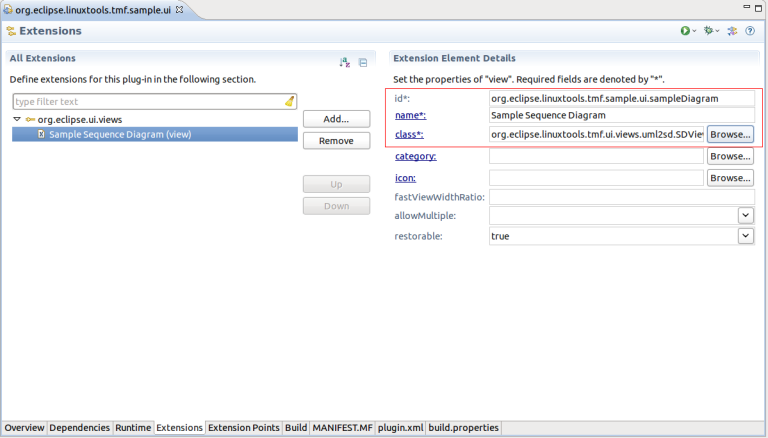
The view is prepared. Run the Example. To launch the an Eclipse Application select the Overview tab and click on Launch an Eclipse Application

A new Eclipse application window will show. In the new window go to Windows -> Show View -> Other... -> Other -> Sample Sequence Diagram.

The Sequence Diagram View will open with an blank page.
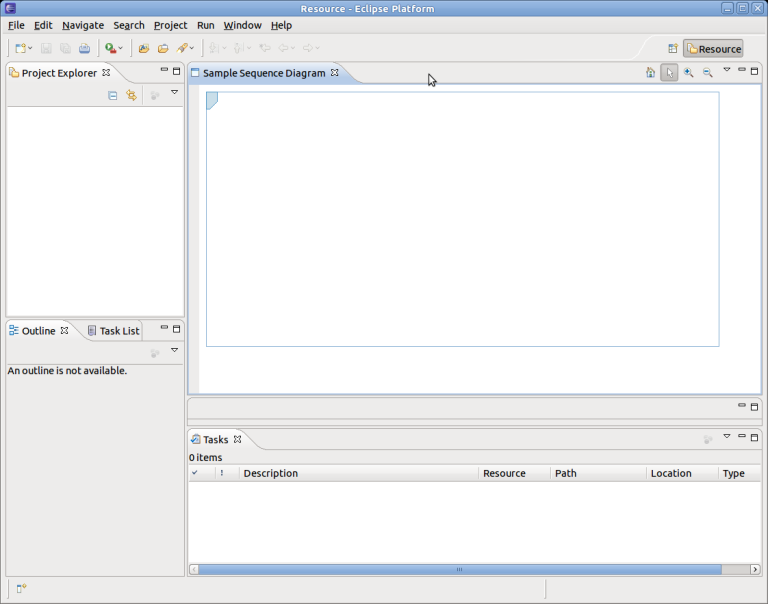
Close the Example Application.
Defining the uml2SDLoader Extension
After defining the Sequence Diagram View it's time to create the uml2SDLoader Extension.
Before doing that add a dependency to TMF. For that select Add... of the Required Plug-ins section. A new dialog box will open. Next find plug-in org.eclipse.linuxtools.tmf and press OK
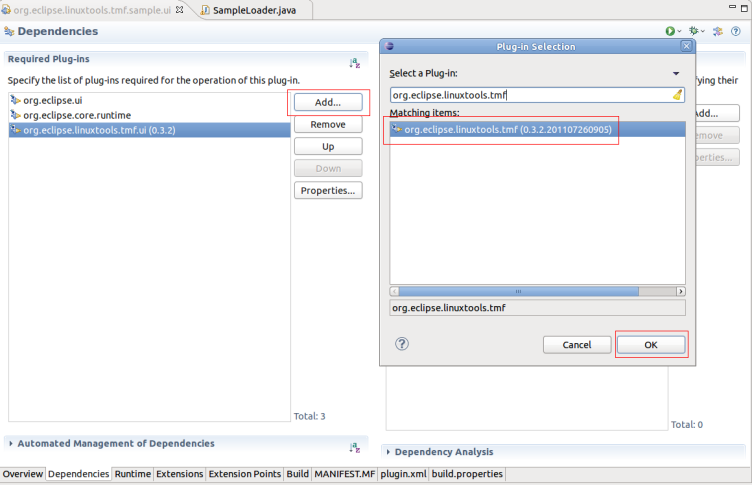
To create the loader extension, change to the Extensions tab and select Add... of the All Extension section. A new dialog box will open. Find the extension org.eclipse.linuxtools.tmf.ui.uml2SDLoader and press Finish.
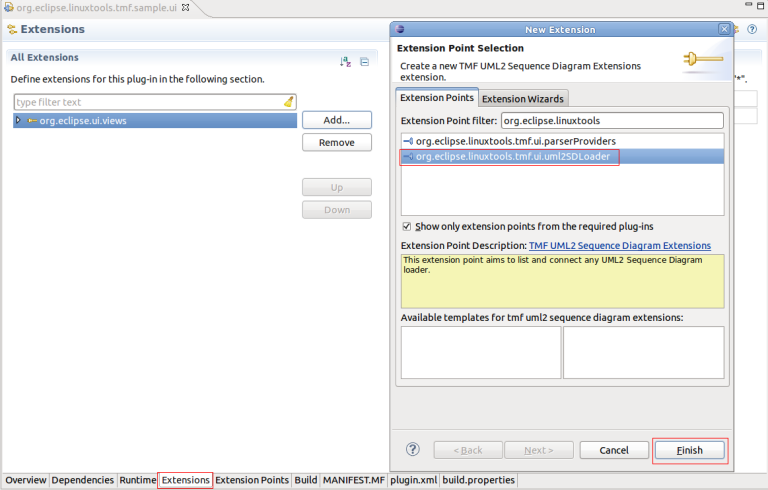
A new 'uml2SDLoader extension has been created. Fill in fields id, name, class, view and default. Use default equal true for this example. For the view add the id of the Sequence Diagram View of chapter Creating a Sequence Diagram View.
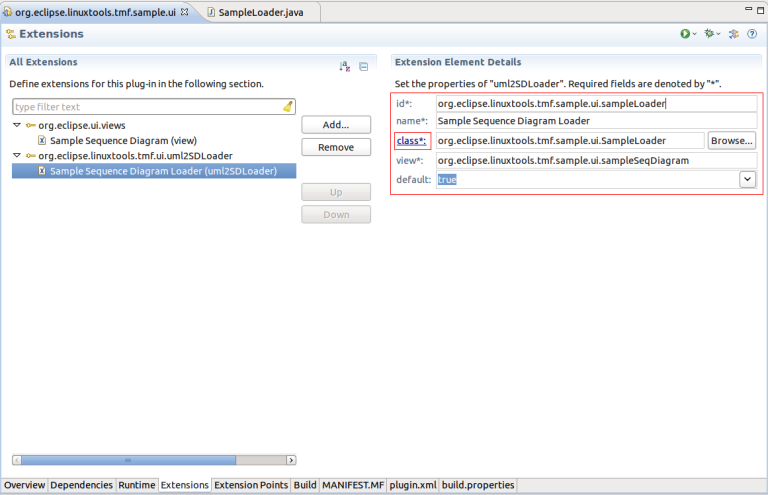
Then click on class (see above) to open the new class dialog box. Fill in the relevant fields and select Finish.
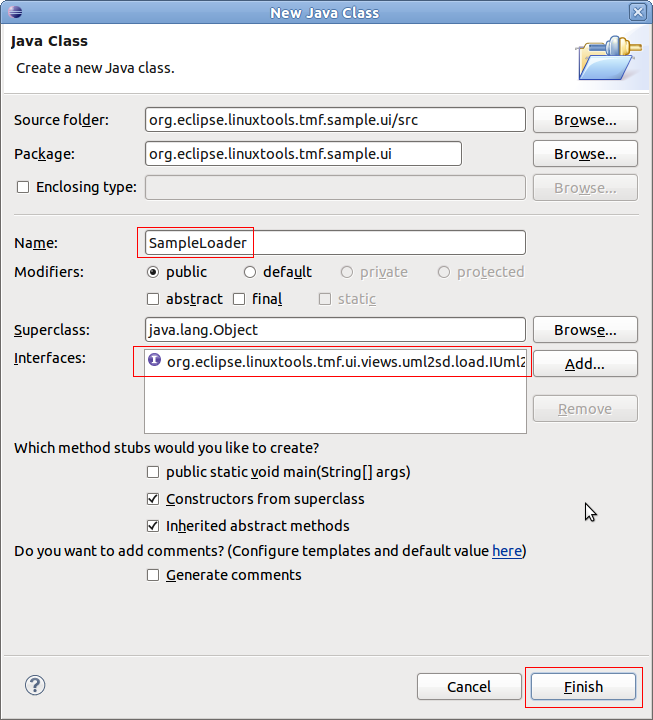
A new Java class will be created which implements the interface org.eclipse.linuxtools.tmf.ui.views.uml2sd.load.IUml2SDLoader.
package org.eclipse.linuxtools.tmf.sample.ui;

import org.eclipse.linuxtools.tmf.ui.views.uml2sd.SDView;
import org.eclipse.linuxtools.tmf.ui.views.uml2sd.load.IUml2SDLoader;

public class SampleLoader implements IUml2SDLoader {

    public SampleLoader() {
        // TODO Auto-generated constructor stub
    }

    @Override
    public void dispose() {
        // TODO Auto-generated method stub

    }

    @Override
    public String getTitleString() {
        // TODO Auto-generated method stub
        return null;
    }

    @Override
    public void setViewer(SDView arg0) {
        // TODO Auto-generated method stub

    }
Implementing the Loader Class
Next is to implement the methods of the IUml2SDLoader interface method. The following code snippet shows how to create the major sequence diagram elements. Please note that no time information is stored.
package org.eclipse.linuxtools.tmf.sample.ui;

import org.eclipse.linuxtools.tmf.ui.views.uml2sd.SDView;
import org.eclipse.linuxtools.tmf.ui.views.uml2sd.core.AsyncMessage;
import org.eclipse.linuxtools.tmf.ui.views.uml2sd.core.AsyncMessageReturn;
import org.eclipse.linuxtools.tmf.ui.views.uml2sd.core.ExecutionOccurrence;
import org.eclipse.linuxtools.tmf.ui.views.uml2sd.core.Frame;
import org.eclipse.linuxtools.tmf.ui.views.uml2sd.core.Lifeline;
import org.eclipse.linuxtools.tmf.ui.views.uml2sd.core.Stop;
import org.eclipse.linuxtools.tmf.ui.views.uml2sd.core.SyncMessage;
import org.eclipse.linuxtools.tmf.ui.views.uml2sd.core.SyncMessageReturn;
import org.eclipse.linuxtools.tmf.ui.views.uml2sd.load.IUml2SDLoader;

public class SampleLoader implements IUml2SDLoader {

    private SDView fSdView;

    public SampleLoader() {
    }

    @Override
    public void dispose() {
    }

    @Override
    public String getTitleString() {
        return "Sample Diagram";
    }

    @Override
    public void setViewer(SDView arg0) {
        fSdView = arg0;
        createFrame();
    }

    private void createFrame() {

        Frame testFrame = new Frame();
        testFrame.setName("Sample Frame");

        /*
         *  Create lifelines
         */

        Lifeline lifeLine1 = new Lifeline();
        lifeLine1.setName("Object1");
        testFrame.addLifeLine(lifeLine1);

        Lifeline lifeLine2 = new Lifeline();
        lifeLine2.setName("Object2");
        testFrame.addLifeLine(lifeLine2);


        /*
         * Create Sync Message
         */
        // Get new occurrence on lifelines
        lifeLine1.getNewEventOccurrence();

        // Get Sync message instances
        SyncMessage start = new SyncMessage();
        start.setName("Start");
        start.setEndLifeline(lifeLine1);
        testFrame.addMessage(start);

        /*
         * Create Sync Message
         */
        // Get new occurrence on lifelines
        lifeLine1.getNewEventOccurrence();
        lifeLine2.getNewEventOccurrence();

        // Get Sync message instances
        SyncMessage syn1 = new SyncMessage();
        syn1.setName("Sync Message 1");
        syn1.setStartLifeline(lifeLine1);
        syn1.setEndLifeline(lifeLine2);
        testFrame.addMessage(syn1);

        /*
         * Create corresponding Sync Message Return
         */

        // Get new occurrence on lifelines
        lifeLine1.getNewEventOccurrence();
        lifeLine2.getNewEventOccurrence();

        SyncMessageReturn synReturn1 = new SyncMessageReturn();
        synReturn1.setName("Sync Message Return 1");
        synReturn1.setStartLifeline(lifeLine2);
        synReturn1.setEndLifeline(lifeLine1);
        synReturn1.setMessage(syn1);
        testFrame.addMessage(synReturn1);

        /*
         * Create Activations (Execution Occurrence)
         */
        ExecutionOccurrence occ1 = new ExecutionOccurrence();
        occ1.setStartOccurrence(start.getEventOccurrence());
        occ1.setEndOccurrence(synReturn1.getEventOccurrence());
        lifeLine1.addExecution(occ1);
        occ1.setName("Activation 1");

        ExecutionOccurrence occ2 = new ExecutionOccurrence();
        occ2.setStartOccurrence(syn1.getEventOccurrence());
        occ2.setEndOccurrence(synReturn1.getEventOccurrence());
        lifeLine2.addExecution(occ2);
        occ2.setName("Activation 2");

        /*
         * Create Sync Message
         */
        // Get new occurrence on lifelines
        lifeLine1.getNewEventOccurrence();
        lifeLine2.getNewEventOccurrence();

        // Get Sync message instances
        AsyncMessage asyn1 = new AsyncMessage();
        asyn1.setName("Async Message 1");
        asyn1.setStartLifeline(lifeLine1);
        asyn1.setEndLifeline(lifeLine2);
        testFrame.addMessage(asyn1);

        /*
         * Create corresponding Sync Message Return
         */

        // Get new occurrence on lifelines
        lifeLine1.getNewEventOccurrence();
        lifeLine2.getNewEventOccurrence();

        AsyncMessageReturn asynReturn1 = new AsyncMessageReturn();
        asynReturn1.setName("Async Message Return 1");
        asynReturn1.setStartLifeline(lifeLine2);
        asynReturn1.setEndLifeline(lifeLine1);
        asynReturn1.setMessage(asyn1);
        testFrame.addMessage(asynReturn1);

        /*
         * Create a note
         */

        // Get new occurrence on lifelines
        lifeLine1.getNewEventOccurrence();

        EllipsisMessage info = new EllipsisMessage();
        info.setName("Object deletion");
        info.setStartLifeline(lifeLine2);
        testFrame.addNode(info);

        /*
         * Create a Stop
         */
        Stop stop = new Stop();
        stop.setLifeline(lifeLine2);
        stop.setEventOccurrence(lifeLine2.getNewEventOccurrence());
        lifeLine2.addNode(stop);

        fSdView.setFrame(testFrame);
    }
}
Now it's time to run the example application. To launch the Example Application select the Overview tab and click on Launch an Eclipse Application
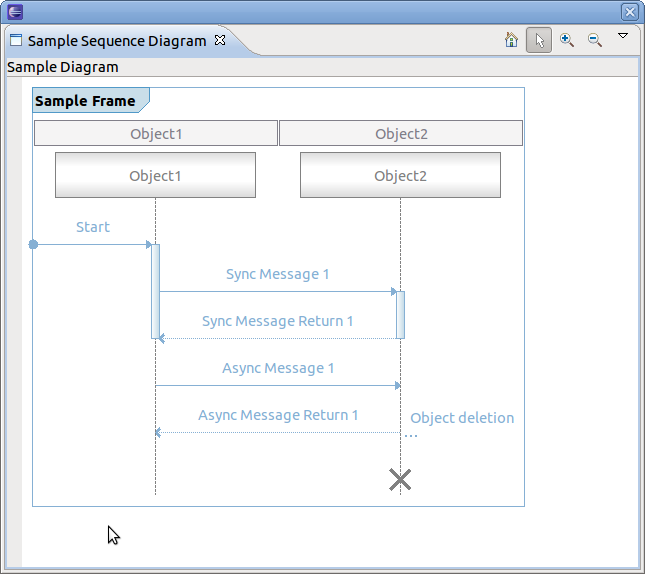
Adding time information
To add time information in sequence diagram the timestamp has to be set for each message. The sequence diagram framework uses the TmfTimestamp class of plug-in org.eclipse.linuxtools.tmf.core. Use setTime() on each message SyncMessage since start and end time are the same. For each AsyncMessage set start and end time separately by using methods setStartTime and setEndTime. For example:
    private void createFrame() {
        //...
        start.setTime(new TmfTimestamp(1000, -3));
        syn1.setTime(new TmfTimestamp(1005, -3));
        synReturn1.setTime(new TmfTimestamp(1050, -3));
        asyn1.setStartTime(new TmfTimestamp(1060, -3));
        asyn1.setEndTime(new TmfTimestamp(1070, -3));
        asynReturn1.setStartTime(new TmfTimestamp(1060, -3));
        asynReturn1.setEndTime(new TmfTimestamp(1070, -3));
        //...
    }
When running the example application, a time compression bar on the left appears which indicates the time elapsed between consecutive events. The time compression scale shows where the time falls between the minimum and maximum delta times. The intensity of the color is used to indicate the length of time, namely, the deeper the intensity, the higher the delta time. The minimum and maximum delta times are configurable through the collbar menu Configure Min Max. The time compression bar and scale may provide an indication about which events consumes the most time. By hovering over the time compression bar a tooltip appears containing more information.
By hovering over a message it will show the time information in the appearing tooltip. For each SyncMessage it shows its time occurrence and for each AsyncMessage it shows the start and end time.
To see the time elapsed between 2 messages, select one message and hover over a second message. A tooltip will show with the delta in time. Note if the second message is before the first then a negative delta is displayed. Note that for AsyncMessage the end time is used for the delta calculation.
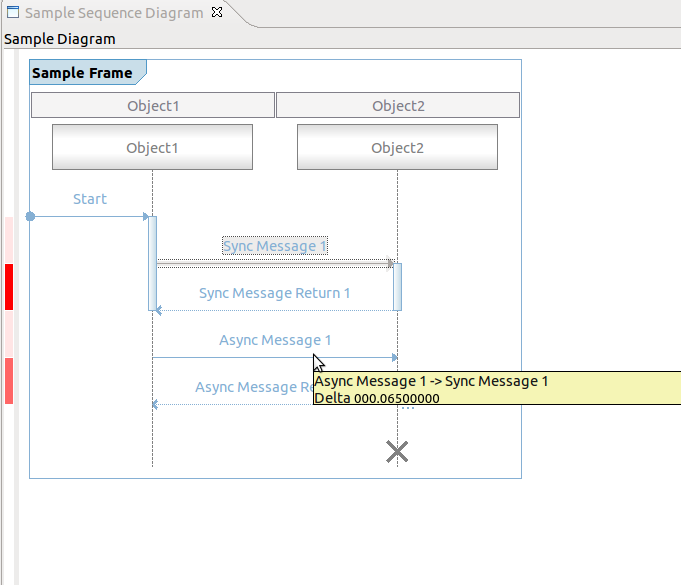
Default Coolbar and Menu Items
The Sequence Diagram View comes with default coolbar and menu items. By default, each sequence diagram shows the following actions:
- Zoom in
- Zoom out
- Reset Zoom Factor
- Selection
- Configure Min Max (drop-down menu only)
- Navigation -> Show the node end (drop-down menu only)
- Navigation -> Show the node start (drop-down menu only)
Implementing Optional Callbacks
The following chapters describe how to use all supported provider interfaces.
Using the Paging Provider Interface
For scalability reasons, the paging provider interfaces exists to limit the number of messages displayed in the Sequence Diagram View at a time. For that, two interfaces exist, the basic paging provider and the advanced paging provider. When using the basic paging interface, actions for traversing page by page through the sequence diagram of a trace will be provided.
To use the basic paging provider, first the interface methods of the ISDPagingProvider have to be implemented by a class. (i.e. hasNextPage(), hasPrevPage(), nextPage(), prevPage(), firstPage() and endPage(). Typically, this is implemented in the loader class. Secondly, the provider has to be set in the Sequence Diagram View. This will be done in the setViewer() method of the loader class. Lastly, the paging provider has to be removed from the view, when the dispose() method of the loader class is called.
public class SampleLoader implements IUml2SDLoader, ISDPagingProvider {
    //...
    private page = 0;

    @Override
    public void dispose() {
        if (fSdView != null) {
            fSdView.resetProviders();
        }
    }

    @Override
    public void setViewer(SDView arg0) {
        fSdView = arg0;
        fSdView.setSDPagingProvider(this);
        createFrame();
    }

    private void createSecondFrame() {
        Frame testFrame = new Frame();
        testFrame.setName("SecondFrame");
        Lifeline lifeline = new Lifeline();
        lifeline.setName("LifeLine 0");
        testFrame.addLifeLine(lifeline);
        lifeline = new Lifeline();
        lifeline.setName("LifeLine 1");
        testFrame.addLifeLine(lifeline);
        for (int i = 1; i < 5; i++) {
            SyncMessage message = new SyncMessage();
            message.autoSetStartLifeline(testFrame.getLifeline(0));
            message.autoSetEndLifeline(testFrame.getLifeline(0));
            message.setName((new StringBuilder("Message ")).append(i).toString());
            testFrame.addMessage(message);

            SyncMessageReturn messageReturn = new SyncMessageReturn();
            messageReturn.autoSetStartLifeline(testFrame.getLifeline(0));
            messageReturn.autoSetEndLifeline(testFrame.getLifeline(0));

            testFrame.addMessage(messageReturn);
            messageReturn.setName((new StringBuilder("Message return ")).append(i).toString());
            ExecutionOccurrence occ = new ExecutionOccurrence();
            occ.setStartOccurrence(testFrame.getSyncMessage(i - 1).getEventOccurrence());
            occ.setEndOccurrence(testFrame.getSyncMessageReturn(i - 1).getEventOccurrence());
            testFrame.getLifeline(0).addExecution(occ);
        }
        fSdView.setFrame(testFrame);
    }

    @Override
    public boolean hasNextPage() {
        return page == 0;
    }

    @Override
    public boolean hasPrevPage() {
        return page == 1;
    }

    @Override
    public void nextPage() {
        page = 1;
        createSecondFrame();
    }

    @Override
    public void prevPage() {
        page = 0;
        createFrame();
    }

    @Override
    public void firstPage() {
        page = 0;
        createFrame();
    }

    @Override
    public void lastPage() {
        page = 1;
        createSecondFrame();
    }
    //...
}
When running the example application, new actions will be shown in the coolbar and the coolbar menu.
To use the advanced paging provider, the interface ISDAdvancePagingProvider has to be implemented. It extends the basic paging provider. The methods currentPage(), pagesCount() and pageNumberChanged() have to be added.
Using the Find Provider Interface
For finding nodes in a sequence diagram two interfaces exists. One for basic finding and one for extended finding. The basic find comes with a dialog box for entering find criteria as regular expressions. This find criteria can be used to execute the find. Find criteria a persisted in the Eclipse workspace.
For the extended find provider interface a org.eclipse.jface.action.Action class has to be provided. The actual find handling has to be implemented and triggered by the action.
Only on at a time can be active. If the extended find provder is defined it obsoletes the basic find provider.
To use the basic find provider, first the interface methods of the ISDFindProvider have to be implemented by a class. Typically, this is implemented in the loader class. Add the ISDFindProvider to the list of implemented interfaces, implement the methods find() and cancel() and set the provider in the setViewer() method as well as remove the provider in the dispose() method of the loader class. Please note that the ISDFindProvider extends the interface ISDGraphNodeSupporter which methods (isNodeSupported() and getNodeName()) have to be implemented, too. The following shows an example implementation. Please note that only search for lifelines and SynchMessage are supported. The find itself will always find only the first occurrence the pattern to match.
public class SampleLoader implements IUml2SDLoader, ISDPagingProvider, ISDFindProvider {

    //...
    @Override
    public void dispose() {
        if (fSdView != null) {
            fSdView.resetProviders();
        }
    }

    @Override
    public void setViewer(SDView arg0) {
        fSdView = arg0;
        fSdView.setSDPagingProvider(this);
        fSdView.setSDFindProvider(this);
        createFrame();
    }

    @Override
    public boolean isNodeSupported(int nodeType) {
        switch (nodeType) {
        case ISDGraphNodeSupporter.LIFELINE:
        case ISDGraphNodeSupporter.SYNCMESSAGE:
            return true;

        default:
            break;
        }
        return false;
    }

    @Override
    public String getNodeName(int nodeType, String loaderClassName) {
        switch (nodeType) {
        case ISDGraphNodeSupporter.LIFELINE:
            return "Lifeline";
        case ISDGraphNodeSupporter.SYNCMESSAGE:
            return "Sync Message";
        }
        return "";
    }

    @Override
    public boolean find(Criteria criteria) {
        Frame frame = fSdView.getFrame();
        if (criteria.isLifeLineSelected()) {
            for (int i = 0; i < frame.lifeLinesCount(); i++) {
                if (criteria.matches(frame.getLifeline(i).getName())) {
                    fSdView.getSDWidget().moveTo(frame.getLifeline(i));
                    return true;
                }
            }
        }
        if (criteria.isSyncMessageSelected()) {
            for (int i = 0; i < frame.syncMessageCount(); i++) {
                if (criteria.matches(frame.getSyncMessage(i).getName())) {
                    fSdView.getSDWidget().moveTo(frame.getSyncMessage(i));
                    return true;
                }
            }
        }
        return false;
    }

    @Override
    public void cancel() {
        // reset find parameters
    }
    //...
}
When running the example application, the find action will be shown in the coolbar and the coolbar menu.
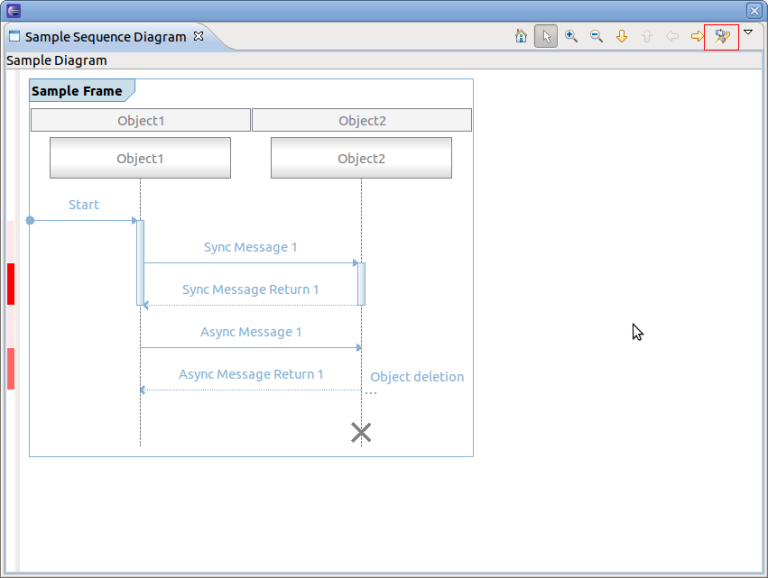
To find a sequence diagram node press on the find button of the coolbar (see above). A new dialog box will open. Enter a regular expression in the Matching String text box, select the node types (e.g. Sync Message) and press Find. If found the corresponding node will be selected. If not found the dialog box will indicate not found.
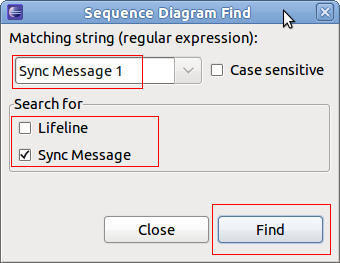
Note that the find dialog will be opened by typing the key shortcut CRTL+F.
Using the Filter Provider Interface
For filtering of sequence diagram elements two interfaces exist. One basic for filtering and one for extended filtering. The basic filtering comes with two dialog for entering filter criteria as regular expressions and one for selecting the filter to be used. Multiple filters can be active at a time. Filter criteria are persisted in the Eclipse workspace.
To use the basic filter provider, first the interface method of the ISDFilterProvider has to be implemented by a class. Typically, this is implemented in the loader class. Add the ISDFilterProvider to the list of implemented interfaces, implement the method filter()and set the provider in the setViewer() method as well as remove the provider in the dispose() method of the loader class. Please note that the ISDFindProvider extends the interface ISDGraphNodeSupporter which methods (isNodeSupported() and getNodeName()) have to be implemented, too.
Note that no example implementation of filter() is provided.
public class SampleLoader implements IUml2SDLoader, ISDPagingProvider, ISDFindProvider, ISDFilterProvider {

    //...
    @Override
    public void dispose() {
        if (fSdView != null) {
            fSdView.resetProviders();
        }
    }

    @Override
    public void setViewer(SDView arg0) {
        fSdView = arg0;
        fSdView.setSDPagingProvider(this);
        fSdView.setSDFindProvider(this);
        fSdView.setSDFilterProvider(this);
        createFrame();
    }

    @Override
    public boolean filter(List<?> list) {
        return false;
    }
    //...
}
When running the example application, the filter action will be shown in the coolbar menu.
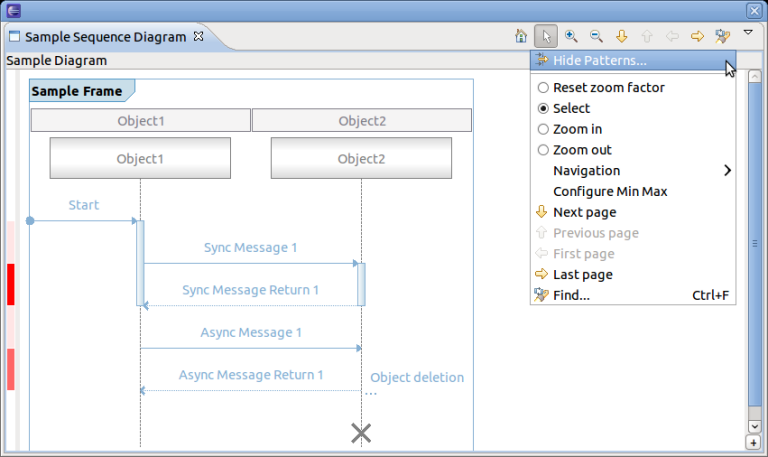
To filter select the Hide Patterns... of the coolbar menu. A new dialog box will open.
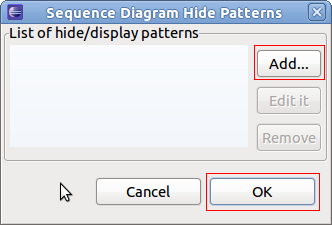
To Add a new filter press Add.... A new dialog box will open. Enter a regular expression in the Matching String text box, select the node types (e.g. Sync Message) and press Create'.

Now back at the Hide Pattern dialog. Select one or more filter and select OK.
To use the extended filter provider, the interface ISDExtendedFilterProvider has to be implemented. It will provide a org.eclipse.jface.action.Action class containing the actual filter handling and filter algorithm.
Using the Extended Action Bar Provider Interface
The extended action bar provider can be used to add customized actions to the Sequence Diagram View.
To use the extended action bar provider, first the interface method of the interface ISDExtendedActionBarProvider has to be implemented by a class. Typically, this is implemented in the loader class. Add the ISDExtendedActionBarProvider to the list of implemented interfaces, implement the method supplementCoolbarContent() and set the provider in the setViewer() method as well as remove the provider in the dispose() method of the loader class.
public class SampleLoader implements IUml2SDLoader, ISDPagingProvider, ISDFindProvider, ISDFilterProvider, ISDExtendedActionBarProvider {
    //...

    @Override
    public void dispose() {
        if (fSdView != null) {
            fSdView.resetProviders();
        }
    }

    @Override
    public void setViewer(SDView arg0) {
        fSdView = arg0;
        fSdView.setSDPagingProvider(this);
        fSdView.setSDFindProvider(this);
        fSdView.setSDFilterProvider(this);
        fSdView.setSDExtendedActionBarProvider(this);
        createFrame();
    }

    @Override
    public void supplementCoolbarContent(IActionBars iactionbars) {
        Action action = new Action("Refresh") {
            @Override
            public void run() {
                System.out.println("Refreshing...");
            }
        };
        iactionbars.getMenuManager().add(action);
        iactionbars.getToolBarManager().add(action);
    }
    //...
}
When running the example application, all new actions will be added to the coolbar and coolbar menu according to the implementation of supplementCoolbarContent()
.
For the example above the coolbar and coolbar menu will look as follows.
Using the Properties Provider Interface
This interface can be used to provide property information. A property provider which returns an IPropertyPageSheet (see org.eclipse.ui.views) has to be implemented and set in the Sequence Diagram View.
To use the property provider, first the interface method of the ISDPropertiesProvider has to be implemented by a class. Typically, this is implemented in the loader class. Add the ISDPropertiesProvider to the list of implemented interfaces, implement the method getPropertySheetEntry() and set the provider in the setViewer() method as well as remove the provider in the dispose() method of the loader class. Please note that no example is provided here.
Please refer to the following Eclipse articles for more information about properties and tabed properties.
Using the Collapse Provider Interface
This interface can be used to define a provider which responsibility is to collapse two selected lifelines. This can be used to hide a pair of lifelines.
To use the collapse provider, first the interface method of the ISDCollapseProvider has to be implemented by a class. Typically, this is implemented in the loader class. Add the ISDCollapseProvider to the list of implemented interfaces, implement the method collapseTwoLifelines() and set the provider in the setViewer() method as well as remove the provider in the dispose() method of the loader class. Please note that no example is provided here.
Using the Selection Provider Service
The Sequence Diagram View comes with a build in selection provider service. To this service listeners can be added. To use the selection provider service, the interface ISelectionListener of plug-in org.eclipse.ui has to implemented. Typically this is implemented in loader class. Firstly, add the ISelectionListener interface to the list of implemented interfaces, implement the method selectionChanged() and set the listener in method setViewer() as well as remove the listener in the dispose() method of the loader class.
public class SampleLoader implements IUml2SDLoader, ISDPagingProvider, ISDFindProvider, ISDFilterProvider, ISDExtendedActionBarProvider, ISelectionListener {

    //...
    @Override
    public void dispose() {
        if (fSdView != null) {
            PlatformUI.getWorkbench().getActiveWorkbenchWindow().getSelectionService().removePostSelectionListener(this);
            fSdView.resetProviders();
        }
    }

    @Override
    public String getTitleString() {
        return "Sample Diagram";
    }

    @Override
    public void setViewer(SDView arg0) {
        fSdView = arg0;
        PlatformUI.getWorkbench().getActiveWorkbenchWindow().getSelectionService().addPostSelectionListener(this);
        fSdView.setSDPagingProvider(this);
        fSdView.setSDFindProvider(this);
        fSdView.setSDFilterProvider(this);
        fSdView.setSDExtendedActionBarProvider(this);

        createFrame();
    }

    @Override
    public void selectionChanged(IWorkbenchPart part, ISelection selection) {
        ISelection sel = PlatformUI.getWorkbench().getActiveWorkbenchWindow().getSelectionService().getSelection();
        if (sel != null && (sel instanceof StructuredSelection)) {
            StructuredSelection stSel = (StructuredSelection) sel;
            if (stSel.getFirstElement() instanceof BaseMessage) {
                BaseMessage syncMsg = ((BaseMessage) stSel.getFirstElement());
                System.out.println("Message '" + syncMsg.getName() + "' selected.");
            }
        }
    }

    //...
}
Printing a Sequence Diagram
To print a the whole sequence diagram or only parts of it, select the Sequence Diagram View and select File -> Print... or type the key combination CTRL+P. A new print dialog will open.
Fill in all the relevant information, select Printer... to choose the printer and the press OK.
Using one Sequence Diagram View with Multiple Loaders
A Sequence Diagram View definition can be used with multiple sequence diagram loaders. However, the active loader to be used when opening the view has to be set. For this define an Eclipse action or command and assign the current loader to the view. Here is a code snippet for that:
public class OpenSDView extends AbstractHandler {
    @Override
    public Object execute(ExecutionEvent event) throws ExecutionException {
        try {
            IWorkbenchPage persp = TmfUiPlugin.getDefault().getWorkbench().getActiveWorkbenchWindow().getActivePage();
            SDView view = (SDView) persp.showView("org.eclipse.linuxtools.ust.examples.ui.componentinteraction");
            LoadersManager.getLoadersManager().createLoader("org.eclipse.linuxtools.tmf.ui.views.uml2sd.impl.TmfUml2SDSyncLoader", view);
        } catch (PartInitException e) {
            throw new ExecutionException("PartInitException caught: ", e);
        }
        return null;
 }
}
Downloading the Tutorial
Use the following link to download the source code of the tutorial Plug-in of Tutorial.
Integration of Tracing and Monitoring Framework with Sequence Diagram Framework
In the previous sections the Sequence Diagram Framework has been described and a tutorial was provided. In the following sections the integration of the Sequence Diagram Framework with other features of TMF will be described. Together it is a powerful framework to analyze and visualize content of traces. The integration is explained using the reference implementation of a UML2 sequence diagram loader which part of the TMF UI delivery. The reference implementation can be used as is, can be sub-classed or simply be an example for other sequence diagram loaders to be implemented.
Reference Implementation
A Sequence Diagram View Extension is defined in the plug-in TMF UI as well as a uml2SDLoader Extension with the reference loader.
Used Sequence Diagram Features
Besides the default features of the Sequence Diagram Framework, the reference implementation uses the following additional features:
- Advanced paging
- Basic finding
- Basic filtering
- Selection Service
Advanced paging
The reference loader implements the interface ISDAdvancedPagingProvider interface. Please refer to section Using the Paging Provider Interface for more details about the advanced paging feature.
Basic finding
The reference loader implements the interface ISDFindProvider interface. The user can search for Lifelines and Interactions. The find is done across pages. If the expression to match is not on the current page a new thread is started to search on other pages. If expression is found the corresponding page is shown as well as the searched item is displayed. If not found then a message is displayed in the Progress View of Eclipse. Please refer to section Using the Find Provider Interface for more details about the basic find feature.
Basic filtering
The reference loader implements the interface ISDFilterProvider interface. The user can filter on Lifelines and Interactions. Please refer to section Using the Filter Provider Interface for more details about the basic filter feature.
Selection Service
The reference loader implements the interface ISelectionListener interface. When an interaction is selected a TmfTimeSynchSignal is broadcast (see TMF Signal Framework). Please also refer to section Using the Selection Provider Service for more details about the selection service and .
Used TMF Features
The reference implementation uses the following features of TMF:
- TMF Experiment and Trace for accessing traces
- Event Request Framework to request TMF events from the experiment and respective traces
- Signal Framework for broadcasting and receiving TMF signals for synchronization purposes
TMF Experiment and Trace for accessing traces
The reference loader uses TMF Experiments to access traces and to request data from the traces.
TMF Event Request Framework
The reference loader use the TMF Event Request Framework to request events from the experiment and its traces.
When opening a traces (which is triggered by signal TmfExperimentSelected) or when opening the Sequence Diagram View after a trace had been opened previously, a TMF background request is initiated to index the trace and to fill in the first page of the sequence diagram. The purpose of the indexing is to store time ranges for pages with 10000 messages per page. This allows quickly to move to certain pages in a trace without having to re-parse from the beginning. The request is called indexing request.
When switching pages, the a TMF foreground event request is initiated to retrieve the corresponding events from the experiment. It uses the time range stored in the index for the respective page.
A third type of event request is issued for finding specific data across pages.
TMF Signal Framework
The reference loader extends the class TmfComponent. By doing that the loader is registered as a TMF signal handler for sending and receiving TMF signals. The loader implements signal handlers for the following TMF signals:
- TmfTraceSelectedSignal
This signal indicates that a trace or experiment was selected. When receiving this signal the indexing request is initiated and the first page is displayed after receiving the relevant information.
- TmfTraceClosedSignal
This signal indicates that a trace or experiment was closed. When receiving this signal the loader resets its data and a blank page is loaded in the Sequence Diagram View.
- TmfTimeSynchSignal
This signal is used to indicate that a new time or time range has been selected. It contains a begin and end time. If a single time is selected then the begin and end time are the same. When receiving this signal the corresponding message matching the begin time is selected in the Sequence Diagram View. If necessary, the page is changed.
- TmfRangeSynchSignal
This signal indicates that a new time range is in focus. When receiving this signal the loader loads the page which corresponds to the start time of the time range signal. The message with the start time will be in focus.
Besides acting on receiving signals, the reference loader is also sending signals. A TmfTimeSynchSignal is broadcasted with the timestamp of the message which was selected in the Sequence Diagram View. TmfRangeSynchSignal is sent when a page is changed in the Sequence Diagram View. The start timestamp of the time range sent is the timestamp of the first message. The end timestamp sent is the timestamp of the first message plus the current time range window. The current time range window is the time window that was indicated in the last received TmfRangeSynchSignal.
Supported Traces
The reference implementation is able to analyze traces from a single component that traces the interaction with other components. For example, a server node could have trace information about its interaction with client nodes. The server node could be traced and then analyzed using TMF and the Sequence Diagram Framework of TMF could used to visualize the interactions with the client nodes.
Note that combined traces of multiple components, that contain the trace information about the same interactions are not supported in the reference implementation!
Trace Format
The reference implementation in class TmfUml2SDSyncLoader in package org.eclipse.linuxtools.tmf.ui.views.uml2sd.impl analyzes events from type ITmfEvent and creates events type ITmfSyncSequenceDiagramEvent if the ITmfEvent contains all relevant information information. The parsing algorithm looks like as follows:
    /**
     * @param tmfEvent Event to parse for sequence diagram event details
     * @return sequence diagram event if details are available else null
     */
    protected ITmfSyncSequenceDiagramEvent getSequenceDiagramEvent(ITmfEvent tmfEvent){
        //type = .*RECEIVE.* or .*SEND.*
        //content = sender:<sender name>:receiver:<receiver name>,signal:<signal name>
        String eventType = tmfEvent.getType().toString();
        if (eventType.contains(Messages.TmfUml2SDSyncLoader_EventTypeSend) || eventType.contains(Messages.TmfUml2SDSyncLoader_EventTypeReceive)) {
            Object sender = tmfEvent.getContent().getField(Messages.TmfUml2SDSyncLoader_FieldSender);
            Object receiver = tmfEvent.getContent().getField(Messages.TmfUml2SDSyncLoader_FieldReceiver);
            Object name = tmfEvent.getContent().getField(Messages.TmfUml2SDSyncLoader_FieldSignal);
            if ((sender instanceof ITmfEventField) && (receiver instanceof ITmfEventField) && (name instanceof ITmfEventField)) {
                ITmfSyncSequenceDiagramEvent sdEvent = new TmfSyncSequenceDiagramEvent(tmfEvent,
                                ((ITmfEventField) sender).getValue().toString(),
                                ((ITmfEventField) receiver).getValue().toString(),
                                ((ITmfEventField) name).getValue().toString());

                return sdEvent;
            }
        }
        return null;
    }
The analysis looks for event type Strings containing SEND and RECEIVE. If event type matches these key words, the analyzer will look for strings sender, receiver and signal in the event fields of type ITmfEventField. If all the data is found a sequence diagram event can be created using this information. Note that Sync Messages are assumed, which means start and end time are the same.
How to use the Reference Implementation
An example CTF (Common Trace Format) trace is provided that contains trace events with sequence diagram information. To download the reference trace, use the following link: Reference Trace.
Run an Eclipse application with TMF 3.0 or later installed. To open the Reference Sequence Diagram View, select Windows -> Show View -> Other... -> TMF -> Sequence Diagram
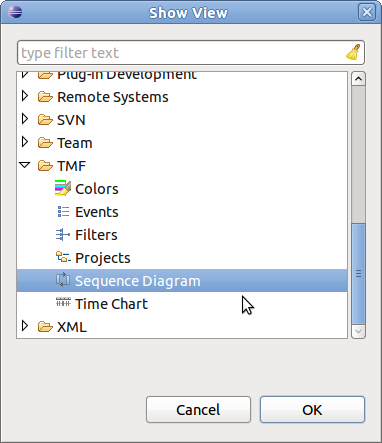
A blank Sequence Diagram View will open.
Then import the reference trace to the Project Explorer using the Import Trace Package... menu option.
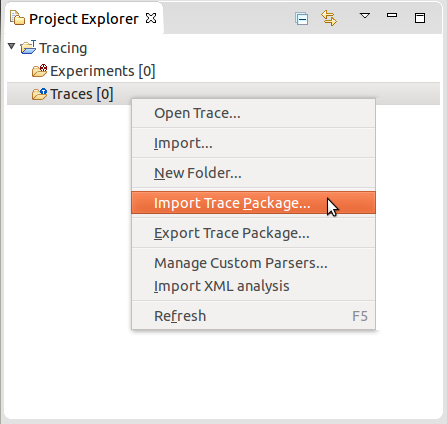
Next, open the trace by double-clicking on the trace element in the Project Explorer. The trace will be opened and the Sequence Diagram view will be filled.
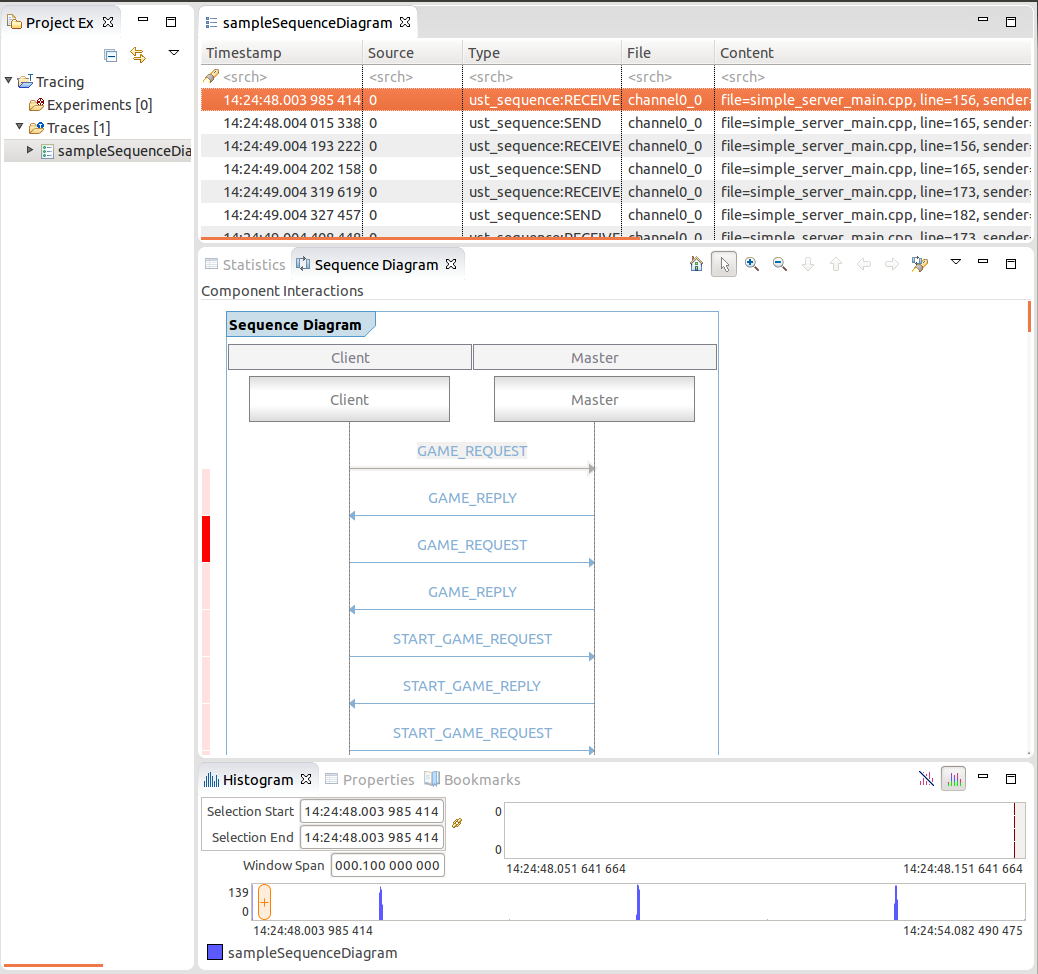
Now the reference implementation can be explored. To demonstrate the view features try the following things:
- Select a message in the Sequence diagram. As result the corresponding event will be selected in the Events View.
- Select an event in the Events View. As result the corresponding message in the Sequence Diagram View will be selected. If necessary, the page will be changed.
- In the Events View, press key End. As result, the Sequence Diagram view will jump to the last page.
- In the Events View, press key Home. As result, the Sequence Diagram view will jump to the first page.
- In the Sequence Diagram View select the find button. Enter the expression REGISTER.*, select Search for Interaction and press Find. As result the corresponding message will be selected in the Sequence Diagram and the corresponding event in the Events View will be selected. Select again Find the next occurrence of will be selected. Since the second occurrence is on a different page than the first, the corresponding page will be loaded.
- In the Sequence Diagram View, select menu item Hide Patterns.... Add the filter BALL.* for Interaction only and select OK. As result all messages with name BALL_REQUEST and BALL_REPLY will be hidden. To remove the filter, select menu item Hide Patterns..., deselect the corresponding filter and press OK. All the messages will be shown again.
Extending the Reference Loader
In some case it might be necessary to change the implementation of the analysis of each TmfEvent for the generation of Sequence Diagram Events. For that just extend the class TmfUml2SDSyncLoader and overwrite the method protected ITmfSyncSequenceDiagramEvent getSequnceDiagramEvent(TmfEvent tmfEvent) with your own implementation.
CTF Parser
CTF Format
CTF is a format used to store traces. It is self defining, binary and made to be easy to write to. Before going further, the full specification of the CTF file format can be found at http://www.efficios.com/ .
For the purpose of the reader some basic description will be given. A CTF trace typically is made of several files all in the same folder.
These files can be split into two types :
- Metadata
- Event streams
Metadata
The metadata is either raw text or packetized text. It is tsdl encoded. it contains a description of the type of data in the event streams. It can grow over time if new events are added to a trace but it will never overwrite what is already there.
Event Streams
The event streams are a file per stream per cpu. These streams are binary and packet based. The streams store events and event information (ie lost events) The event data is stored in headers and field payloads.
So if you have two streams (channels) "channel1" and "channel2" and 4 cores, you will have the following files in your trace directory: "channel1_0" , "channel1_1" , "channel1_2" , "channel1_3" , "channel2_0" , "channel2_1" , "channel2_2" & "channel2_3"
Reading a trace
In order to read a CTF trace, two steps must be done.
- The metadata must be read to know how to read the events.
- the events must be read.
The metadata is a written in a subset of the C language called TSDL. To read it, first it is depacketized (if it is not in plain text) then the raw text is parsed by an antlr grammer. The parsing is done in two phases. There is a lexer (CTFLexer.g) which separated the metatdata text into tokens. The tokens are then pattern matched using the parser (CTFParser.g) to form an AST. This AST is walked through using "IOStructGen.java" to populate streams and traces in trace parent object.
When the metadata is loaded and read, the trace object will be populated with 3 items:
- the event definitions available per stream: a definition is a description of the datatype.
- the event declarations available per stream: this will save declaration creation on a per event basis. They will all be created in advance, just not populated.
- the beginning of a packet index.
Now all the trace readers for the event streams have everything they need to read a trace. They will each point to one file, and read the file from packet to packet. Everytime the trace reader changes packet, the index is updated with the new packet's information. The readers are in a priority queue and sorted by timestamp. This ensures that the events are read in a sequential order. They are also sorted by file name so that in the eventuality that two events occur at the same time, they stay in the same order.
Seeking in a trace
The reason for maintaining an index is to speed up seeks. In the case that a user wishes to seek to a certain timestamp, they just have to find the index entry that contains the timestamp, and go there to iterate in that packet until the proper event is found. this will reduce the searches time by an order of 8000 for a 256k paket size (kernel default).
Interfacing to TMF
The trace can be read easily now but the data is still awkward to extract.
CtfLocation
A location in a given trace, it is currently the timestamp of a trace and the index of the event. The index shows for a given timestamp if it is the first second or nth element.
CtfTmfTrace
The CtfTmfTrace is a wrapper for the standard CTF trace that allows it to perform the following actions:
- initTrace() create a trace
- validateTrace() is the trace a CTF trace?
- getLocationRatio() how far in the trace is my location?
- seekEvent() sets the cursor to a certain point in a trace.
- readNextEvent() reads the next event and then advances the cursor
- getTraceProperties() gets the 'env' structures of the metadata
CtfIterator
The CtfIterator is a wrapper to the CTF file reader. It behaves like an iterator on a trace. However, it contains a file pointer and thus cannot be duplicated too often or the system will run out of file handles. To alleviate the situation, a pool of iterators is created at the very beginning and stored in the CtfTmfTrace. They can be retried by calling the GetIterator() method.
CtfIteratorManager
Since each CtfIterator will have a file reader, the OS will run out of handles if too many iterators are spawned. The solution is to use the iterator manager. This will allow the user to get an iterator. If there is a context at the requested position, the manager will return that one, if not, a context will be selected at random and set to the correct location. Using random replacement minimizes contention as it will settle quickly at a new balance point.
CtfTmfContext
The CtfTmfContext implements the ITmfContext type. It is the CTF equivalent of TmfContext. It has a CtfLocation and points to an iterator in the CtfTmfTrace iterator pool as well as the parent trace. it is made to be cloned easily and not affect system resources much. Contexts behave much like C file pointers (FILE*) but they can be copied until one runs out of RAM.
CtfTmfTimestamp
The CtfTmfTimestamp take a CTF time (normally a long int) and outputs the time formats it as a TmfTimestamp, allowing it to be compared to other timestamps. The time is stored with the UTC offset already applied. It also features a simple toString() function that allows it to output the time in more Human readable ways: "yyyy/mm/dd/hh:mm:ss.nnnnnnnnn ns" for example. An additional feature is the getDelta() function that allows two timestamps to be substracted, showing the time difference between A and B.
CtfTmfEvent
The CtfTmfEvent is an ITmfEvent that is used to wrap event declarations and event definitions from the CTF side into easier to read and parse chunks of information. It is a final class with final fields made to be newed very often without incurring performance costs. Most of the information is already available. It should be noted that one type of event can appear called "lost event" these are synthetic events that do not exist in the trace. They will not appear in other trace readers such as babeltrace.
Other
There are other helper files that format given events for views, they are simpler and the architecture does not depend on them.
Limitations
For the moment live trace reading is not supported, there are no sources of traces to test on.
Event matching and trace synchronization
Event matching consists in taking an event from a trace and linking it to another event in a possibly different trace. The example that comes to mind is matching network packets sent from one traced machine to another traced machine. These matches can be used to synchronize traces.
Trace synchronization consists in taking traces, taken on different machines, with a different time reference, and finding the formula to transform the timestamps of some of the traces, so that they all have the same time reference.
Event matching interfaces
Here's a description of the major parts involved in event matching. These classes are all in the org.eclipse.linuxtools.tmf.core.event.matching package:
- ITmfEventMatching: Controls the event matching process
- ITmfMatchEventDefinition: Describes how events are matched
- IMatchProcessingUnit: Processes the matched events
Implementation details and how to extend it
ITmfEventMatching interface and derived classes
This interface and its default abstract implementation TmfEventMatching control the event matching itself. Their only public method is matchEvents. The class needs to manage how to setup the traces, and any initialization or finalization procedures.
The abstract class generates an event request for each trace from which events are matched and waits for the request to complete before calling the one from another trace. The handleData method from the request calls the matchEvent method that needs to be implemented in children classes.
Class TmfNetworkEventMatching is a concrete implementation of this interface. It applies to all use cases where a in event can be matched with a out' event (in and out can be the same event, with different data). It creates a TmfEventDependency between the source and destination events. The dependency is added to the processing unit.
To match events requiring other mechanisms (for instance, a series of events can be matched with another series of events), one would need to implement another class either extending TmfEventMatching or implementing ITmfEventMatching. It would most probably also require a new ITmfMatchEventDefinition implementation.
ITmfMatchEventDefinition interface and its derived classes
These are the classes that describe how to actually match specific events together.
The canMatchTrace method will tell if a definition is compatible with a given trace.
The getUniqueField method will return a list of field values that uniquely identify this event and can be used to find a previous event to match with.
Typically, there would be a match definition abstract class/interface per event matching type.
The interface ITmfNetworkMatchDefinition adds the getDirection method to indicate whether this event is a in or out event to be matched with one from the opposite direction.
As examples, two concrete network match definitions have been implemented in the org.eclipse.linuxtools.lttng2.kernel.core.event.matching package for two compatible methods of matching TCP packets (See the LTTng User Guide on trace synchronization for information on those matching methods). Each one tells which events need to be present in the metadata of a CTF trace for this matching method to be applicable. It also returns the field values from each event that will uniquely match 2 events together.
IMatchProcessingUnit interface and derived classes
While matching events is an exercice in itself, it's what to do with the match that really makes this functionality interesting. This is the job of the IMatchProcessingUnit interface.
TmfEventMatches provides a default implementation that only stores the matches to count them. When a new match is obtained, the addMatch is called with the match and the processing unit can do whatever needs to be done with it.
A match processing unit can be an analysis in itself. For example, trace synchronization is done through such a processing unit. One just needs to set the processing unit in the TmfEventMatching constructor.
Code examples
Using network packets matching in an analysis
This example shows how one can create a processing unit inline to create a link between two events. In this example, the code already uses an event request, so there is no need here to call the matchEvents method, that will only create another request.
class MyAnalysis extends TmfAbstractAnalysisModule {

    private TmfNetworkEventMatching tcpMatching;

    ...

    protected void executeAnalysis() {

        IMatchProcessingUnit matchProcessing = new IMatchProcessingUnit() {
            @Override
            public void matchingEnded() {
            }

            @Override
            public void init(ITmfTrace[] fTraces) {
            }

            @Override
            public int countMatches() {
                return 0;
            }

            @Override
            public void addMatch(TmfEventDependency match) {
                log.debug("we got a tcp match! " + match.getSourceEvent().getContent() + " " + match.getDestinationEvent().getContent());
                TmfEvent source = match.getSourceEvent();
                TmfEvent destination = match.getDestinationEvent();
                /* Create a link between the two events */
            }
        };

        ITmfTrace[] traces = { getTrace() };
        tcpMatching = new TmfNetworkEventMatching(traces, matchProcessing);
        tcpMatching.initMatching();

        MyEventRequest request = new MyEventRequest(this, i);
        getTrace().sendRequest(request);
    }

    public void analyzeEvent(TmfEvent event) {
        ...
        tcpMatching.matchEvent(event, 0);
        ...
    }

    ...

}

class MyEventRequest extends TmfEventRequest {

    private final MyAnalysis analysis;

    MyEventRequest(MyAnalysis analysis, int traceno) {
        super(CtfTmfEvent.class,
            TmfTimeRange.ETERNITY,
            0,
            TmfDataRequest.ALL_DATA,
            ITmfDataRequest.ExecutionType.FOREGROUND);
        this.analysis = analysis;
    }

    @Override
    public void handleData(final ITmfEvent event) {
        super.handleData(event);
        if (event != null) {
            analysis.analyzeEvent(event);
        }
    }
}
Match network events from UST traces
Suppose a client-server application is instrumented using LTTng-UST. Traces are collected on the server and some clients on different machines. The traces can be synchronized using network event matching.
The following metadata describes the events:
    event {
        name = "myapp:send";
        id = 0;
        stream_id = 0;
        loglevel = 13;
        fields := struct {
            integer { size = 32; align = 8; signed = 1; encoding = none; base = 10; } _sendto;
            integer { size = 64; align = 8; signed = 1; encoding = none; base = 10; } _messageid;
            integer { size = 64; align = 8; signed = 1; encoding = none; base = 10; } _data;
        };
    };

    event {
        name = "myapp:receive";
        id = 1;
        stream_id = 0;
        loglevel = 13;
        fields := struct {
            integer { size = 32; align = 8; signed = 1; encoding = none; base = 10; } _from;
            integer { size = 64; align = 8; signed = 1; encoding = none; base = 10; } _messageid;
            integer { size = 64; align = 8; signed = 1; encoding = none; base = 10; } _data;
        };
    };
One would need to write an event match definition for those 2 events as follows:
public class MyAppUstEventMatching implements ITmfNetworkMatchDefinition {

    @Override
    public Direction getDirection(ITmfEvent event) {
        String evname = event.getType().getName();
        if (evname.equals("myapp:receive")) {
            return Direction.IN;
        } else if (evname.equals("myapp:send")) {
            return Direction.OUT;
        }
        return null;
    }

    @Override
    public List<Object> getUniqueField(ITmfEvent event) {
        List<Object> keys = new ArrayList<Object>();

        if (evname.equals("myapp:receive")) {
            keys.add(event.getContent().getField("from").getValue());
            keys.add(event.getContent().getField("messageid").getValue());
        } else {
            keys.add(event.getContent().getField("sendto").getValue());
            keys.add(event.getContent().getField("messageid").getValue());
        }

        return keys;
    }

    @Override
    public boolean canMatchTrace(ITmfTrace trace) {
        if (!(trace instanceof CtfTmfTrace)) {
            return false;
        }
        CtfTmfTrace ktrace = (CtfTmfTrace) trace;
        String[] events = { "myapp:receive", "myapp:send" };
        return ktrace.hasAtLeastOneOfEvents(events);
    }

    @Override
    public MatchingType[] getApplicableMatchingTypes() {
        MatchingType[] types = { MatchingType.NETWORK };
        return types;
    }

}
Somewhere in code that will be executed at the start of the plugin (like in the Activator), the following code will have to be run:
TmfEventMatching.registerMatchObject(new MyAppUstEventMatching());
Now, only adding the traces in an experiment and clicking the Synchronize traces menu element would synchronize the traces using the new definition for event matching.
Trace synchronization
Trace synchronization classes and interfaces are located in the org.eclipse.linuxtools.tmf.core.synchronization package.
Synchronization algorithm
Synchronization algorithms are used to synchronize traces from events matched between traces. After synchronization, traces taken on different machines with different time references see their timestamps modified such that they all use the same time reference (typically, the time of at least one of the traces). With traces from different machines, it is impossible to have perfect synchronization, so the result is a best approximation that takes network latency into account.
The abstract class SynchronizationAlgorithm is a processing unit for matches. New synchronization algorithms must extend this one, it already contains the functions to get the timestamp transforms for different traces.
The fully incremental convex hull synchronization algorithm is the default synchronization algorithm.
While the synchronization system provisions for more synchronization algorithms, there is not yet a way to select one, the experiment's trace synchronization uses the default algorithm. To test a new synchronization algorithm, the synchronization should be called directly like this:
SynchronizationAlgorithm syncAlgo = new MyNewSynchronizationAlgorithm();
syncAlgo = SynchronizationManager.synchronizeTraces(syncFile, traces, syncAlgo, true);
Timestamp transforms
Timestamp transforms are the formulae used to transform the timestamps from a trace into the reference time. The ITmfTimestampTransform is the interface to implement to add a new transform.
The following classes implement this interface:
- TmfTimestampTransform: default transform. It cannot be instantiated, it has a single static object TmfTimestampTransform.IDENTITY, which returns the original timestamp.
- TmfTimestampTransformLinear: transforms the timestamp using a linear formula: f(t) = at + b, where a and b are computed by the synchronization algorithm.
One could extend the interface for other timestamp transforms, for instance to have a transform where the formula would change over the course of the trace.
Todo
Here's a list of features not yet implemented that would enhance trace synchronization and event matching:
- Ability to select a synchronization algorithm
- Implement a better way to select the reference trace instead of arbitrarily taking the first in alphabetical order (for instance, the minimum spanning tree algorithm by Masoume Jabbarifar (article on the subject not published yet))
- Ability to join traces from the same host so that even if one of the traces is not synchronized with the reference trace, it will take the same timestamp transform as the one on the same machine.
- Instead of having the timestamp transforms per trace, have the timestamp transform as part of an experiment context, so that the trace's specific analysis, like the state system, are in the original trace, but are transformed only when needed for an experiment analysis.
- Add more views to display the synchronization information (only textual statistics are available for now)
Analysis Framework
Analysis modules are useful to tell the user exactly what can be done with a trace. The analysis framework provides an easy way to access and execute the modules and open the various outputs available.
Analyses can have parameters they can use in their code. They also have outputs registered to them to display the results from their execution.
Creating a new module
All analysis modules must implement the IAnalysisModule interface from the o.e.l.tmf.core project. An abstract class, TmfAbstractAnalysisModule, provides a good base implementation. It is strongly suggested to use it as a superclass of any new analysis.
Example
This example shows how to add a simple analysis module for an LTTng kernel trace with two parameters.
public class MyLttngKernelAnalysis extends TmfAbstractAnalysisModule {

    public static final String PARAM1 = "myparam";
    public static final String PARAM2 = "myotherparam";

    @Override
    public boolean canExecute(ITmfTrace trace) {
        /* This just makes sure the trace is an Lttng kernel trace, though
           usually that should have been done by specifying the trace type
           this analysis module applies to */
        if (!LttngKernelTrace.class.isAssignableFrom(trace.getClass())) {
            return false;
        }

        /* Does the trace contain the appropriate events? */
        String[] events = { "sched_switch", "sched_wakeup" };
        return ((LttngKernelTrace) trace).hasAllEvents(events);
    }

    @Override
    protected void canceling() {
	     /* The job I am running in is being cancelled, let's clean up */
    }

    @Override
    protected boolean executeAnalysis(final IProgressMonitor monitor) {
        /*
         * I am running in an Eclipse job, and I already know I can execute
         * on a given trace.
         *
         * In the end, I will return true if I was successfully completed or
         * false if I was either interrupted or something wrong occurred.
         */
        Object param1 = getParameter(PARAM1);
        int param2 = (Integer) getParameter(PARAM2);
    }

    @Override
    public Object getParameter(String name) {
        Object value = super.getParameter(name);
        /* Make sure the value of param2 is of the right type. For sake of
           simplicity, the full parameter format validation is not presented
           here */
        if ((value != null) && name.equals(PARAM2) && (value instanceof String)) {
            return Integer.parseInt((String) value);
        }
        return value;
    }

}
Available base analysis classes and interfaces
The following are available as base classes for analysis modules. They also extend the abstract TmfAbstractAnalysisModule
- TmfStateSystemAnalysisModule: A base analysis module that builds one state system. A module extending this class only needs to provide a state provider and the type of state system backend to use. All state systems should now use this base class as it also contains all the methods to actually create the state sytem with a given backend.
The following interfaces can optionally be implemented by analysis modules if they use their functionalities. For instance, some utility views, like the State System Explorer, may have access to the module's data through these interfaces.
- ITmfAnalysisModuleWithStateSystems: Modules implementing this have one or more state systems included in them. For example, a module may "hide" 2 state system modules for its internal workings. By implementing this interface, it tells that it has state systems and can return them if required.
How it works
Analyses are managed through the TmfAnalysisManager. The analysis manager is a singleton in the application and keeps track of all available analysis modules, with the help of IAnalysisModuleHelper. It can be queried to get the available analysis modules, either all of them or only those for a given tracetype. The helpers contain the non-trace specific information on an analysis module: its id, its name, the tracetypes it applies to, etc.
When a trace is opened, the helpers for the applicable analysis create new instances of the analysis modules. The analysis are then kept in a field of the trace and can be executed automatically or on demand.
The analysis is executed by calling the IAnalysisModule#schedule() method. This method makes sure the analysis is executed only once and, if it is already running, it won't start again. The analysis itself is run inside an Eclipse job that can be cancelled by the user or the application. The developer must consider the progress monitor that comes as a parameter of the executeAnalysis() method, to handle the proper cancellation of the processing. The IAnalysisModule#waitForCompletion() method will block the calling thread until the analysis is completed. The method will return whether the analysis was successfully completed or if it was cancelled.
A running analysis can be cancelled by calling the IAnalysisModule#cancel() method. This will set the analysis as done, so it cannot start again unless it is explicitly reset. This is done by calling the protected method resetAnalysis.
Telling TMF about the analysis module
Now that the analysis module class exists, it is time to hook it to the rest of TMF so that it appears under the traces in the project explorer. The way to do so is to add an extension of type org.eclipse.linuxtools.tmf.core.analysis to a plugin, either through the Extensions tab of the Plug-in Manifest Editor or by editing directly the plugin.xml file.
The following code shows what the resulting plugin.xml file should look like.
<extension
         point="org.eclipse.linuxtools.tmf.core.analysis">
      <module
         id="my.lttng.kernel.analysis.id"
         name="My LTTng Kernel Analysis"
         analysis_module="my.plugin.package.MyLttngKernelAnalysis"
         automatic="true">
         <parameter
               name="myparam">
         </parameter>
         <parameter
               default_value="3"
               name="myotherparam">
         <tracetype
               class="org.eclipse.linuxtools.lttng2.kernel.core.trace.LttngKernelTrace">
         </tracetype>
      </module>
</extension>
This defines an analysis module where the analysis_module attribute corresponds to the module class and must implement IAnalysisModule. This module has 2 parameters: myparam and myotherparam which has default value of 3. The tracetype element tells which tracetypes this analysis applies to. There can be many tracetypes. Also, the automatic attribute of the module indicates whether this analysis should be run when the trace is opened, or wait for the user's explicit request.
Note that with these extension points, it is possible to use the same module class for more than one analysis (with different ids and names). That is a desirable behavior. For instance, a third party plugin may add a new tracetype different from the one the module is meant for, but on which the analysis can run. Also, different analyses could provide different results with the same module class but with different default values of parameters.
Attaching outputs and views to the analysis module
Analyses will typically produce outputs the user can examine. Outputs can be a text dump, a .dot file, an XML file, a view, etc. All output types must implement the IAnalysisOutput interface.
An output can be registered to an analysis module at any moment by calling the IAnalysisModule#registerOutput() method. Analyses themselves may know what outputs are available and may register them in the analysis constructor or after analysis completion.
The various concrete output types are:
- TmfAnalysisViewOutput: It takes a view ID as parameter and, when selected, opens the view.
Using the extension point to add outputs
Analysis outputs can also be hooked to an analysis using the same extension point org.eclipse.linuxtools.tmf.core.analysis in the plugin.xml file. Outputs can be matched either to a specific analysis identified by an ID, or to all analysis modules extending or implementing a given class or interface.
The following code shows how to add a view output to the analysis defined above directly in the plugin.xml file. This extension does not have to be in the same plugin as the extension defining the analysis. Typically, an analysis module can be defined in a core plugin, along with some outputs that do not require UI elements. Other outputs, like views, who need UI elements, will be defined in a ui plugin.
<extension
         point="org.eclipse.linuxtools.tmf.core.analysis">
      <output
            class="org.eclipse.linuxtools.tmf.ui.analysis.TmfAnalysisViewOutput"
            id="my.plugin.package.ui.views.myView">
         <analysisId
               id="my.lttng.kernel.analysis.id">
         </analysisId>
      </output>
      <output
            class="org.eclipse.linuxtools.tmf.ui.analysis.TmfAnalysisViewOutput"
            id="my.plugin.package.ui.views.myMoreGenericView">
         <analysisModuleClass
               class="my.plugin.package.core.MyAnalysisModuleClass">
         </analysisModuleClass>
      </output>
</extension>
Providing help for the module
For now, the only way to provide a meaningful help message to the user is by overriding the IAnalysisModule#getHelpText() method and return a string that will be displayed in a message box.
What still needs to be implemented is for a way to add a full user/developer documentation with mediawiki text file for each module and automatically add it to Eclipse Help. Clicking on the Help menu item of an analysis module would open the corresponding page in the help.
Using analysis parameter providers
An analysis may have parameters that can be used during its execution. Default values can be set when describing the analysis module in the plugin.xml file, or they can use the IAnalysisParameterProvider interface to provide values for parameters. TmfAbstractAnalysisParamProvider provides an abstract implementation of this interface, that automatically notifies the module of a parameter change.
Example parameter provider
The following example shows how to have a parameter provider listen to a selection in the LTTng kernel Control Flow view and send the thread id to the analysis.
public class MyLttngKernelParameterProvider extends TmfAbstractAnalysisParamProvider {

    private ControlFlowEntry fCurrentEntry = null;

    private static final String NAME = "My Lttng kernel parameter provider"; //$NON-NLS-1$

    private ISelectionListener selListener = new ISelectionListener() {
        @Override
        public void selectionChanged(IWorkbenchPart part, ISelection selection) {
            if (selection instanceof IStructuredSelection) {
                Object element = ((IStructuredSelection) selection).getFirstElement();
                if (element instanceof ControlFlowEntry) {
                    ControlFlowEntry entry = (ControlFlowEntry) element;
                    setCurrentThreadEntry(entry);
                }
            }
        }
    };

    /*
     * Constructor
     */
    public CriticalPathParameterProvider() {
        super();
        registerListener();
    }

    @Override
    public String getName() {
        return NAME;
    }

    @Override
    public Object getParameter(String name) {
        if (fCurrentEntry == null) {
            return null;
        }
        if (name.equals(MyLttngKernelAnalysis.PARAM1)) {
            return fCurrentEntry.getThreadId()
        }
        return null;
    }

    @Override
    public boolean appliesToTrace(ITmfTrace trace) {
        return (trace instanceof LttngKernelTrace);
    }

    private void setCurrentThreadEntry(ControlFlowEntry entry) {
        if (!entry.equals(fCurrentEntry)) {
            fCurrentEntry = entry;
            this.notifyParameterChanged(MyLttngKernelAnalysis.PARAM1);
        }
    }

    private void registerListener() {
        final IWorkbench wb = PlatformUI.getWorkbench();

        final IWorkbenchPage activePage = wb.getActiveWorkbenchWindow().getActivePage();

        /* Add the listener to the control flow view */
        view = activePage.findView(ControlFlowView.ID);
        if (view != null) {
            view.getSite().getWorkbenchWindow().getSelectionService().addPostSelectionListener(selListener);
            view.getSite().getWorkbenchWindow().getPartService().addPartListener(partListener);
        }
    }

}
Register the parameter provider to the analysis
To have the parameter provider class register to analysis modules, it must first register through the analysis manager. It can be done in a plugin's activator as follows:
@Override
public void start(BundleContext context) throws Exception {
    /* ... */
    TmfAnalysisManager.registerParameterProvider("my.lttng.kernel.analysis.id", MyLttngKernelParameterProvider.class)
}
where MyLttngKernelParameterProvider will be registered to analysis "my.lttng.kernel.analysis.id". When the analysis module is created, the new module will register automatically to the singleton parameter provider instance. Only one module is registered to a parameter provider at a given time, the one corresponding to the currently selected trace.
Providing requirements to analyses
Analysis requirement provider API
A requirement defines the needs of an analysis. For example, an analysis could need an event named "sched_switch" in order to be properly executed. The requirements are represented by the class TmfAnalysisRequirement. Since IAnalysisModule extends the IAnalysisRequirementProvider interface, all analysis modules must provide their requirements. If the analysis module extends TmfAbstractAnalysisModule, it has the choice between overriding the requirements getter (IAnalysisRequirementProvider#getAnalysisRequirements()) or not, since the abstract class returns an empty collection by default (no requirements).
Requirement values
When instantiating a requirement, the developer needs to specify a type to which all the values added to the requirement will be linked. In the earlier example, there would be an "event" or "eventName" type. The type is represented by a string, like all values added to the requirement object. With an 'event' type requirement, a trace generator like the LTTng Control could automatically enable the required events. This is possible by calling the TmfAnalysisRequirementHelper class. Another point we have to take into consideration is the priority level of each value added to the requirement object. The enum TmfAnalysisRequirement#ValuePriorityLevel gives the choice between ValuePriorityLevel#MANDATORY and ValuePriorityLevel#OPTIONAL. That way, we can tell if an analysis can run without a value or not. To add values, one must call TmfAnalysisRequirement#addValue().
Moreover, information can be added to requirements. That way, the developer can explicitly give help details at the requirement level instead of at the analysis level (which would just be a general help text). To add information to a requirement, the method TmfAnalysisRequirement#addInformation() must be called. Adding information is not mandatory.
Example of providing requirements
In this example, we will implement a method that initializes a requirement object and return it in the IAnalysisRequirementProvider#getAnalysisRequirements() getter. The example method will return a set with two requirements. The first one will indicate the events needed by a specific analysis and the last one will tell on what domain type the analysis applies. In the event type requirement, we will indicate that the analysis needs a mandatory event and an optional one.
@Override
public Iterable<TmfAnalysisRequirement> getAnalysisRequirements() {
    Set<TmfAnalysisRequirement> requirements = new HashSet<>();

    /* Create requirements of type 'event' and 'domain' */
    TmfAnalysisRequirement eventRequirement = new TmfAnalysisRequirement("event");
    TmfAnalysisRequirement domainRequirement = new TmfAnalysisRequirement("domain");

    /* Add the values */
    domainRequirement.addValue("kernel", TmfAnalysisRequirement.ValuePriorityLevel.MANDATORY);
    eventRequirement.addValue("sched_switch", TmfAnalysisRequirement.ValuePriorityLevel.MANDATORY);
    eventRequirement.addValue("sched_wakeup", TmfAnalysisRequirement.ValuePriorityLevel.OPTIONAL);

    /* An information about the events */
    eventRequirement.addInformation("The event sched_wakeup is optional because it's not properly handled by this analysis yet.");

    /* Add them to the set */
    requirements.add(domainRequirement);
    requirements.add(eventRequirement);

    return requirements;
}
TODO
Here's a list of features not yet implemented that would improve the analysis module user experience:
- Implement help using the Eclipse Help facility (without forgetting an eventual command line request)
- The abstract class TmfAbstractAnalysisModule executes an analysis as a job, but nothing compels a developer to do so for an analysis implementing the IAnalysisModule interface. We should force the execution of the analysis as a job, either from the trace itself or using the TmfAnalysisManager or by some other mean.
- Views and outputs are often registered by the analysis themselves (forcing them often to be in the .ui packages because of the views), because there is no other easy way to do so. We should extend the analysis extension point so that .ui plugins or other third-party plugins can add outputs to a given analysis that resides in the core.
- Improve the user experience with the analysis:
- Allow the user to select which analyses should be available, per trace or per project.
- Allow the user to view all available analyses even though he has no imported traces.
- Allow the user to generate traces for a given analysis, or generate a template to generate the trace that can be sent as parameter to the tracer.
- Give the user a visual status of the analysis: not executed, in progress, completed, error.
- Give a small screenshot of the output as icon for it.
- Allow to specify parameter values from the GUI.
- Add the possibility for an analysis requirement to be composed of another requirement.
- Generate a trace session from analysis requirements.
Performance Tests
Performance testing allows to calculate some metrics (CPU time, Memory Usage, etc) that some part of the code takes during its execution. These metrics can then be used as is for information on the system's execution, or they can be compared either with other execution scenarios, or previous runs of the same scenario, for instance, after some optimization has been done on the code.
For automatic performance metric computation, we use the org.eclipse.test.performance plugin, provided by the Eclipse Test Feature.
Add performance tests
Where
Performance tests are unit tests and they are added to the corresponding unit tests plugin. To separate performance tests from unit tests, a separate source folder, typically named perf, is added to the plug-in.
Tests are to be added to a package under the perf directory, the package name would typically match the name of the package it is testing. For each package, a class named AllPerfTests would list all the performance tests classes inside this package. And like for unit tests, a class named AllPerfTests for the plug-in would list all the packages' AllPerfTests classes.
When adding performance tests for the first time in a plug-in, the plug-in's AllPerfTests class should be added to the global list of performance tests, found in package org.eclipse.linuxtools.lttng.alltests, in class RunAllPerfTests. This will ensure that performance tests for the plug-in are run along with the other performance tests
How
TMF is using the org.eclipse.test.performance framework for performance tests. Using this, performance metrics are automatically taken and, if many runs of the tests are run, average and standard deviation are automatically computed. Results can optionally be stored to a database for later use.
Here is an example of how to use the test framework in a performance test:
public class AnalysisBenchmark {

    private static final String TEST_ID = "org.eclipse.linuxtools#LTTng kernel analysis";
    private static final CtfTmfTestTrace testTrace = CtfTmfTestTrace.TRACE2;
    private static final int LOOP_COUNT = 10;

    /**
     * Performance test
     */
    @Test
    public void testTrace() {
        assumeTrue(testTrace.exists());

        /** Create a new performance meter for this scenario */
        Performance perf = Performance.getDefault();
        PerformanceMeter pm = perf.createPerformanceMeter(TEST_ID);

        /** Optionally, tag this test for summary or global summary on a given dimension */
        perf.tagAsSummary(pm, "LTTng Kernel Analysis", Dimension.CPU_TIME);
        perf.tagAsGlobalSummary(pm, "LTTng Kernel Analysis", Dimension.CPU_TIME);

        /** The test will be run LOOP_COUNT times */
        for (int i = 0; i < LOOP_COUNT; i++) {

            /** Start each run of the test with new objects to avoid different code paths */
            try (IAnalysisModule module = new LttngKernelAnalysisModule();
                    LttngKernelTrace trace = new LttngKernelTrace()) {
                module.setId("test");
                trace.initTrace(null, testTrace.getPath(), CtfTmfEvent.class);
                module.setTrace(trace);

                /** The analysis execution is being tested, so performance metrics
                 * are taken before and after the execution */
                pm.start();
                TmfTestHelper.executeAnalysis(module);
                pm.stop();

                /*
                 * Delete the supplementary files, so next iteration rebuilds
                 * the state system.
                 */
                File suppDir = new File(TmfTraceManager.getSupplementaryFileDir(trace));
                for (File file : suppDir.listFiles()) {
                    file.delete();
                }

            } catch (TmfAnalysisException | TmfTraceException e) {
                fail(e.getMessage());
            }
        }

        /** Once the test has been run many times, committing the results will
         * calculate average, standard deviation, and, if configured, save the
         * data to a database */
        pm.commit();
    }
}
For more information, see The Eclipse Performance Test How-to
Some rules to help write performance tests are explained in section ABC of performance testing.
Run a performance test
Performance tests are unit tests, so, just like unit tests, they can be run by right-clicking on a performance test class and selecting Run As -> Junit Plug-in Test.
By default, if no database has been configured, results will be displayed in the Console at the end of the test.
Here is the sample output from the test described in the previous section. It shows all the metrics that have been calculated during the test.
Scenario 'org.eclipse.linuxtools#LTTng kernel analysis' (average over 10 samples):
  System Time:            3.04s         (95% in [2.77s, 3.3s])         Measurable effect: 464ms (1.3 SDs) (required sample size for an effect of 5% of mean: 94)
  Used Java Heap:        -1.43M         (95% in [-33.67M, 30.81M])     Measurable effect: 57.01M (1.3 SDs) (required sample size for an effect of 5% of stdev: 6401)
  Working Set:           14.43M         (95% in [-966.01K, 29.81M])    Measurable effect: 27.19M (1.3 SDs) (required sample size for an effect of 5% of stdev: 6400)
  Elapsed Process:        3.04s         (95% in [2.77s, 3.3s])         Measurable effect: 464ms (1.3 SDs) (required sample size for an effect of 5% of mean: 94)
  Kernel time:             621ms        (95% in [586ms, 655ms])        Measurable effect: 60ms (1.3 SDs) (required sample size for an effect of 5% of mean: 39)
  CPU Time:               6.06s         (95% in [5.02s, 7.09s])        Measurable effect: 1.83s (1.3 SDs) (required sample size for an effect of 5% of mean: 365)
  Hard Page Faults:          0          (95% in [0, 0])                Measurable effect: 0 (1.3 SDs) (required sample size for an effect of 5% of stdev: 6400)
  Soft Page Faults:       9.27K         (95% in [3.28K, 15.27K])       Measurable effect: 10.6K (1.3 SDs) (required sample size for an effect of 5% of mean: 5224)
  Text Size:                 0          (95% in [0, 0])
  Data Size:                 0          (95% in [0, 0])
  Library Size:           32.5M         (95% in [-12.69M, 77.69M])     Measurable effect: 79.91M (1.3 SDs) (required sample size for an effect of 5% of stdev: 6401)
Results from performance tests can be saved automatically to a derby database. Derby can be run either in embedded mode, locally on a machine, or on a server. More information on setting up derby for performance tests can be found here: The Eclipse Performance Test How-to. The following documentation will show how to configure an Eclipse run configuration to store results on a derby database located on a server.
Note that to store results in a derby database, the org.apache.derby plug-in must be available within your Eclipse. Since it is an optional dependency, it is not included in the target definition. It can be installed via the Orbit repository, in Help -> Install new software.... If the Orbit repository is not listed, click on the latest one from [1] and copy the link under Orbit Build Repository.
To store the data to a database, it needs to be configured in the run configuration. In Run -> Run configurations.., under Junit Plug-in Test, find the run configuration that corresponds to the test you wish to run, or create one if it is not present yet.
In the Arguments tab, in the box under VM Arguments, add on separate lines the following information
-Declipse.perf.dbloc=//javaderby.dorsal.polymtl.ca
-Declipse.perf.config=build=mybuild;host=myhost;config=linux;jvm=1.7
The eclipse.perf.dbloc parameter is the url (or filename) of the derby database. The database is by default named perfDB, with username and password guest/guest. If the database does not exist, it will be created, initialized and populated.
The eclipse.perf.config parameter identifies a variation: It typically identifies the build on which is it run (commitId and/or build date, etc), the machine (host) on which it is run, the configuration of the system (for example Linux or Windows), the jvm etc. That parameter is a list of ';' separated key-value pairs. To be backward-compatible with the Eclipse Performance Tests Framework, the 4 keys mentioned above are mandatory, but any key-value pairs can be used.
ABC of performance testing
Here follow some rules to help design good and meaningful performance tests.
Determine what to test
For tests to be significant, it is important to choose what exactly is to be tested and make sure it is reproducible every run. To limit the amount of noise caused by the TMF framework, the performance test code should be tweaked so that only the method under test is run. For instance, a trace should not be "opened" (by calling the traceOpened() method) to test an analysis, since the traceOpened method will also trigger the indexing and the execution of all applicable automatic analysis.
For each code path to test, multiple scenarios can be defined. For instance, an analysis could be run on different traces, with different sizes. The results will show how the system scales and/or varies depending on the objects it is executed on.
The number of samples used to compute the results is also important. The code to test will typically be inside a for loop that runs exactly the same code each time for a given number of times. All objects used for the test must start in the same state at each iteration of the loop. For instance, any trace used during an execution should be disposed of at the end of the loop, and any supplementary file that may have been generated in the run should be deleted.
Before submitting a performance test to the code review, you should run it a few times (with results in the Console) and see if the standard deviation is not too large and if the results are reproducible.
Metrics descriptions and considerations
CPU time: CPU time represent the total time spent on CPU by the current process, for the time of the test execution. It is the sum of the time spent by all threads. On one hand, it is more significant than the elapsed time, since it should be the same no matter how many CPU cores the computer has. But since it calculates the time of every thread, one has to make sure that only threads related to what is being tested are executed during that time, or else the results will include the times of those other threads. For an application like TMF, it is hard to control all the threads, and empirically, it is found to vary a lot more than the system time from one run to the other.
System time (Elapsed time): The time between the start and the end of the execution. It will vary depending on the parallelisation of the threads and the load of the machine.
Kernel time: Time spent in kernel mode
Used Java Heap: It is the difference between the memory used at the beginning of the execution and at the end. This metric may be useful to calculate the overall size occupied by the data generated by the test run, by forcing a garbage collection before taking the metrics at the beginning and at the end of the execution. But it will not show the memory used throughout the execution. There can be a large standard deviation. The reason for this is that when benchmarking methods that trigger tasks in different threads, like signals and/or analysis, these other threads might be in various states at each run of the test, which will impact the memory usage calculated. When using this metric, either make sure the method to test does not trigger external threads or make sure you wait for them to finish.
Network Tracing
Adding a protocol
Supporting a new network protocol in TMF is straightforward. Minimal effort is required to support new protocols. In this tutorial, the UDP protocol will be added to the list of supported protocols.
Architecture
All the TMF pcap-related code is divided in three projects (not considering the tests plugins):
- org.eclipse.linuxtools.pcap.core, which contains the parser that will read pcap files and constructs the different packets from a ByteBuffer. It also contains means to build packet streams, which are conversation (list of packets) between two endpoints. To add a protocol, almost all of the work will be in that project.
- org.eclipse.linuxtools.tmf.pcap.core, which contains TMF-specific concepts and act as a wrapper between TMF and the pcap parsing library. It only depends on org.eclipse.linuxtools.tmf.core and org.eclipse.pcap.core. To add a protocol, one file must be edited in this project.
- org.eclipse.linuxtools.tmf.pcap.ui, which contains all TMF pcap UI-specific concepts, such as the views and perspectives. No work is needed in that project.
UDP Packet Structure
The UDP is a transport-layer protocol that does not guarantee message delivery nor in-order message reception. A UDP packet (datagram) has the following structure:
| Offsets | Octet | 0 | 1 | 2 | 3 | ||||||||||||||||||||||||||||
|---|---|---|---|---|---|---|---|---|---|---|---|---|---|---|---|---|---|---|---|---|---|---|---|---|---|---|---|---|---|---|---|---|---|
| Octet | Bit | 0 | 1 | 2 | 3 | 4 | 5 | 6 | 7 | 8 | 9 | 10 | 11 | 12 | 13 | 14 | 15 | 16 | 17 | 18 | 19 | 20 | 21 | 22 | 23 | 24 | 25 | 26 | 27 | 28 | 29 | 30 | 31 |
| 0 | 0 | Source port | Destination port | ||||||||||||||||||||||||||||||
| 4 | 32 | Length | Checksum | ||||||||||||||||||||||||||||||
Knowing that, we can define an UDPPacket class that contains those fields.
Creating the UDPPacket
First, in org.eclipse.linuxtools.pcap.core, create a new package named org.eclipse.linuxtools.pcap.core.protocol.name with name being the name of the new protocol. In our case name is udp so we create the package org.eclipse.linuxtools.pcap.core.protocol.udp. All our work is going in this package.
In this package, we create a new class named UDPPacket that extends Packet. All new protocol must define a packet type that extends the abstract class Packet. We also add different fields:
- Packet fChildPacket, which is the packet encapsulated by this UDP packet, if it exists. This field will be initialized by findChildPacket().
- ByteBuffer fPayload, which is the payload of this packet. Basically, it is the UDP packet without its header.
- int fSourcePort, which is an unsigned 16-bits field, that contains the source port of the packet (see packet structure).
- int fDestinationPort, which is an unsigned 16-bits field, that contains the destination port of the packet (see packet structure).
- int fTotalLength, which is an unsigned 16-bits field, that contains the total length (header + payload) of the packet.
- int fChecksum, which is an unsigned 16-bits field, that contains a checksum to verify the integrity of the data.
- UDPEndpoint fSourceEndpoint, which contains the source endpoint of the UDPPacket. The UDPEndpoint class will be created later in this tutorial.
- UDPEndpoint fDestinationEndpoint, which contains the destination endpoint of the UDPPacket.
- ImmutableMap<String, String> fFields, which is a map that contains all the packet fields (see in data structure) which assign a field name with its value. Those values will be displayed on the UI.
We also create the UDPPacket(PcapFile file, @Nullable Packet parent, ByteBuffer packet) constructor. The parameters are:
- PcapFile file, which is the pcap file to which this packet belongs.
- Packet parent, which is the packet encasulating this UDPPacket
- ByteBuffer packet, which is a ByteBuffer that contains all the data necessary to initialize the fields of this UDPPacket. We will retrieve bytes from it during object construction.
The following class is obtained:
package org.eclipse.linuxtools.pcap.core.protocol.udp;

import java.nio.ByteBuffer;
import java.util.Map;

import org.eclipse.linuxtools.internal.pcap.core.endpoint.ProtocolEndpoint;
import org.eclipse.linuxtools.internal.pcap.core.packet.BadPacketException;
import org.eclipse.linuxtools.internal.pcap.core.packet.Packet;

public class UDPPacket extends Packet {

    private final @Nullable Packet fChildPacket;
    private final @Nullable ByteBuffer fPayload;

    private final int fSourcePort;
    private final int fDestinationPort;
    private final int fTotalLength;
    private final int fChecksum;

    private @Nullable UDPEndpoint fSourceEndpoint;
    private @Nullable UDPEndpoint fDestinationEndpoint;

    private @Nullable ImmutableMap<String, String> fFields;

    /**
     * Constructor of the UDP Packet class.
     *
     * @param file
     *            The file that contains this packet.
     * @param parent
     *            The parent packet of this packet (the encapsulating packet).
     * @param packet
     *            The entire packet (header and payload).
     * @throws BadPacketException
     *             Thrown when the packet is erroneous.
     */
    public UDPPacket(PcapFile file, @Nullable Packet parent, ByteBuffer packet) throws BadPacketException {
        super(file, parent, Protocol.UDP);
        // TODO Auto-generated constructor stub
    }


    @Override
    public Packet getChildPacket() {
        // TODO Auto-generated method stub
        return null;
    }

    @Override
    public ByteBuffer getPayload() {
        // TODO Auto-generated method stub
        return null;
    }

    @Override
    public boolean validate() {
        // TODO Auto-generated method stub
        return false;
    }

    @Override
    protected Packet findChildPacket() throws BadPacketException {
        // TODO Auto-generated method stub
        return null;
    }

    @Override
    public ProtocolEndpoint getSourceEndpoint() {
        // TODO Auto-generated method stub
        return null;
    }

    @Override
    public ProtocolEndpoint getDestinationEndpoint() {
        // TODO Auto-generated method stub
        return null;
    }

    @Override
    public Map<String, String> getFields() {
        // TODO Auto-generated method stub
        return null;
    }

    @Override
    public String getLocalSummaryString() {
        // TODO Auto-generated method stub
        return null;
    }

    @Override
    protected String getSignificationString() {
        // TODO Auto-generated method stub
        return null;
    }

    @Override
    public boolean equals(Object obj) {
        // TODO Auto-generated method stub
        return false;
    }

    @Override
    public int hashCode() {
        // TODO Auto-generated method stub
        return 0;
    }

}
Now, we implement the constructor. It is done in four steps:
- We initialize fSourceEndpoint, fDestinationEndpoint and fFields to null, since those are lazy-loaded. This allows faster construction of the packet and thus faster parsing.
- We initialize fSourcePort, fDestinationPort, fTotalLength, fChecksum using ByteBuffer packet. Thanks to the packet data structure, we can simply retrieve packet.getShort() to get the value. Since there is no unsigned in Java, special care is taken to avoid negative number. We use the utility method ConversionHelper.unsignedShortToInt() to convert it to an integer, and initialize the fields.
- Now that the header is parsed, we take the rest of the ByteBuffer packet to initialize the payload, if there is one. To do this, we simply generate a new ByteBuffer starting from the current position.
- We initialize the field fChildPacket using the method findChildPacket()
The following constructor is obtained:
    public UDPPacket(PcapFile file, @Nullable Packet parent, ByteBuffer packet) throws BadPacketException {
        super(file, parent, Protocol.UDP);

        // The endpoints and fFields are lazy loaded. They are defined in the get*Endpoint()
        // methods.
        fSourceEndpoint = null;
        fDestinationEndpoint = null;
        fFields = null;

        // Initialize the fields from the ByteBuffer
        packet.order(ByteOrder.BIG_ENDIAN);
        packet.position(0);

        fSourcePort = ConversionHelper.unsignedShortToInt(packet.getShort());
        fDestinationPort = ConversionHelper.unsignedShortToInt(packet.getShort());
        fTotalLength = ConversionHelper.unsignedShortToInt(packet.getShort());
        fChecksum = ConversionHelper.unsignedShortToInt(packet.getShort());

        // Initialize the payload
        if (packet.array().length - packet.position() > 0) {
            byte[] array = new byte[packet.array().length - packet.position()];
            packet.get(array);

            ByteBuffer payload = ByteBuffer.wrap(array);
            payload.order(ByteOrder.BIG_ENDIAN);
            payload.position(0);
            fPayload = payload;
        } else {
            fPayload = null;
        }

        // Find child
        fChildPacket = findChildPacket();

    }
Then, we implement the following methods:
- public Packet getChildPacket(): simple getter of fChildPacket
- public ByteBuffer getPayload(): simple getter of fPayload
- public boolean validate(): method that checks if the packet is valid. In our case, the packet is valid if the retrieved checksum fChecksum and the real checksum (that we can compute using the fields and payload of UDPPacket) are the same.
- protected Packet findChildPacket(): method that create a new packet if a encapsulated protocol is found. For instance, based on the fDestinationPort, it could determine what the encapsulated protocol is and creates a new packet object.
- public ProtocolEndpoint getSourceEndpoint(): method that initializes and returns the source endpoint.
- public ProtocolEndpoint getDestinationEndpoint(): method that initializes and returns the destination endpoint.
- public Map<String, String> getFields(): method that initializes and returns the map containing the fields matched to their value.
- public String getLocalSummaryString(): method that returns a string summarizing the most important fields of the packet. There is no need to list all the fields, just the most important one. This will be displayed on UI.
- protected String getSignificationString(): method that returns a string describing the meaning of the packet. If there is no particular meaning, it is possible to return getLocalSummaryString().
- public boolean equals(Object obj): Object's equals method.
- public int hashCode(): Object's hashCode method.
We get the following code:
    @Override
    public @Nullable Packet getChildPacket() {
        return fChildPacket;
    }

    @Override
    public @Nullable ByteBuffer getPayload() {
        return fPayload;
    }

    /**
     * Getter method that returns the UDP Source Port.
     *
     * @return The source Port.
     */
    public int getSourcePort() {
        return fSourcePort;
    }

    /**
     * Getter method that returns the UDP Destination Port.
     *
     * @return The destination Port.
     */
    public int getDestinationPort() {
        return fDestinationPort;
    }

    /**
     * {@inheritDoc}
     *
     * See http://www.iana.org/assignments/service-names-port-numbers/service-
     * names-port-numbers.xhtml or
     * http://en.wikipedia.org/wiki/List_of_TCP_and_UDP_port_numbers
     */
    @Override
    protected @Nullable Packet findChildPacket() throws BadPacketException {
        // When more protocols are implemented, we can simply do a switch on the fDestinationPort field to find the child packet.
        // For instance, if the destination port is 80, then chances are the HTTP protocol is encapsulated. We can create a new HTTP
        // packet (after some verification that it is indeed the HTTP protocol).
        ByteBuffer payload = fPayload;
        if (payload == null) {
            return null;
        }

        return new UnknownPacket(getPcapFile(), this, payload);
    }

    @Override
    public boolean validate() {
        // Not yet implemented. ATM, we consider that all packets are valid.
        // TODO Implement it. We can compute the real checksum and compare it to fChecksum.
        return true;
    }

    @Override
    public UDPEndpoint getSourceEndpoint() {
        @Nullable
        UDPEndpoint endpoint = fSourceEndpoint;
        if (endpoint == null) {
            endpoint = new UDPEndpoint(this, true);
        }
        fSourceEndpoint = endpoint;
        return fSourceEndpoint;
    }

    @Override
    public UDPEndpoint getDestinationEndpoint() {
        @Nullable UDPEndpoint endpoint = fDestinationEndpoint;
        if (endpoint == null) {
            endpoint = new UDPEndpoint(this, false);
        }
        fDestinationEndpoint = endpoint;
        return fDestinationEndpoint;
    }

    @Override
    public Map<String, String> getFields() {
        ImmutableMap<String, String> map = fFields;
        if (map == null) {
            @SuppressWarnings("null")
            @NonNull ImmutableMap<String, String> newMap = ImmutableMap.<String, String> builder()
                    .put("Source Port", String.valueOf(fSourcePort)) //$NON-NLS-1$
                    .put("Destination Port", String.valueOf(fDestinationPort)) //$NON-NLS-1$
                    .put("Length", String.valueOf(fTotalLength) + " bytes") //$NON-NLS-1$ //$NON-NLS-2$
                    .put("Checksum", String.format("%s%04x", "0x", fChecksum)) //$NON-NLS-1$ //$NON-NLS-2$ //$NON-NLS-3$
                    .build();
            fFields = newMap;
            return newMap;
        }
        return map;
    }

    @Override
    public String getLocalSummaryString() {
        return "Src Port: " + fSourcePort + ", Dst Port: " + fDestinationPort; //$NON-NLS-1$ //$NON-NLS-2$
    }

    @Override
    protected String getSignificationString() {
        return "Source Port: " + fSourcePort + ", Destination Port: " + fDestinationPort; //$NON-NLS-1$ //$NON-NLS-2$
    }

    @Override
    public int hashCode() {
        final int prime = 31;
        int result = 1;
        result = prime * result + fChecksum;
        final Packet child = fChildPacket;
        if (child != null) {
            result = prime * result + child.hashCode();
        } else {
            result = prime * result;
        }
        result = prime * result + fDestinationPort;
        final ByteBuffer payload = fPayload;
        if (payload != null) {
            result = prime * result + payload.hashCode();
        } else {
            result = prime * result;
        }
        result = prime * result + fSourcePort;
        result = prime * result + fTotalLength;
        return result;
    }

    @Override
    public boolean equals(@Nullable Object obj) {
        if (this == obj) {
            return true;
        }
        if (obj == null) {
            return false;
        }
        if (getClass() != obj.getClass()) {
            return false;
        }
        UDPPacket other = (UDPPacket) obj;
        if (fChecksum != other.fChecksum) {
            return false;
        }
        final Packet child = fChildPacket;
        if (child != null) {
            if (!child.equals(other.fChildPacket)) {
                return false;
            }
        } else {
            if (other.fChildPacket != null) {
                return false;
            }
        }
        if (fDestinationPort != other.fDestinationPort) {
            return false;
        }
        final ByteBuffer payload = fPayload;
        if (payload != null) {
            if (!payload.equals(other.fPayload)) {
                return false;
            }
        } else {
            if (other.fPayload != null) {
                return false;
            }
        }
        if (fSourcePort != other.fSourcePort) {
            return false;
        }
        if (fTotalLength != other.fTotalLength) {
            return false;
        }
        return true;
    }
The UDPPacket class is implemented. We now have the define the UDPEndpoint.
Creating the UDPEndpoint
For the UDP protocol, an endpoint will be its source or its destination port, depending if it is the source endpoint or destination endpoint. Knowing that, we can create our UDPEndpoint class.
We create in our package a new class named UDPEndpoint that extends ProtocolEndpoint. We also add a field: fPort, which contains the source or destination port. We finally add a constructor public ExampleEndpoint(Packet packet, boolean isSourceEndpoint):
- Packet packet: the packet to build the endpoint from.
- boolean isSourceEndpoint: whether the endpoint is the source endpoint or destination endpoint.
We obtain the following unimplemented class:
package org.eclipse.linuxtools.pcap.core.protocol.udp;

import org.eclipse.linuxtools.internal.pcap.core.endpoint.ProtocolEndpoint;
import org.eclipse.linuxtools.internal.pcap.core.packet.Packet;

public class UDPEndpoint extends ProtocolEndpoint {

    private final int fPort;

    public UDPEndpoint(Packet packet, boolean isSourceEndpoint) {
        super(packet, isSourceEndpoint);
        // TODO Auto-generated constructor stub
    }

    @Override
    public int hashCode() {
        // TODO Auto-generated method stub
        return 0;
    }

    @Override
    public boolean equals(Object obj) {
        // TODO Auto-generated method stub
        return false;
    }

    @Override
    public String toString() {
        // TODO Auto-generated method stub
        return null;
    }

}
For the constructor, we simply initialize fPort. If isSourceEndpoint is true, then we take packet.getSourcePort(), else we take packet.getDestinationPort().
    /**
     * Constructor of the {@link UDPEndpoint} class. It takes a packet to get
     * its endpoint. Since every packet has two endpoints (source and
     * destination), the isSourceEndpoint parameter is used to specify which
     * endpoint to take.
     *
     * @param packet
     *            The packet that contains the endpoints.
     * @param isSourceEndpoint
     *            Whether to take the source or the destination endpoint of the
     *            packet.
     */
    public UDPEndpoint(UDPPacket packet, boolean isSourceEndpoint) {
        super(packet, isSourceEndpoint);
        fPort = isSourceEndpoint ? packet.getSourcePort() : packet.getDestinationPort();
    }
Then we implement the methods:
- public int hashCode(): method that returns an integer based on the fields value. In our case, it will return an integer depending on fPort, and the parent endpoint that we can retrieve with getParentEndpoint().
- public boolean equals(Object obj): method that returns true if two objects are equals. In our case, two UDPEndpoints are equal if they both have the same fPort and have the same parent endpoint that we can retrieve with getParentEndpoint().
- public String toString(): method that returns a description of the UDPEndpoint as a string. In our case, it will be a concatenation of the string of the parent endpoint and fPort as a string.
    @Override
    public int hashCode() {
        final int prime = 31;
        int result = 1;
        ProtocolEndpoint endpoint = getParentEndpoint();
        if (endpoint == null) {
            result = 0;
        } else {
            result = endpoint.hashCode();
        }
        result = prime * result + fPort;
        return result;
    }

    @Override
    public boolean equals(@Nullable Object obj) {
        if (this == obj) {
            return true;
        }
        if (!(obj instanceof UDPEndpoint)) {
            return false;
        }

        UDPEndpoint other = (UDPEndpoint) obj;

        // Check on layer
        boolean localEquals = (fPort == other.fPort);
        if (!localEquals) {
            return false;
        }

        // Check above layers.
        ProtocolEndpoint endpoint = getParentEndpoint();
        if (endpoint != null) {
            return endpoint.equals(other.getParentEndpoint());
        }
        return true;
    }

    @Override
    public String toString() {
        ProtocolEndpoint endpoint = getParentEndpoint();
        if (endpoint == null) {
            @SuppressWarnings("null")
            @NonNull String ret = String.valueOf(fPort);
            return ret;
        }
        return endpoint.toString() + '/' + fPort;
    }
Registering the UDP protocol
The last step is to register the new protocol. There are three places where the protocol has to be registered. First, the parser has to know that a new protocol has been added. This is defined in the enum org.eclipse.linuxtools.pcap.core.protocol.PcapProtocol. Simply add the protocol name here, along with a few arguments:
- String longname, which is the long version of name of the protocol. In our case, it is "User Datagram Protocol".
- String shortName, which is the shortened name of the protocol. In our case, it is "UDP".
- Layer layer, which is the layer to which the protocol belongs in the OSI model. In our case, this is the layer 4.
- boolean supportsStream, which defines whether or not the protocol supports packet streams. In our case, this is set to true.
Thus, the following line is added in the PcapProtocol enum:
UDP("User Datagram Protocol", "udp", Layer.LAYER_4, true),
Also, TMF has to know about the new protocol. This is defined in org.eclipse.linuxtools.tmf.pcap.core.protocol.TmfPcapProtocol. We simply add it, with a reference to the corresponding protocol in PcapProtocol. Thus, the following line is added in the TmfPcapProtocol enum:
UDP(PcapProtocol.UDP),
You will also have to update the ProtocolConversion class to register the protocol in the switch statements. Thus, for UDP, we add:
    case UDP:
        return TmfPcapProtocol.UDP;
and
    case UDP:
        return PcapProtocol.UDP;
Finally, all the protocols that could be the parent of the new protocol (in our case, IPv4 and IPv6) have to be notified of the new protocol. This is done by modifying the findChildPacket() method of the packet class of those protocols. For instance, in IPv4Packet, we add a case in the switch statement of findChildPacket, if the Protocol number matches UDP's protocol number at the network layer:
    @Override
    protected @Nullable Packet findChildPacket() throws BadPacketException {
        ByteBuffer payload = fPayload;
        if (payload == null) {
            return null;
        }

        switch (fIpDatagramProtocol) {
        case IPProtocolNumberHelper.PROTOCOL_NUMBER_TCP:
            return new TCPPacket(getPcapFile(), this, payload);
        case IPProtocolNumberHelper.PROTOCOL_NUMBER_UDP:
            return new UDPPacket(getPcapFile(), this, payload);
        default:
            return new UnknownPacket(getPcapFile(), this, payload);
        }
    }
The new protocol has been added. Running TMF should work just fine, and the new protocol is now recognized.
Adding stream-based views
To add a stream-based View, simply monitor the TmfPacketStreamSelectedSignal in your view. It contains the new stream that you can retrieve with signal.getStream(). You must then make an event request to the current trace to get the events, and use the stream to filter the events of interest. Therefore, you must also monitor TmfTraceOpenedSignal, TmfTraceClosedSignal and TmfTraceSelectedSignal. Examples of stream-based views include a view that represents the packets as a sequence diagram, or that shows the TCP connection state based on the packets SYN/ACK/FIN/RST flags. A (very very very early) draft of such a view can be found at https://git.eclipse.org/r/#/c/31054/.
TODO
- Add more protocols. At the moment, only four protocols are supported. The following protocols would need to be implemented: ARP, SLL, WLAN, USB, IPv6, ICMP, ICMPv6, IGMP, IGMPv6, SCTP, DNS, FTP, HTTP, RTP, SIP, SSH and Telnet. Other VoIP protocols would be nice.
- Add a network graph view. It would be useful to produce graphs that are meaningful to network engineers, and that they could use (for presentation purpose, for instance). We could use the XML-based analysis to do that!
- Add a Stream Diagram view. This view would represent a stream as a Sequence Diagram. It would be updated when a TmfNewPacketStreamSignal is thrown. It would be easy to see the packet exchange and the time delta between each packet. Also, when a packet is selected in the Stream Diagram, it should be selected in the event table and its content should be shown in the Properties View. See https://git.eclipse.org/r/#/c/31054/ for a draft of such a view.
- Make adding protocol more "plugin-ish", via extension points for instance. This would make it easier to support new protocols, without modifying the source code.
- Control dumpcap directly from eclipse, similar to how LTTng is controlled in the Control View.
- Support pcapng. See: http://www.winpcap.org/ntar/draft/PCAP-DumpFileFormat.html for the file format.
- Add SWTBOT tests to org.eclipse.linuxtools.tmf.pcap.ui
- Add a Raw Viewer, similar to Wireshark. We could use the “Show Raw” in the event editor to do that.
- Externalize strings in org.eclipse.linuxtools.pcap.core. At the moment, all the strings are hardcoded. It would be good to externalize them all.

