Notice: This Wiki is now read only and edits are no longer possible. Please see: https://gitlab.eclipse.org/eclipsefdn/helpdesk/-/wikis/Wiki-shutdown-plan for the plan.
Linux Tools Project/OProfile/User Guide
Contents
Overview
OProfile is a system-wide Linux profiler, capable of running at low overhead. It consists of a kernel driver and a daemon for collecting raw sample data, along with a suite of tools for parsing that data into meaningful information. OProfile is generally used by developers to determine which sections of code consume the most amount of CPU time, and why.
The OProfile plug-in allows Eclipse users to seamlessly include OProfile capabilities into their development workflow, regardless of their experience in using OProfile. Users with little experience in OProfile can use the One-Click Launch to run a default OProfile view. Experienced users can perform the same OProfile functions they would on the command line, but with a much richer visualization of the results.
For more details on OProfile, visit the project homepage at http://oprofile.sourceforge.net/news/.
Note : The following steps in Installation and Set-Up may not be necessary if installing the Eclipse OProfile plugin from a distribution specific package (eg. .deb, .rpm, etc.). These packages may perform the necessary setup on behalf of the user eliminating the need for steps 1-4. For example, on Fedora, the 'eclipse-oprofile' package automatically configures support for PolicyKit. These steps are also not necessary if using the operf binary for profiling instead of legacy opcontrol.
Installation and Set-Up
The easiest way to install the OProfile plug-in for Eclipse is through the Software Updates and Add-ons menu. For information on how to use this menu, refer to http://wiki.eclipse.org/Linux_Tools_Project/PluginInstallHelp#Installing_Updates_From_the_Linux_Tools_Update_Site.
Unlike most Eclipse plug-ins, the OProfile plug-in requires some configuration after installation. Note that this configuration process takes only a few simple steps, and only needs to be done once.
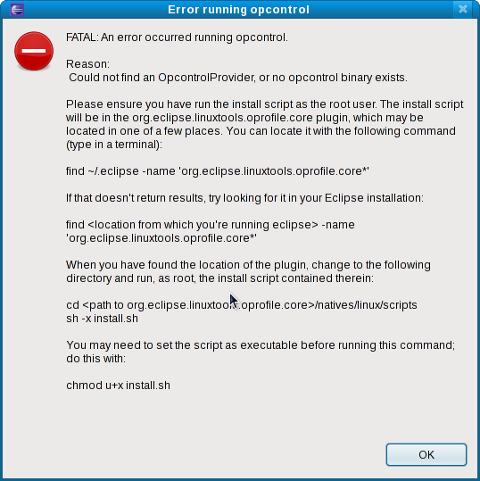
After the plug-in is first installed, performing a profile run with OProfile will bring up a dialog similar to the following:
As the dialog suggests, you must run the supplied install script; this script will allow the OProfile plug-in to perform OProfile tasks as root (since OProfile cannot be run as an unprivileged user). The steps below are the same as the dialog but described in more detail.
To avoid having to perform the installation setup users can create a launch configuration for their project that uses 'operf' instead of 'opcontrol'. Simply navigate to either the Profiling/Profiling Tools launch configuration dialog and create an OProfile launch configuration. Select the OProfile Global Settings tab, and select 'operf' from the 'Profile With' combo box. In future releases, 'operf' will become the default option.
Step 1 - Locate the Installation Scripts
Open up a terminal and locate the natives/linux/scripts subdirectory, which is found in the org.eclipse.linuxtools.oprofile.core plug-in directory. The location of this plug-in directory depends on how you installed Eclipse.
- If you are using a distro-supplied version of Eclipse and installed the plug-in via the update site, the plug-in directory will most likely be under
~/.eclipse. To find the exact location of the plug-in directory in this case, use the following command: find ~/.eclipse -name 'org.eclipse.linuxtools.oprofile.core_*'- Alternatively, if you are using an extracted tarball of Eclipse (i.e. you downloaded a
.tar.gzfrom http://www.eclipse.org/downloads/), then the plug-in will most likely be in thepluginssub-directory of where you extracted it. - For example, if you extracted the tarball to
/home/ksebasti, your Eclipse installation would be in/home/ksebasti/eclipse. In this case, you should use the following command to find the exact location of the plug-in directory: find /home/ksebasti/eclipse -name 'org.eclipse.linuxtools.oprofile.core_*'
Note: In both cases, the quotes (') and asterisk (*) are necessary.
Sample output will look like this:
$ find /home/ksebasti/eclipse -name 'org.eclipse.linuxtools.oprofile.core_*'
/home/ksebasti/eclipse/plugins/org.eclipse.linuxtools.oprofile.core_0.2.0.200904131051
Once you find the plug-in directory, navigate to its natives/linux/scripts subdirectory. Using our previous example:
$ cd /home/ksebasti/eclipse/plugins/org.eclipse.linuxtools.oprofile.core_0.2.0.200904131051/natives/linux/scripts
The natives/linux/scripts subdirectory contains the installation scripts you will need to run in order to allow OProfile to run as root.
Step 2 - Choose Which Installation Script To Run
The natives/linux/scripts subdirectory contains two scripts: install.sh, and install-noconsolehelper.sh. These scripts perform sanity checks to ensure OProfile is installed. The difference is in how root authentication with the plug-in is set up.
-
install.shuses PolicyKit. This is the default and recommended method for root authentication. When an OProfile task is required, you will be presented with a dialog to enter the root password. If PolicyKit is not installed on the system, it is recommended to useinstall-noconsolehelper.shinstead. -
install-noconsolehelper.shcan be used whenPolicyKitis not present on the system. It uses the sudo mechanism and a small wrapper script. The install script will describe the text which should be written in thesudoersfile, then run the commandvisudoto edit it.
Warning: Thesudoersfile is a sensitive system file and altering it in other ways may lead to system instability. Only users with enough knowledge of running a Linux system should use this method. For these reasons, this method of root authentication is discouraged. However, it may be the only option available to some users and it has been tested to work by developers and users of the plug-in.
Step 3 - Running The Install Script
Once you have selected an install script, log in as root. Assuming you are in the natives/linux/scripts subdirectory of the plug-in directory (as in Step 1 - Locate the Installation Scripts), run your selected install script:
# ./install.sh
Successful output will look like this:
./install.sh
Eclipse-OProfile plugin install successful.
Install scripts should be run as the root user since these scripts perform some actions that require elevated privileges: install.sh uses PolicyKit, and install-noconsolehelper.sh runs the command visudo. If you wish to simply run either install script without logging in as root, use:
su -c './install.sh'
This command will run only the install script as the root user, then return control to the regular user. Note that you will still need to enter the root password to make this work. If you receive an error message, refer to the Troubleshooting section.
Step 4 - Restart Eclipse
After running the install script, restart Eclipse using File > Restart.
If you need to uninstall the plug-in, run the uninstall script that corresponds to the install script used. For example, if you used install.sh, you would run uninstall.sh before uninstalling it from within Eclipse. These scripts are also located in the natives/linux/scripts subdirectory of the OProfile core plug-in directory (i.e. the same directory where the install scripts are found).
Launching A Profile
The purpose of the OProfile plug-in is to provide useful profile information in a user-friendly manner. To do this, it first gathers the required information. The plug-in hooks into the Eclipse and CDT's launching facilities; in doing so, profiling becomes as easy as a normal run of your program.
During a profile run, the OProfile plug-in will start, stop and perform other OProfile tasks in the background as needed, while the binary being profiled runs as normal. Currently, it is possible to start profiling when a user binary is run and stop after the binary has returned as well as the ability to start/stop profiling at arbitrary times.
One-Click Launch
Most users are interested in profiling where a program spends the most CPU time during execution. The OProfile plug-in for Eclipse includes a one-click launch feature which profiles this. The one-click launch sets appropriate defaults for a profile configuration using the execution time event, and launches the profile with no further required user intervention.
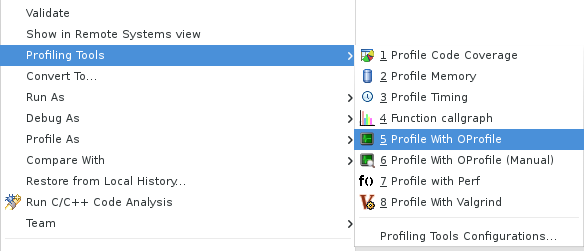
To use the one-click launch, right click on the project, the binary or in an open editor for a source file belonging to that project. Here there are two ways to start a launch:
Navigating to Profiling Tools and clicking Profile With OProfile
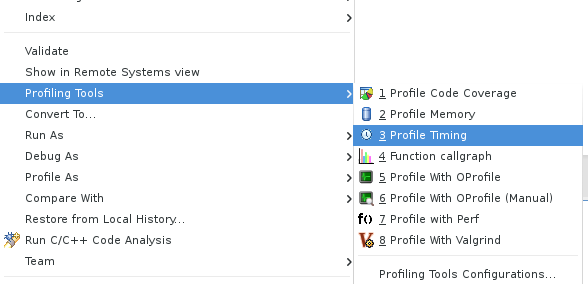
or navigating to Profiling Tools, clicking on Profile Timing and setting the timing tools to be Oprofile.
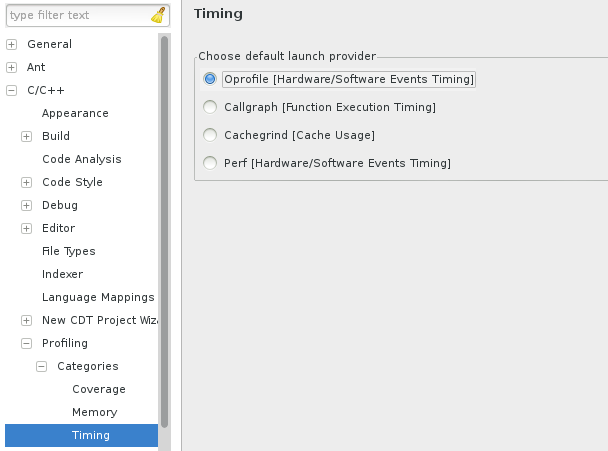
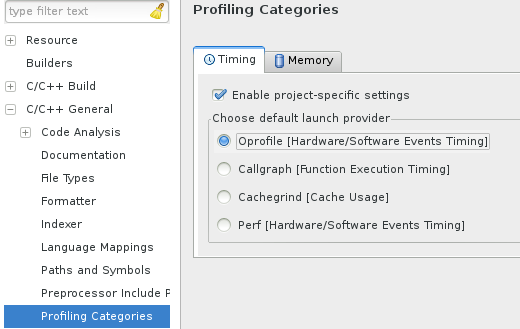
To properly set the preferences you can go to C/C++->Profiling->Categories->Timing and set the default timing tool to be Oprofile.
Alternatively, you can set project specific preferences which override workspace preferences by using project Properties->C/C++ General->Profiling Categories->Timing.
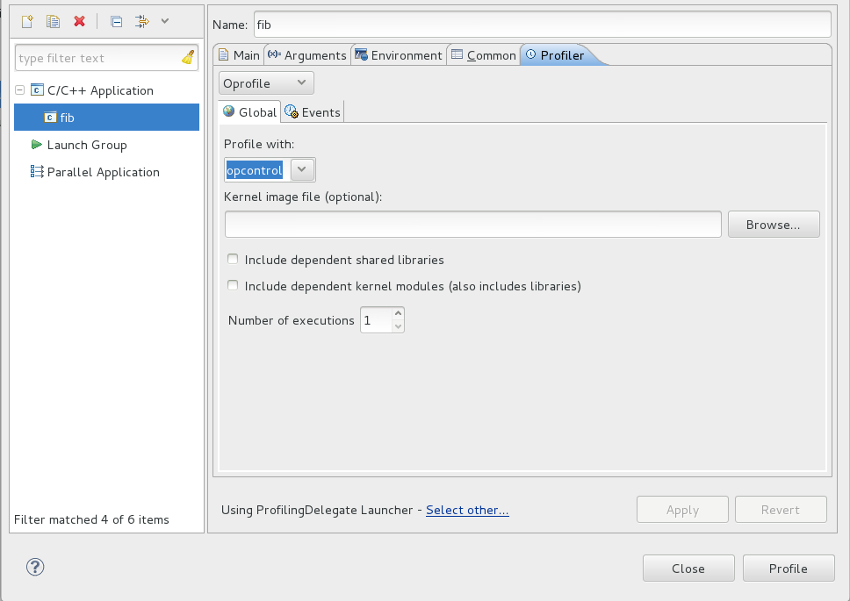
You can also profile your application using Profile as...->Local C/C++ Application whereby you have set the profiling tool in the Profiler tab to be Oprofile.
Launching a Customized Profile
The OProfile plug-in allows you to configure a profile run using several available OProfile options. These options are exposed via the launch configuration in a user-friendly manner, allowing for a more complex profile.
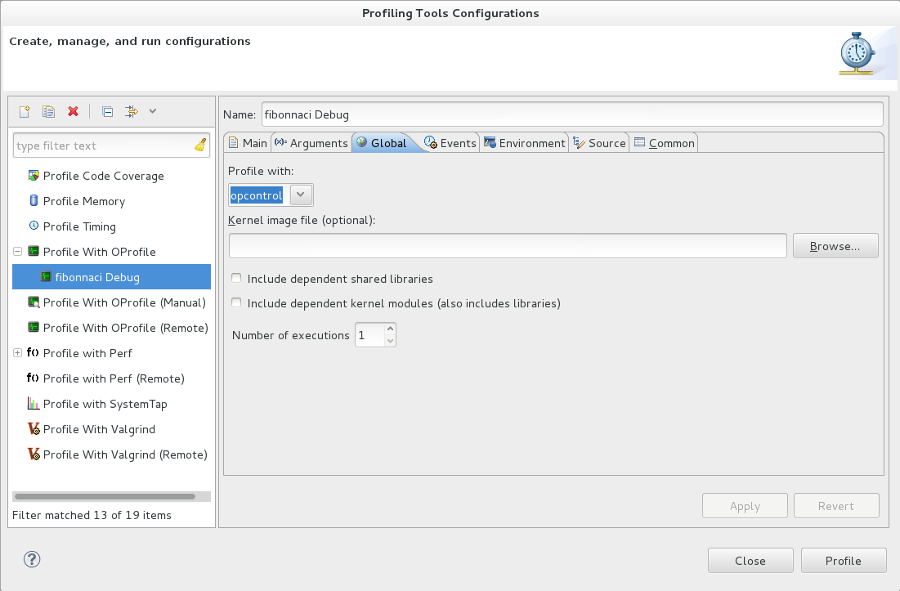
To customize a profile, right click on the project, the binary or in an open editor for a source file belonging to that project. Then, navigate to Profiling Tools > Profile Configurations... to open the Profile Configurations menu. Refer to the Profiling Configuration section for more information about configuring a profile.
After configuring a profile, click the Profile button to launch the profile.
Manual Profile
As of the 0.3.0 release, users can profile their applications in two ways: an automatic or manual profile. Automatic is the previously described method whereby the OProfile daemon is started before the binary is launched and stopped after the binary returns. A manual profile configures the daemon with the appropriate settings, but instead a control dialog is available which the user can use to start or stop the OProfile daemon at will. Each mode has their own configuration type and icon, as to disambiguate the type of profile an entry in the profile history. A feedback list in the dialog assures the user that the operations have been received, since at times an operation may take a few seconds to complete. This feature is most useful to profile applications which halt on input, or large applications for which it is undesirable to launch and return several times. It is not recommended to use this feature to only profile when you believe your application is spending time; the statistical nature of OProfile will account for this.
The basic workflow to run manual OProfile is
- Profile -> Profile with OProfile (Manual)
- On control dialog, hit "Start Daemon"
- Run the application binary
- On control dialog, hit "Refresh View" (Oprofile view should be refreshed with profiling data)
- On control dialog, hit "Stop Daemon"
Profiling Configuration
OProfile has many configuration options, the amount of which can be overwhelming. For more information about these options, refer to http://oprofile.sourceforge.net/doc/controlling-daemon.html. The Profile Configurations menu provided by the OProfile plug-in aims to make relevant, commonly-used OProfile configuration options easily accessible to users of all experience levels. Currently, the Profile Configurations menu provides two configuration tabs to the standard CDT launch configuration: Global Settings and Event Configuration.
Since Linux Tools 2.1, the Oprofile plug-in supports opcontrol and operf as profiling tools. Both of them are explained as follows.
Operf vs Opcontrol
Legacy OProfile consists of the opcontrol shell script for configuring, starting, and stopping a profiling session. To this purpose, a kernel driver (usually built as a kernel module) is used for collecting samples, which are recorded into sample files. A disadvantage of this mode is the necessity of elevated user privileges to run opcontrol.
Operf was designed to be used in place of opcontrol for profiling. It uses the Linux Performance Events Subsystem, and therefore, does not require the use of the opcontrol daemon or any elevated privileges. The use of operf and opcontrol are mutually exclusive.
Global Settings
The Global Settings tab configures which profiling binary is going to be used (operf or opcontrol) and how the OProfile daemon gathers profiling information. Each option is described below.
- Profile with
- user can select opcontrol or operf as profiling tools.
- Kernel Image File (optional)
- To collect more detailed information about the operation of a program in the Linux kernel, use the Browse button specify the location of your running kernel's
vmlinuxfile. A kernel'svmlinuxfile contains debugging information required by OProfile. Note that the compressed vmlinux file, often namedvmlinuz, cannot be used for this purpose.
Note: For this option to have any effect, you must enable the Include dependent kernel modules option.
- Include dependent shared libraries
- This option will make OProfile include samples from shared libraries that are used by the profiled binary/program. These samples will then be aggregated in the profile results. This is performed by default when using operf.
- Include dependent kernel modules
- This option will make OProfile include samples related to running in the kernel. If the
vmlinuxfile is specified, the profile will include details of the specific kernel modules in use. Otherwise, kernel samples will be grouped under the nameno-vmlinux. Operf by default separates kernel samples per application.
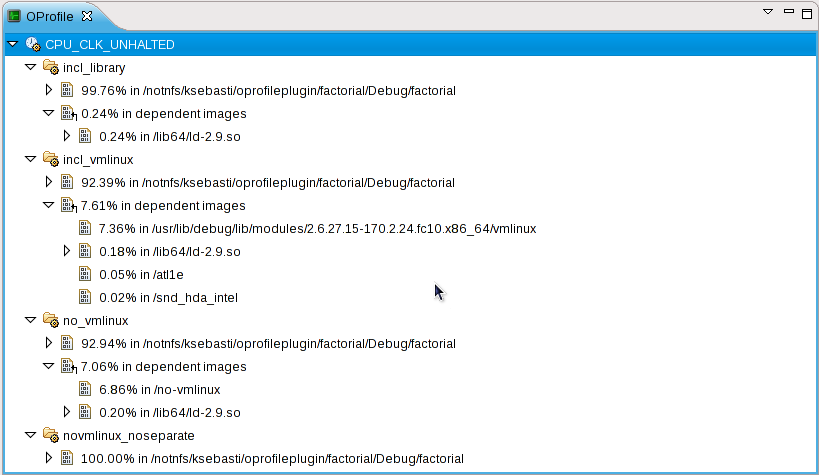
The differences between the options are illustrated in the following OProfile view screenshot:
-
incl_librarywas run with only the Include dependent shared libraries checked -
incl_vmlinuxwas run with thevmlinuxfile specified; both Include dependent shared libraries and Include dependent kernel modules checked -
no_vmlinuxwas run without anyvmlinuxfile specified; both Include dependent shared libraries and Include dependent kernel modules checked -
novmlinux_noseparatewas run with none of the options checked
Event Configuration
Your system processor's hardware profiling registers often contain a large number of options. The Event Configuration tab condenses these options to a more manageable amount.
Timer Interrupt Mode
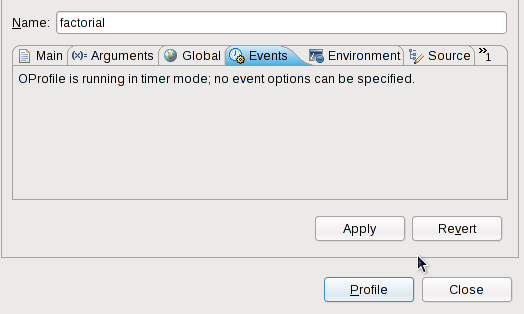
If your processor (or kernel) does not support the hardware profiling registers OProfile uses, OProfile will run in timer-interrupt mode. This mode has no user-configurable events. For more information about timer-interrupt mode, refer to http://oprofile.sourceforge.net/doc/detailed-parameters.html#timer.
The event configuration tab will then look like the screenshot below:
Regular Mode
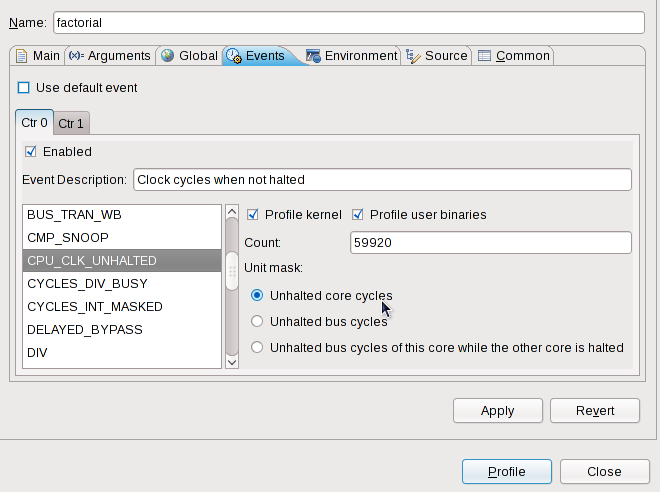
If your processor (or kernel) supports hardware profiling registers, there are several configuration options available to you. The availability of these configuration options depend on your processor model or kernel version. With proper support, the Events configuration tab will look like the following screenshot:
In regular mode, the Events configuration tab can contain any of the following options:
- Use default event
- This option is enabled by default when creating a new profile configuration, or when a profile configuration is created through the one-click launch. Use default event is a shortcut to use an event based on processor execution time, with a reasonable value for the Count option. Using this option will prevent you from configuring the counters any further.
For a list of default events for various processors, refer to [1].
- Counter Tabs (Ctr 0, Ctr 1, Ctr 2, and so on)
- A processor may have 1 to 8 hardware profiling registers (also called counters). Each one may be programmed separately to profile many events simultaneously. Each tabs labelled Ctr represents one counter and exposes the same options.
- Enabled
- This option (located in each counter tab) disables or enables a counter.
- Event List
- A list of the events available for profiling on a given counter.
- Event Description
- When you select an event from the events list, this field provides a short description of that event's function. OProfile provides the content for this field.
- Profile Kernel and Profile user binaries
- Instructs OProfile to profile binaries in the selected spaces. Keeping both checked is recommended (even if other Global Settings are not specified).
- Count
- Specifies a reset count for the hardware counter. In most cases, the default value (based on the CPU clock frequency) is sufficient. Each event has a minimum value, but it is recommended to use a value many orders of magnitude larger.
WARNING: if you specify a value that is too low, the profiled program may take much longer to return or your system may hang.
- Unit Mask
- Many events have a unit mask which allows further narrowing of the scope of the event. If in doubt, use the default value (specified by OProfile). There are three types of unit masks:
- Mandatory -- no selection necessary; a single required value
- Exclusive -- several possible values; a single required value
- Bitmask -- several possible values; a combination of several values
OProfile View
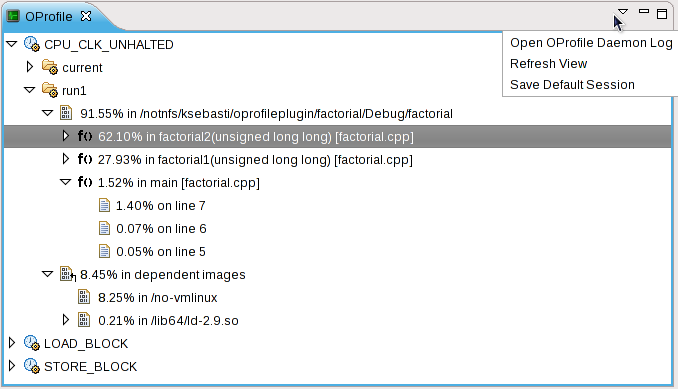
The OProfile view is the central point of interaction of the plug-in with the results of profiling.
The tree structure displayed above describes one or more profiles of one or more events in the following manner:
-
 Events -- the name of the profiling event used by OProfile (e.g.
 CPU_CLK_UNHALTED)-
 Session -- the name of the session the profile is stored in (e.g.
 run1)
-
If source code is not available, some symbols (including source file name) may be shown, but no samples. This is normally the case with programs that use shared libraries. Also, depending on the Global Settings, a profile may have no dependent images.
Note that after Eclipse is restarted, there will be no data shown in the OProfile view. Data from past profiles will still be on the system, if not touched otherwise, and can be re-read with the Refresh View menu action (refer to the View Menu section for more details).
Features
This section describes the features of the plug-in exposed through the view.
View Tree
Double-clicking on a ![]() sample will open the source file in an editor and place the insertion point at the corresponding line in code.
sample will open the source file in an editor and place the insertion point at the corresponding line in code.
Note: For this to work, the source code must be available and it must be in the correct directory (as described in the debug info of the binary).
View Menu
- Open OProfile Daemon Log
- This will launch a dialog showing the contents of the OProfile daemon log.
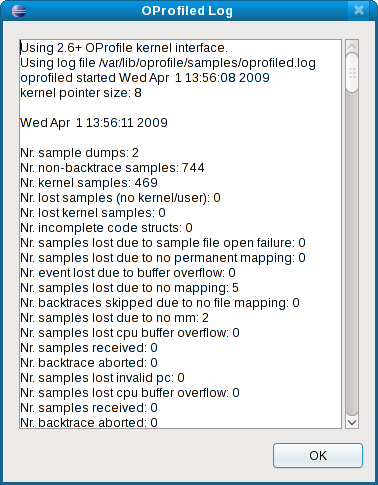
By default, the OProfile daemon log is in/var/lib/oprofile/samples/oprofiled.log
- Refresh View
- This will re-read the OProfile data on the system, re-create the internal data model and re-display the profile tree. Doing so allows you to display data already on the system without launching a profile (e.g. when Eclipse first starts up).
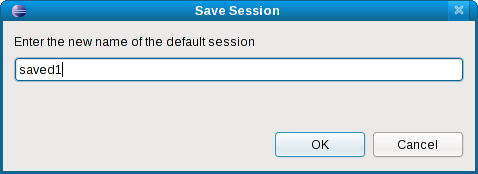
- Save Default Session
- The default session, named
current, is overwritten on each launch of a profile if it is not saved. If you wish to keep a profile for later viewing, this menu action will allow you to save the session to a different name.
Since the samples are in a system directory, this operation requires root privileges; hence, you will be prompted for the root password. The Save Session dialog is shown below:
Remote OProfile
The OProfile plug-in allows profiling a project stored in a remote machine. This can be particularly useful when developing an application for a different architecture.
Set-up
The remote OProfile plug-in doesn't have installation scripts, but requires some setup in the remote machine. First, the remote machine's user must be able to run OProfile as root. For this, log in the remote machine as root and edit the /etc/sudoers file to add the following line:
<user> ALL=(ALL) NOPASSWD: <linux-tools-path>/opcontrol
Where:
- <user> - Remote machine's user
- <linux-tools-path> - Path for linux tools set for the project. The default is /usr/bin. This path can be modified by right-clicking the remote project, clicking in "Properties" and choosing the "Linux Tools Path" tab.
Also make sure that following line is not present or commented out:
Defaults requiretty
This is necessary for running a remote command using sudo.
Launching A Remote Profile
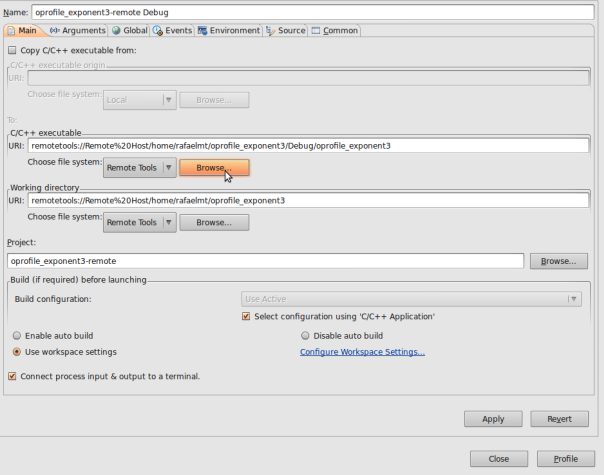
To run OProfile remotely, right-click the project and navigate to "Profiling Tools", then to "Profile Configurations". (Note: there's no One-click launch for remote OProfile). In the new window, double-click the Profile with OProfile (remote) profile configuration.
In the main tab, choose the binary that will be profiled by clicking the "Browse" button under "C/C++ executable".
The same Event Configuration Event Configuration options for regular OProfile apply for remote OProfile as well.
After configuring the profile, click the Profile button to launch the profile. The same OProfile View as the local one will show the results.
Example Project
If you wish to try the documented steps in this article with a test project, you can download the same sample project used to create the screenshots at the following link:
http://wiki.eclipse.org/images/7/77/Eclipse-oprofile_testproj_factorial.zip
To import the project into the Eclipse workspace, navigate to File > Import > General > Existing Projects into Workspace. Then, choose Select archive file and use the Browse button to point to the location of the sample project on your file system.
Troubleshooting
Various problems and their solutions are described here. If you encounter a problem not described here, please file a bug.
Install Script Errors
This section describes different errors that could occur from running the install scripts (i.e. install.sh or install-noconsolehelper.sh)
Error: script must be run as the root user
You attempted to run the script as an ordinary, non-root user. You must be the root user to run the install script, as the scripts edit files located in root-owned directories.
Solution: Run the command su - to become the root user, or run the script as the root user with su -c './install.sh'.
Error: script must be run with pwd in script dir
Your current working directory must be the natives/linux/scripts subdirectory of the OProfile core plug-in; running the script relative from another location will not work.
Solution: Simply follow the steps on Step 1 - Locate the Installation Scripts to find the natives/linux/scripts subdirectory of the OProfile core plug-in.
Error: required binaries do not exist, OProfile not installed?
The OProfile plug-in could not find the oprofiled and opcontrol binaries. This could mean they are not in their default directory (/usr/bin), or they do not exist at all.
Solution: If the binaries are on your system (and in your PATH) but not in those directories, you can either remove these checks from the install script or create symlinks in the /usr/bin directory. Of course, if the binaries do not exist on your system, then install the oprofile package.
Error: /usr/bin/pkexec does not exist
You ran the install.sh script, but pkexec which is provided by PolicyKit was not installed on your system.
As described in Step 2 - Choose Which Installation Script To Run, if PolicyKit is not installed, then you can use the install-noconsolehelper.sh script.
Solution: Run the install-noconsolehelper.sh script instead.
install.sh: line 47: opcontrol: Permission denied
The opcontrol wrapper file could not be created. This can occur if the natives/linux/scripts subdirectory is located on an NFS mount; the NFS server will not allow the local root user to create files in the directory.
Solution: After seeing the error mentioned run the following commands from the commandline :
echo '#!/bin/sh' > opcontrol || exit 1
echo 'exec pkexec /usr/bin/opcontrol ${1+"$@"}' >> opcontrol
chmod +x ./opcontrol
No Samples From A Profile
It is possible for a profile run of a program to return no samples, resulting in no current session displayed. This is not always indicative of a problem with either OProfile or the profiled program. OProfile is a system-wide profiling tool; hence, other active processes running on your system may overshadow your program. This is particularly true if the profiled program is not CPU intensive.
In addition, the Event you choose (selected through the Events tab, as described in Regular Mode) could cause a profile to return no samples; for example the event BR_CND_MISSP_EXEC will only provide samples if a branch was mispredicted by the processor. Note also that due to the statistical nature of OProfile, profiling is neither deterministic nor consistent; two subsequent runs may output very different results. In some cases, one run can result in no samples, while another run on the same program can result in many samples. The OProfile online documentation has other useful information here.
Solution: The following suggestions could help you generate more samples from a profile run:
- run your program with a larger input
- halt or kill as many other non-essential processes as possible
- reduce the Count in the Event Configuration tab
- launch a profile several times
If you are unsure whether your configuration is working correctly, try profiling the sample project in the Example Project section.
Log Reader Hangs
If the OProfile daemon log file is too large, the log reader may hang and possibly cause the OProfile plug-in to crash. This occurs when the verbosity option is set to all, which results in several hundred MiB of text in the log over several profile runs. If you do require all this data in the log file, do not launch the log reader. Delete or backup the log file before running the log reader again.
Using PolicyKit with X/VNC
When using an X/VNC viewer, PolicyKit may open the authentication dialog in the wrong display. If using this setup, please make sure to connect your VNC viewer to the main display.

