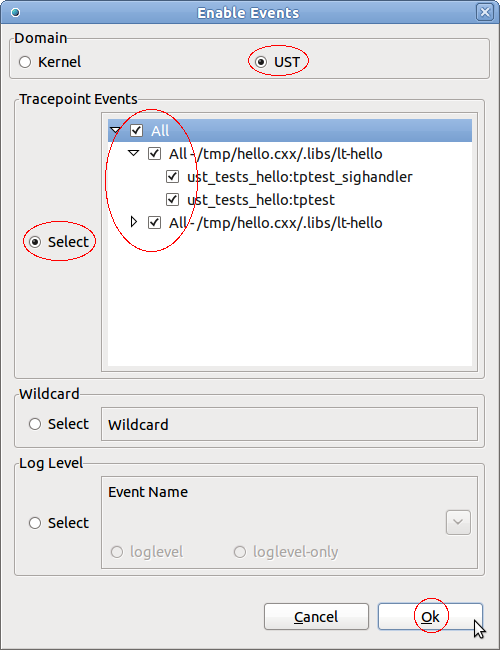
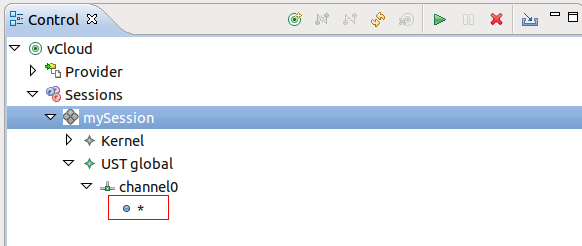
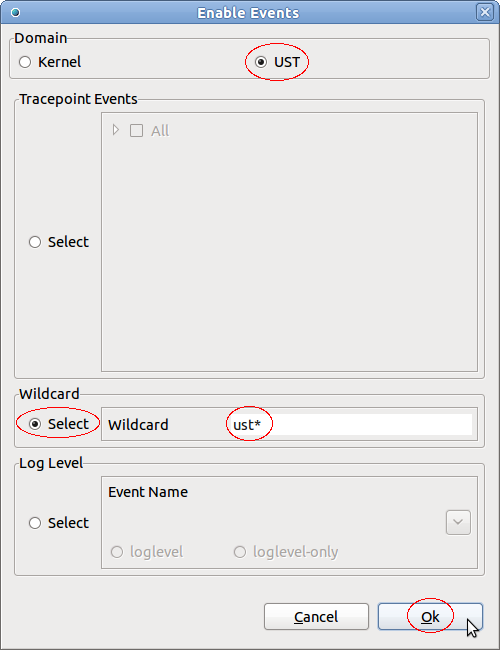
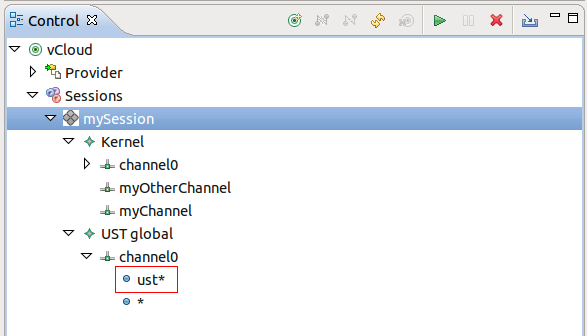
Notice: This Wiki is now read only and edits are no longer possible. Please see: https://gitlab.eclipse.org/eclipsefdn/helpdesk/-/wikis/Wiki-shutdown-plan for the plan.
Linux Tools Project/LTTng2/User Guide
Contents
- 1 Overview
- 2 Installation
- 3 LTTng
- 3.1 Tracing Perspective
- 3.2 Project View
- 3.2.1 Creating a Tracing Project
- 3.2.2 Importing Traces to the Project
- 3.2.3 Trace Package Exporting and Importing
- 3.2.4 Selecting a Trace Type
- 3.2.5 Opening a Trace or Experiment
- 3.2.6 Creating a Experiment
- 3.2.7 Selecting Traces for an Experiment
- 3.2.8 Removing Traces from an Experiment
- 3.2.9 Renaming a Trace or Experiment
- 3.2.10 Copying a Trace or Experiment
- 3.2.11 Deleting a Trace or Experiment
- 3.2.12 Deleting Supplementary Files
- 3.2.13 Link with Editor
- 3.3 Events Editor
- 3.4 Histogram View
- 3.5 Statistics View
- 3.6 Colors View
- 3.7 Filters View
- 3.8 Time Chart View
- 3.9 State System Explorer View
- 3.10 Custom Parsers
- 4 LTTng Tracer Control
- 4.1 Control View
- 4.1.1 Creating a New Connection to a Remote Host
- 4.1.2 Disconnecting from a Remote Host
- 4.1.3 Connecting to a Remote Host
- 4.1.4 Deleting to a Remote Host Connection
- 4.1.5 Creating a Tracing Session
- 4.1.6 Creating a Tracing Session With Advanced Options
- 4.1.7 Creating a Snapshot Tracing Session
- 4.1.8 Creating a Live Tracing Session
- 4.1.9 Enabling Channels - General
- 4.1.10 Enabling Channels On Session Level
- 4.1.11 Configuring Trace File Rotation
- 4.1.12 Configuring per UID and per PID Buffers (UST only)
- 4.1.13 Configuring Periodical Flush for metadata Channel
- 4.1.14 Enabling Channels On Domain Level
- 4.1.15 Enabling and Disabling Channels
- 4.1.16 Enabling Events - General
- 4.1.17 Enabling Kernel Events On Session Level
- 4.1.18 Enabling UST Events On Session Level
- 4.1.19 Enabling Events On Domain Level
- 4.1.20 Enabling Events On Channel Level
- 4.1.21 Enabling and Disabling Events
- 4.1.22 Enabling Tracepoint Events From Provider
- 4.1.23 Configuring Filter Expression On UST Event Fields
- 4.1.24 Adding Contexts to Channels and Events of a Domain
- 4.1.25 Adding Contexts to All Events of a Channel
- 4.1.26 Adding Contexts to an Event of a Specific Channel
- 4.1.27 Start Tracing
- 4.1.28 Recording a Snapshot
- 4.1.29 Stop Tracing
- 4.1.30 Destroying a Tracing Session
- 4.1.31 Refreshing the Node Information
- 4.1.32 Quantifing LTTng overhead (Calibrate)
- 4.1.33 Importing Session Traces to a Tracing Project
- 4.1.34 Importing Network Traces to a Tracing Project
- 4.2 Properties View
- 4.3 LTTng Tracer Control Preferences
- 4.1 Control View
- 5 LTTng Kernel Analysis
- 6 LTTng-UST Analyses
- 7 Trace synchronization
- 8 Time offsetting
- 9 Timestamp formatting
- 10 Data driven analysis
- 11 Limitations
- 12 How to use LTTng to diagnose problems
- 13 References
- 14 Updating This Document
Overview
LTTng (Linux Trace Toolkit, next generation) is a highly efficient tracing tool for Linux that can be used to track down kernel and application performance issues as well as troubleshoot problems involving multiple concurrent processes and threads. It consists of a set of kernel modules, daemons - to collect the raw tracing data - and a set of tools to control, visualize and analyze the generated data. It also provides support for user space application instrumentation. For more information about LTTng, refer to the project site
Note: This User Guide covers the integration of the latest LTTng (up to v2.4) in Eclipse.
About Tracing
Tracing is a troubleshooting technique used to understand the behavior of an instrumented application by collecting information on its execution path. A tracer is the software used for tracing. Tracing can be used to troubleshoot a wide range of bugs that are otherwise extremely challenging. These include, for example, performance problems in complex parallel systems or real-time systems.
Tracing is similar to logging: it consists in recording events that happen in a system at selected execution locations. However, compared to logging, it is generally aimed at developers and it usually records low-level events at a high rate. Tracers can typically generate thousands of events per second. The generated traces can easily contain millions of events and have sizes from many megabytes to tens of gigabytes. Tracers must therefore be optimized to handle a lot of data while having a small impact on the system.
Traces may include events from the operating system kernel (IRQ handler entry/exit, system call entry/exit, scheduling activity, network activity, etc). They can also consists of application events (a.k.a UST - User Space Tracing) or a mix of the two.
For the maximum level of detail, tracing events may be viewed like a log file. However, trace analyzers and viewers are available to derive useful information from the raw data coupled with knowledge of the traced program. These programs must be specially designed to handle quickly the enormous amount of data a trace may contain.
LTTng integration
The LTTng plug-in for Eclipse provides an Eclipse integration for the control of the LTTng tracer as well as fetching and visualization of the traces produced. It also provides the foundation for user-defined analysis tools.
The LTTng Eclipse plug-in provides the following views:
- Project - an extension to the standard Eclipse Project view tailored for tracing projects
- Control - to control the tracer and configure the tracepoints
- Events - a versatile view that presents the raw events in tabular format with support for searching, filtering and bookmarking
- Statistics - a view that that provides simple statistics on event occurrences by type
- Histogram - a view that displays the event density with respect to time in traces
These views can be extended or tailored for specific trace types (e.g. kernel, HW, user app).
At present, the LTTng Eclipse plug-in for Eclipse supports the following kernel-oriented views:
- Control Flow - to visualize processes state transitions
- Resources - to visualize system resources state transitions
- CPU usage - to visualize the usage of the processor with respect to the time in traces
It also supports the following User Space traces views:
- Memory Usage - to visualize the memory usage per thread with respect to time in the traces
- Call Stack - to visualize the call stack's evolution over time
Although the control and fetching parts are targeted at the LTTng tracer, the underlying framework can also be used to process any trace that complies with the Common Trace Format (CTF). CTF specifies a very efficient and compact binary trace format that is meant to be application-, architecture-, and language-agnostic.
Features
The LTTng Eclipse plug-in has a number of features to allow efficient handling of very large traces (and sets of large traces):
- Support for arbitrarily large traces (larger than available memory)
- Support for correlating multiple time-ordered traces
- Support for zooming down to the nanosecond on any part of a trace or set of traces
- Views synchronization of currently selected time or time range, and window time range
- Efficient searching and filtering of events
- Support for trace bookmarks
- Support for importing and exporting trace packages
There is also support for the integration of non-LTTng trace types:
- Built-in CTF parser
- Dynamic creation of customized parsers (for XML and text traces)
- Dynamic creation of customized state systems (from XML files)
- Dynamic creation of customized views (from XML files)
Installation
This section describes the installation of the LTTng tracer and the LTTng Eclipse plug-ins as well as their dependencies.
LTTng Tracer
While the Eclipse plug-ins can run on the standard Eclipse platforms (Linux, Mac, Windows), the LTTng tracer and its accompanying tools run on Linux.
The tracer and tools have been available for download in Ubuntu since 12.04. They can easily be installed with the following command:
> sudo apt-get install lttng-tools
For other distributions, older Ubuntu distributions, or the latest, bleeding edge LTTng tracer, please refer to the LTTng website for installation information.
Note: The LTTng tracer (and accompanying tools) is required only if you want to create your own traces (the usual case). If you intend to simply analyze existing traces then it is not necessary to install the tracer.
LTTng Eclipse Plug-ins
The easiest way to install the LTTng plug-ins for Eclipse is through the Software Updates and Add-ons menu. For information on how to use this menu, refer to this link.
The LTTng plug-ins are structured as a stack of features/plug-ins as following:
- CTF - A CTF parser that can also be used as a standalone component
- Feature: org.eclipse.linuxtools.ctf
- Plug-ins: org.eclipse.linuxtools.ctf.core, org.eclipse.linuxtools.ctf.parser
- State System Core - State system for TMF
- Plug-ins: org.eclipse.linuxtools.statesystem.core
- TMF - Tracing and Monitoring Framework a framework for generic trace processing
- Feature: org.eclipse.linuxtools.tmf
- Plug-ins: org.eclipse.linuxtools.tmf.core, org.eclipse.linuxtools.tmf.ui. org.eclipse.linuxtools.tmf.analysis.xml.core, org.eclipse.linuxtools.tmf.analysis.xml.ui
- CTF support for TMF - CTF support for the TMF Feature
- Feature: org.eclipse.linuxtools.tmf.ctf
- Plug-ins: org.eclipse.linuxtools.tmf.ctf.core
- LTTng - The wrapper for the LTTng tracer control. Can be used for kernel or application tracing.
- Feature: org.eclipse.linuxtools.lttng2.control
- Plug-ins: org.eclipse.linuxtools.lttng2.control.core, org.eclipse.linuxtools.lttng2.control.ui
- LTTng Kernel - Analysis components specific to Linux kernel traces
- Feature: org.eclipse.linuxtools.lttng2.kernel
- Plug-ins: org.eclipse.linuxtools.lttng2.kernel.core, org.eclipse.linuxtools.lttng2.kernel.ui
- LTTng UST - Analysis components specific to Linux userspace traces
- Feature: org.eclipse.linuxtools.lttng2.ust
- Plug-ins: org.eclipse.linuxtools.lttng2.ust.core, org.eclipse.linuxtools.lttng2.ust.ui
LTTng Eclipse Dependencies
The Eclipse LTTng controls the LTTng tracer through an ssh connection, if the tracer is running locally it can use or bypass the ssh connection.
Therefore, the target system (where the tracer runs) needs to run an ssh server as well as sftp server (for file transfer) to which you have permission to connect.
On the host side (where Eclipse is running), you also need to have Eclipse Remote Services installed to handle the SSH connection and transport. The Remote Services can be installed the standard way (Help > Install New Software... > General Purpose Tools > Remote Services).
Installation Verification
If you do not have any, sample LTTng traces can be found here [1]. At the bottom of the page there is a link to some sample LTTng 2.0 kernel traces. The trace needs to be uncompressed to be read.
Here are the quick steps to verify that your installation is functional:
- Start Eclipse
- Open the LTTng perspective
- Create a Tracing project
- Right-click in the Project view and select "New Project"
- Enter the name of your project (e.g. "MyLTTngProject")
- The project will be created. It will contain 2 empty folders: "Traces" and "Experiments"
- Open a sample trace
- Right-click on the newly created project "Traces" folder and select "Open Trace..."
- Navigate to the sample LTTng trace that you want to visualize and select any file in the trace folder
- The newly imported trace should appear under the Traces folder
- Visualize the trace
- Expand the Traces folder
- Double-click on the trace
- The trace should load and the views be populated
If an error message is displayed, you might want to double-check that the trace type is correctly set (right-click on the trace and "Select Trace Type...").
Refer to Tracing Perspective for detailed description of the views and their usage.
LTTng
Tracing Perspective
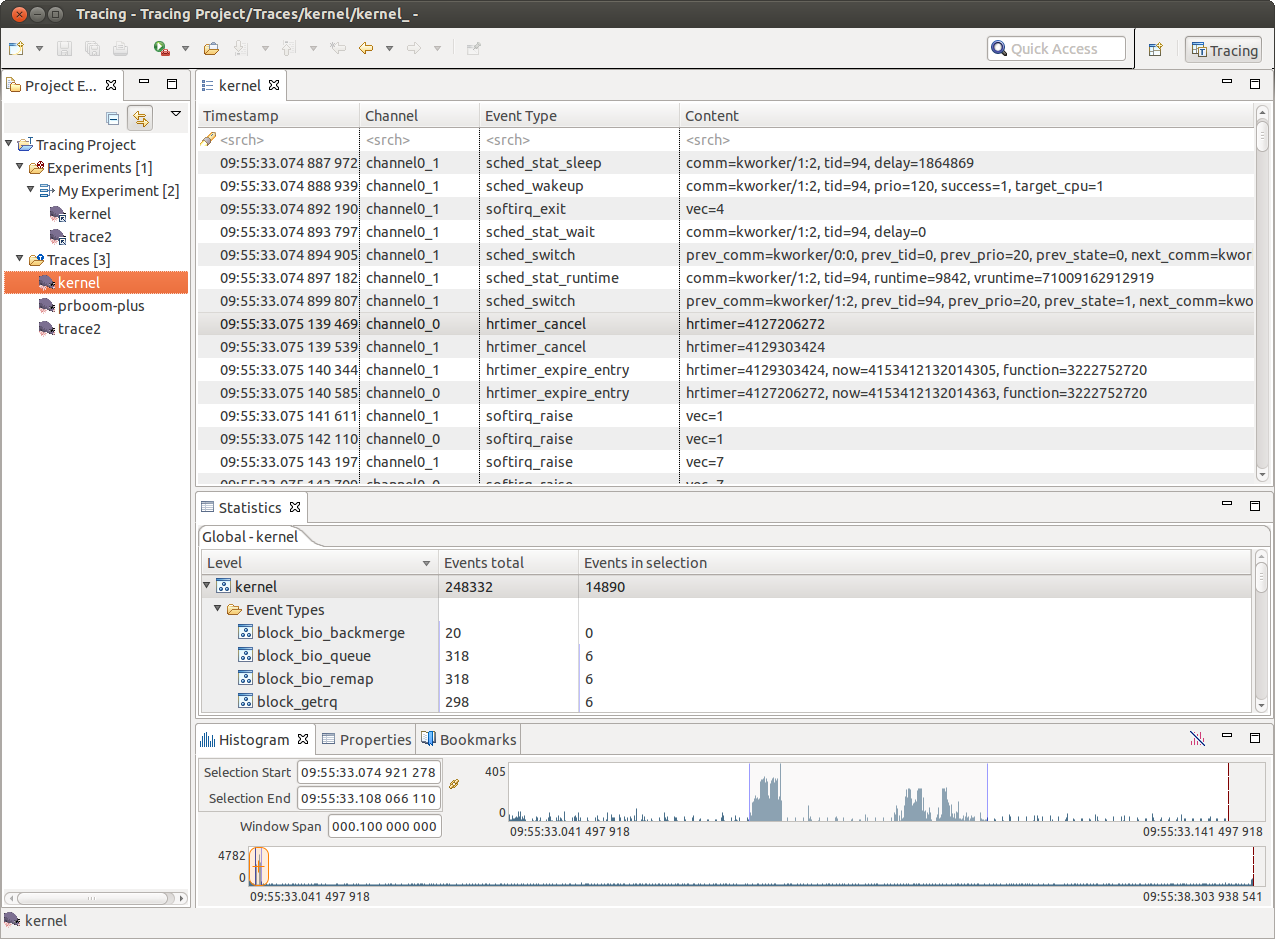
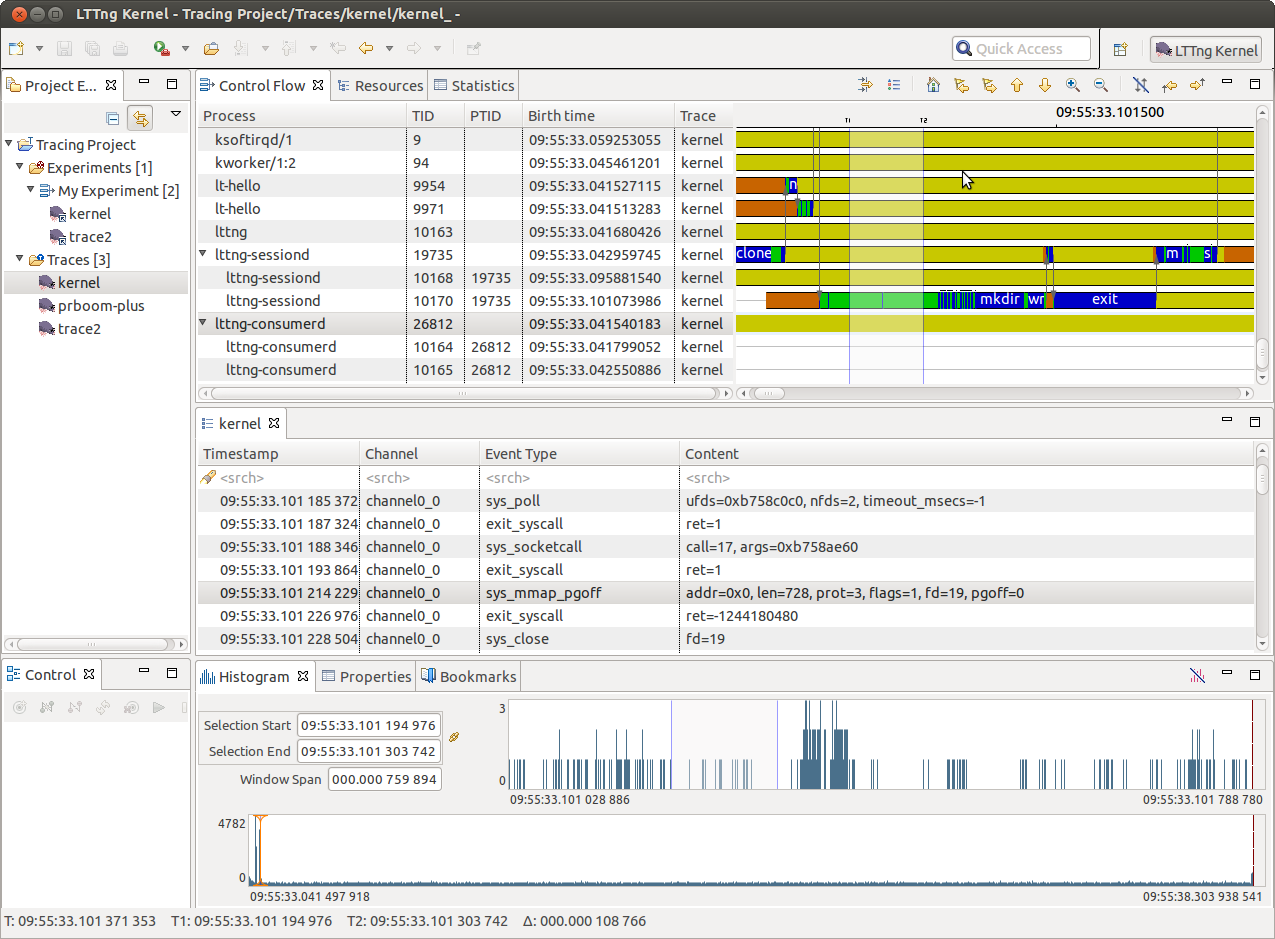
The Tracing perspective is part of the Tracing and Monitoring Framework (TMF) and groups the following views:
The views are synchronized i.e. selecting an event, a timestamp, a time range, etc will update the other views accordingly.
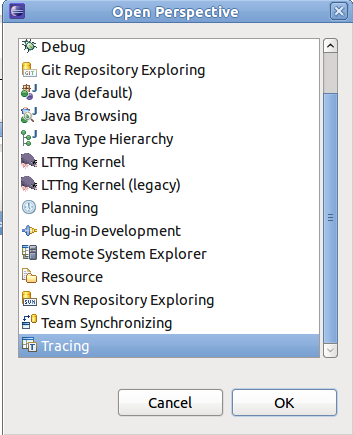
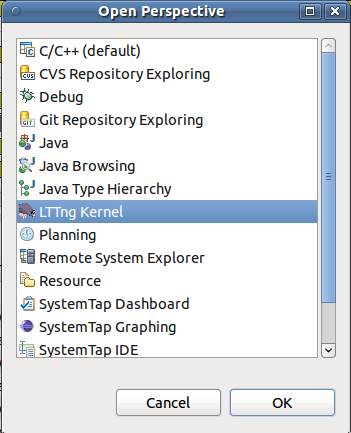
The perspective can be opened from the Eclipse Open Perspective dialog (Window > Open Perspective... > Other).
In addition to these views, the Tracing and Monitoring Framework (TMF) feature provides a set of generic tracing specific views, such as:
The framework also supports user creation of Custom Parsers.
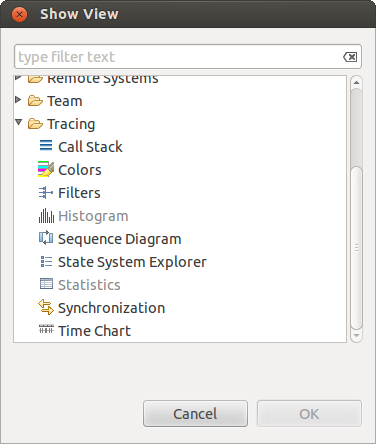
To open one of the above Tracing views, use the Eclipse Show View dialog (Window > Show View > Other...). Then select the relevant view from the Tracing category.
Additionally, the LTTng feature provides an LTTng Tracer Control functionality. It comes with a dedicated Control View.
Project View
The project view is the standard Eclipse Project Explorer. Tracing projects are well integrated in the Eclipse's Common Navigator Framework. The Project Explorer shows Tracing project with a small "T" decorator in the upper right of the project folder icon.
Creating a Tracing Project
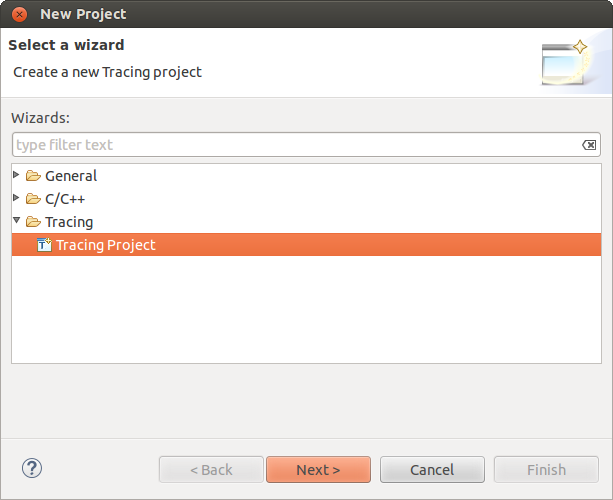
A new Tracing project can be created using the New Tracing Project wizard. To create a new Tracing select File > New > Project... from the main menu bar or alternatively form the context-sensitive menu (click with right mouse button in the Project Explorer.
The first page of project wizard will open.
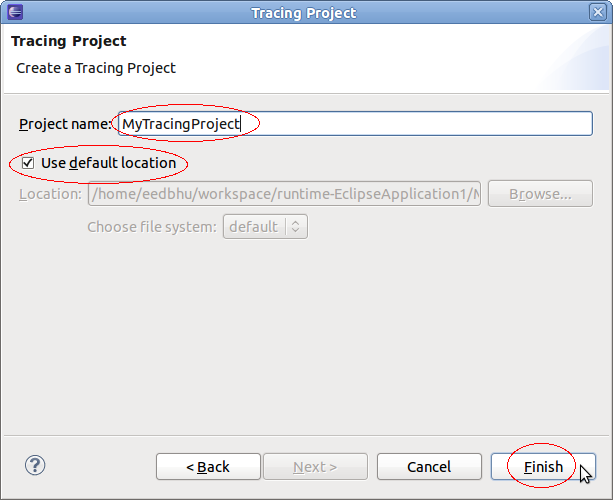
In the list of project categories, expand category Tracing and select Tracing Project and the click on Next >. A second page of the wizard will show. Now enter the a name in the field Project Name, select a location if required and the press on Finish.
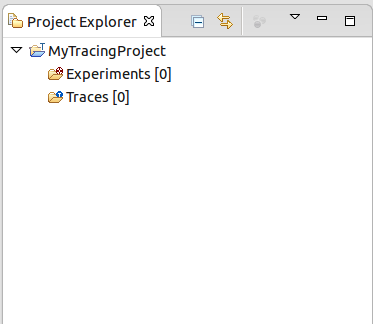
A new project will appear in the Project Explorer view.
Tracing projects have two sub-folders: Traces which holds the individual traces, and Experiments which holds sets of traces that we want to correlate.
Importing Traces to the Project
The Traces folder holds the set of traces available for a tracing project. It can optionally contain a tree of trace folders to organize traces into sub-folders. The following chapters will explain different ways to import traces to the Traces folder of a tracing project.
Opening a Trace
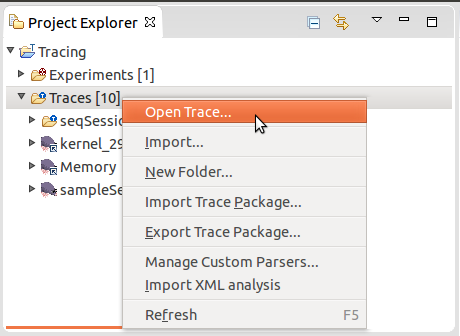
To open a trace, right-click on a target trace folder and select Open Trace....
A new dialog will show for selecting a trace to open. Select a trace file and then click on OK. Note that for traces that are directories (such as Common Trace Format (CTF) traces) any file in the trace directory can be selected to open the trace. Now, the trace viewer will attempt to detect the trace types of the selected trace. The auto detection algorithm will validate the trace against all known trace types. If multiple trace types are valid, a trace type is chosen based on a confidence criteria. The validation process and the computation of the confidence level are trace type specific. After successful validation the trace will be linked into the selected target trace folder and then opened with the detected trace type.
Note that a trace type is an extension point of the Tracing and Monitoring Framework (TMF). Depending on the which features are loaded, the list of available trace types can vary.
Importing
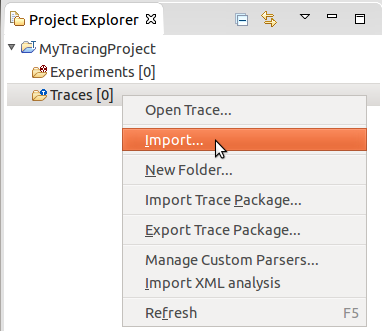
To import a set of traces to a trace folder, right-click on the target folder and select Import... from the context-sensitive menu.
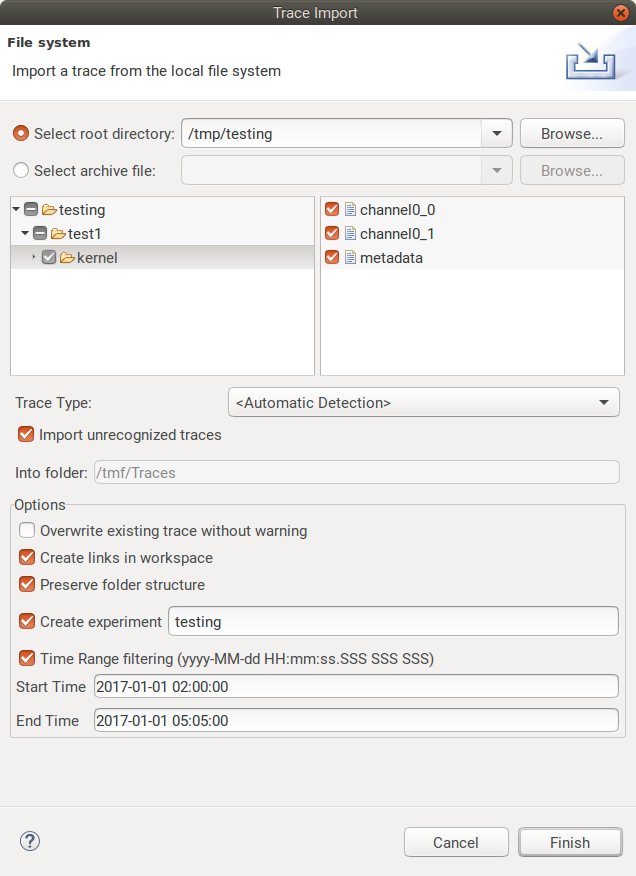
At this point, the Import Trace Wizard will show for selecting traces to import. By default, it shows the correct destination directory where the traces will be imported to. Now, specify the location of the traces in the Root directory. For that click on the button Browse, browse the media to the location of the traces and click on OK. Then select the traces to import in the list of files and folders.
Traces can also be imported from an archive file such as a zip or a tar file by selecting the Select archive file option then by clicking Browse. Then select the traces to import in the list of files and folders as usual.
Optionally, select the Trace Type from the drop-down menu. If Trace Type is set to <Automatic Detection>, the wizard will attempt to detect the trace types of the selected files. The automatic detection algorithm validates a trace against all known trace types. If multiple trace types are valid, a trace type is chosen based on a confidence criteria. The validation process and the computation of the confidence level are trace type specific. Optionally, Import unrecognized traces can be selected to import trace files that could not be automatically detected by <Automatic Detection>.
Select or deselect the checkboxes for Overwrite existing trace without warning, Create links in workspace and Preserve folder structure. When all options are configured, click on Finish.
Note that traces of certain types (e.g. LTTng Kernel) are actually a composite of multiple channel traces grouped under a folder. Either the folder or its files can be selected to import the trace.
The option Preserve folder structure will create, if necessary, the structure of folders relative to (and excluding) the selected Root directory (or Archive file) into the target trace folder.
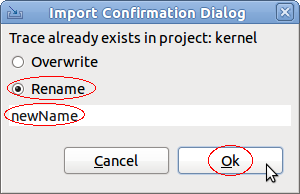
If a trace already exists with the same name in the target trace folder, the user can choose to rename the imported trace, overwrite the original trace or skip the trace. When rename is chosen, a number is appended to the trace name, for example smalltrace becomes smalltrace(2).
If one selects Rename All, Overwrite All or Skip All the choice will be applied for all traces with a name conflict.
Upon successful importing, the traces will be stored in the target trace folder. If a trace type was associated to a trace, then the corresponding icon will be displayed. If no trace type is detected the default editor icon associated with this file type will be displayed. Linked traces will have a little arrow as decorator on the right bottom corner.
Note that trace type is an extension point of the Tracing and Monitoring Framework (TMF). Depending on the which features are loaded, the list of trace types can vary.
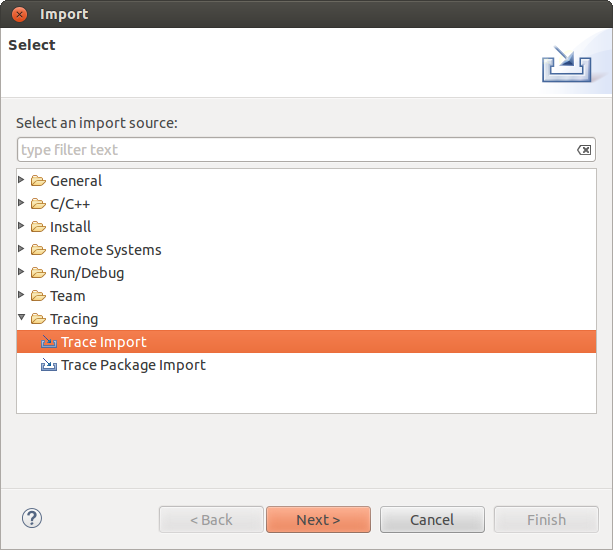
Alternatively, one can open the Import... menu from the File main menu, then select Tracing > Trace Import and click on Next >.
At this point, the Import Trace Wizard will show. To import traces to the tracing project, follow the instructions that were described above.
Drag and Drop
Traces can be also be imported to a project by dragging from another tracing project and dropping to the project's target trace folder. The trace will be copied and the trace type will be set.
Any resource can be dragged and dropped from a non-tracing project, and any file or folder can be dragged from an external tool, into a tracing project's trace folder. The resource will be copied or imported as a new trace and it will be attempted to detect the trace types of the imported resource. The automatic detection algorithm validates a trace against all known trace types. If multiple trace types are valid, a trace type is chosen based on a confidence criteria. The validation process and the computation of the confidence level are trace type specific. If no trace type is detected the user needs to set the trace type manually.
To import the trace as a link, use the platform-specific key modifier while dragging the source trace. A link will be created in the target project to the trace's location on the file system.
If a folder containing traces is dropped on a trace folder, the full directory structure will be copied or linked to the target trace folder. The trace type of the contained traces will not be auto-detected.
It is also possible to drop a trace, resource, file or folder into an existing experiment. If the item does not already exist as a trace in the project's trace folder, it will first be copied or imported, then the trace will be added to the experiment.
Trace Package Exporting and Importing
A trace package is an archive file that contains the trace itself and can also contain its bookmarks and its supplementary files. Including supplementary files in the package can improve performance of opening an imported trace but at the expense of package size.
Exporting
The Export Trace Package Wizard allows users to select a trace and export its files and bookmarks to an archive on a media.
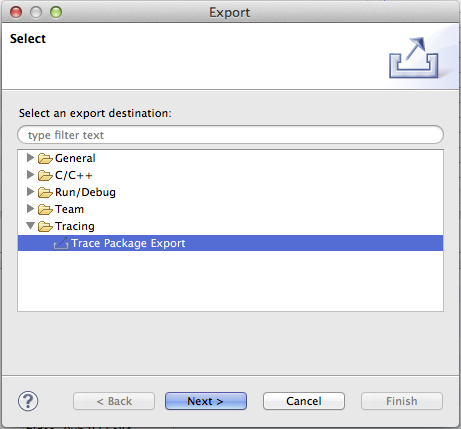
The Traces folder holds the set of traces available for a tracing project. To export traces contained in the Traces folder, one can open the Export... menu from the File main menu. Then select Trace Package Export
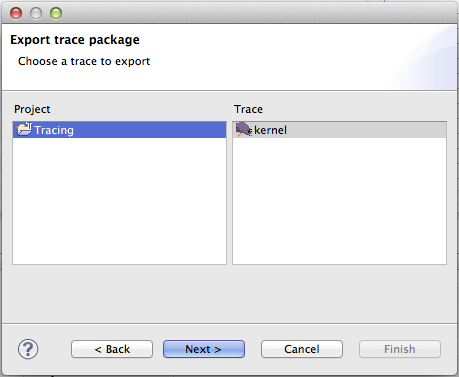
At this point, the Trace Package Export is opened. The project containing the traces has to be selected first then the traces to be exported.
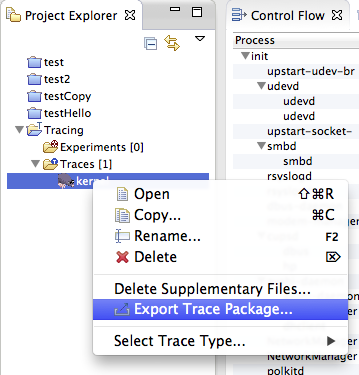
One can also open the wizard and skip the first page by expanding the project, selecting traces or trace folders under the Traces folder, then right-clicking and selecting the Export Trace Package... menu item in the context-sensitive menu.
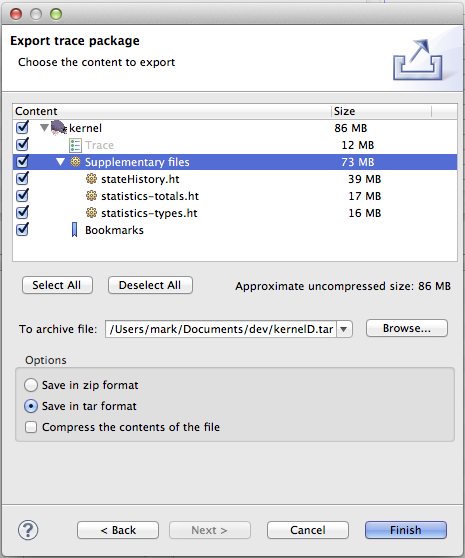
Next, the user can choose the content to export and various format options for the resulting file.
The Trace item is always selected and represents the files that constitute the trace. The Supplementary files items represent files that are typically generated when a trace is opened by the viewer. Sharing these files can speed up opening a trace dramatically but also increases the size of the exported archive file. The Size column can help to decide whether or not to include these files. Lastly, by selecting Bookmarks, the user can export all the bookmarks so that they can be shared along with the trace.
The To archive file field is used to specify the location where to save the resulting archive.
The Options section allows the user to choose between a tar archive or a zip archive. Compression can also be toggled on or off.
When Finish button is clicked, the package is generated and saved to the media. The folder structure of the selected traces relative to the Traces folder is preserved in the trace package.
Importing
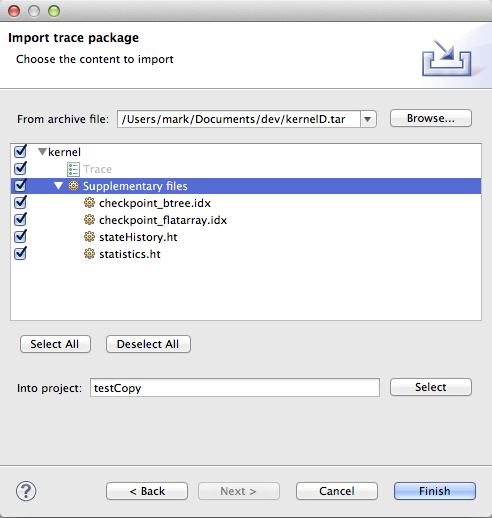
The Import Trace Package Wizard allows users to select a previously exported trace package from their media and import the content of the package in the workspace.
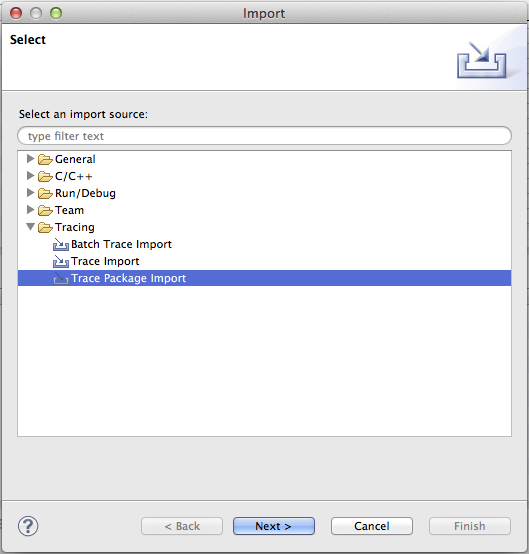
The Traces folder holds the set of traces for a tracing project. To import a trace package to the Traces folder, one can open the Import... menu from the File main menu. Then select Trace Package Import.
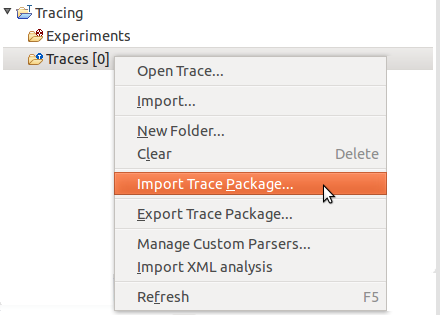
One can also open the wizard by expanding the project name, right-clicking on a target folder under the Traces folder then selecting Import Trace Package... menu item in the context-sensitive menu.
At this point, the Trace Package Import Wizard is opened.
The From archive file field is used to specify the location of the trace package to export. The user can choose the content to import in the tree.
If the wizard was opened using the File menu, the destination project has to be selected in the Into project field.
When Finish is clicked, the trace is imported in the target folder. The folder structure from the trace package is restored in the target folder.
Selecting a Trace Type
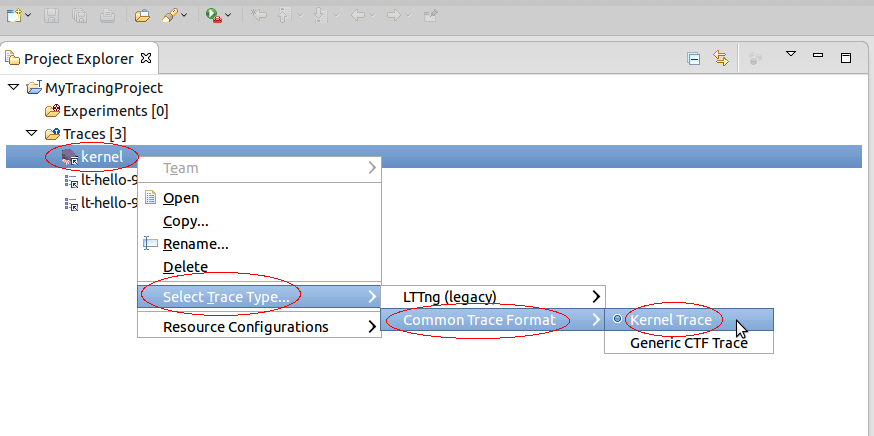
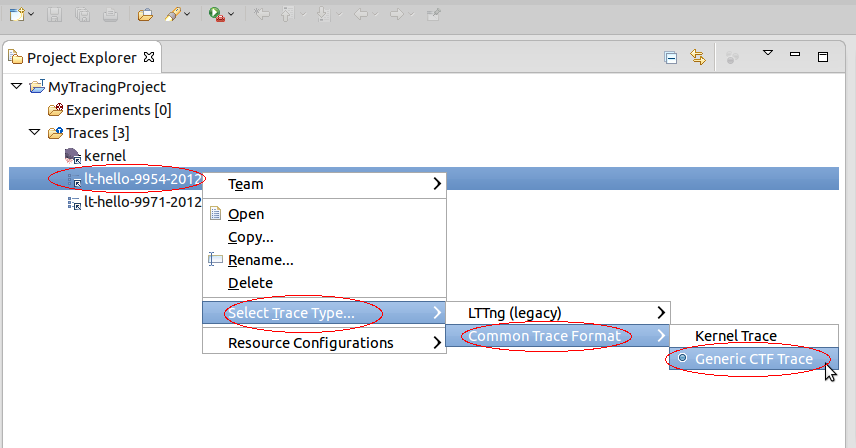
If no trace type was selected a trace type has to be associated to a trace before it can be opened. To select a trace type select the relevant trace and click the right mouse button. In the context-sensitive menu, select Select Trace Type... menu item. A sub-menu will show will all available trace type categories. From the relevant category select the required trace type. The examples, below show how to select the Common Trace Format types LTTng Kernel and Generic CTF trace.
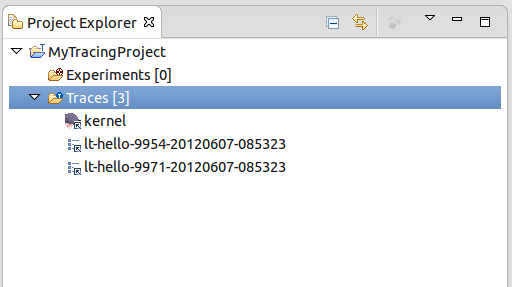
After selecting the trace type, the trace icon will be updated with the corresponding trace type icon.
Opening a Trace or Experiment
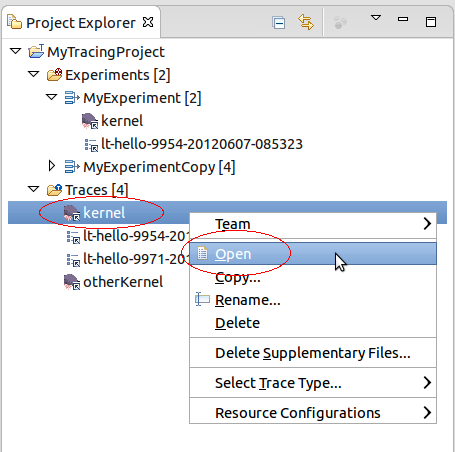
A trace or experiment can be opened by double-clicking the left mouse button on the trace or experiment in the Project Explorer view. Alternatively, select the trace or experiment in the in the Project Explorer view and click the right mouse button. Then select Open menu item of the context-sensitive menu. If there is no trace type set for a file resource then the file will be opened in the default editor associated with this file type.
When opening a trace or experiment, all currently opened views which are relevant for the corresponding trace type will be updated.
If a trace resource is a file (and not a directory), then the Open With menu item is available in the context-sensitive menu and can be used to open the trace source file with any applicable internal or external editor. In that case the trace will not be processed by the tracing application.
Creating a Experiment
An experiment consists in an arbitrary number of aggregated traces for purpose of correlation. In the degenerate case, an experiment can consist of a single trace. The experiment provides a unified, time-ordered stream of the individual trace events.
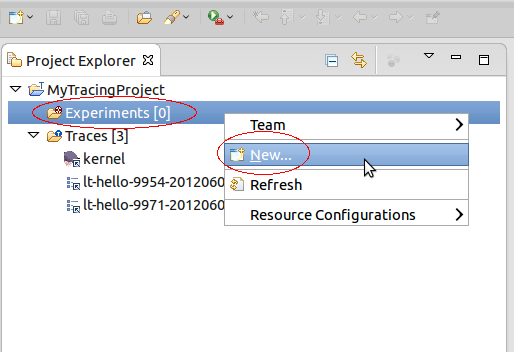
To create an experiment, select the folder Experiments and click the right mouse button. Then select New....
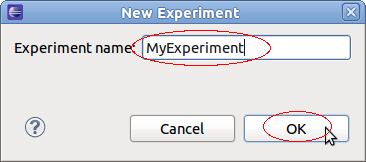
A new display will open for entering the experiment name. Type the name of the experiment in the text field Experiment Name and the click on OK.
Selecting Traces for an Experiment
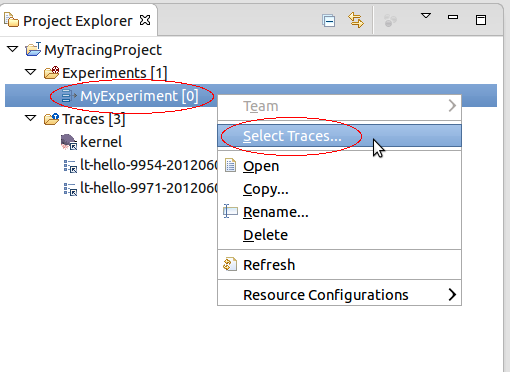
After creating an experiment, traces need to be added to the experiment. To select traces for an experiment select the newly create experiment and click the right mouse button. Select Select Traces... from the context sensitive menu.
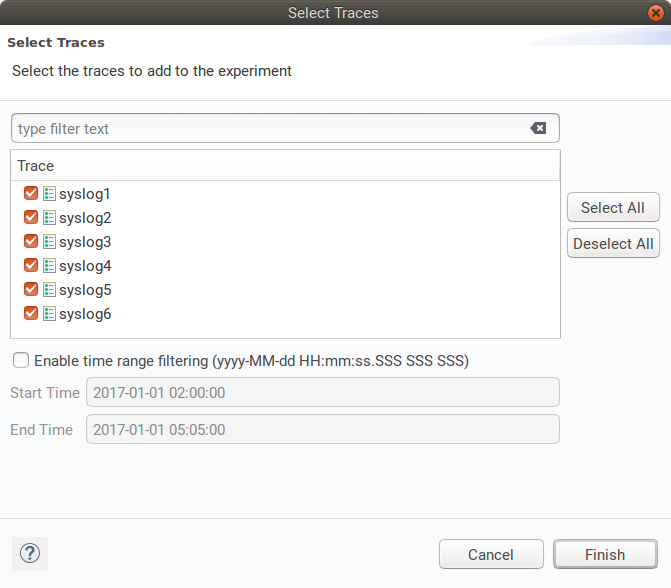
A new dialog box will open with a list of available traces. The filter text box can be used to quickly find traces. Use buttons Select All or Deselect All to select or deselect all traces. Select the traces to add from the list and then click on Finish.
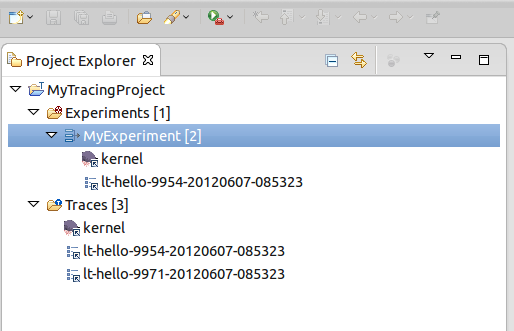
Now the selected traces will be linked to the experiment and will be shown under the Experiments folder.
Alternatively, traces can be added to an experiment using Drag and Drop.
Removing Traces from an Experiment
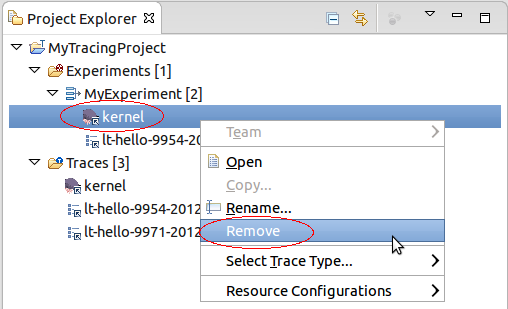
To remove one or more traces for an experiment select the trace(s) to remove under the Experiment folder and click the right mouse button. Select Remove from the context sensitive menu.
After that the selected trace(s) are removed from the experiment. Note that the traces are still in the Traces folder.
Renaming a Trace or Experiment
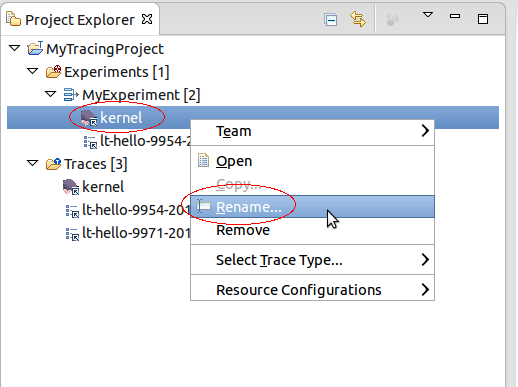
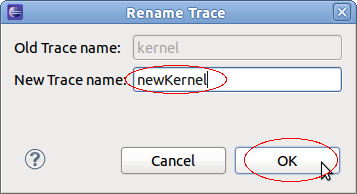
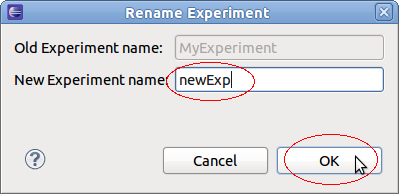
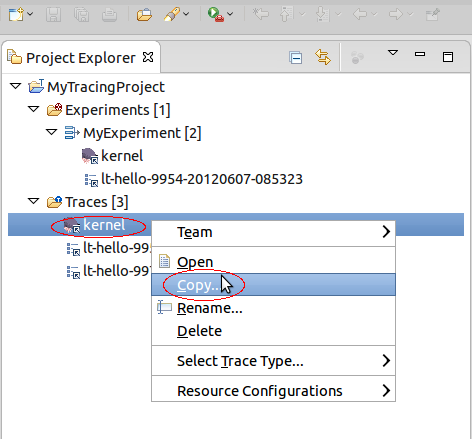
Traces and Experiment can be renamed from the Project Explorer view. To rename a trace or experiment select the relevant trace and click the right mouse button. Then select Rename... from the context sensitive menu. The trace or experiment needs to be closed in order to do this operation.
A new dialog box will show for entering a new name. Enter a new trace or experiment name respectively in the relevant text field and click on OK. If the new name already exists the dialog box will show an error and a different name has to be entered.
After successful renaming the new name will show in the Project Explorer. In case of a trace all reference links to that trace will be updated too. Note that linked traces only changes the display name, the underlying trace resource will stay the original name.
Note that all supplementary files will be also handled accordingly (see also Deleting Supplementary Files).
Copying a Trace or Experiment
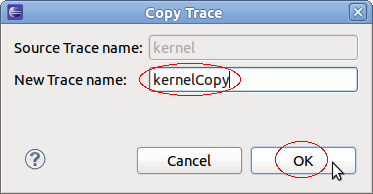
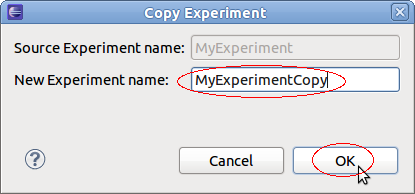
To copy a trace or experiment select the relevant trace or experiment in the Project Explorer view and click the right mouse button. Then select Copy... from the context sensitive menu.
A new dialog box will show for entering a new name. Enter a new trace or experiment name respectively in the relevant text field and click on OK. If the new name already exists the dialog box will show an error and a different name has to be entered.
After successful copy operation the new trace or experiment respectively will show in the Project Explorer. In case of a linked trace, the copied trace will be a link to the original trace too.
Note that the directory for all supplementary files will be copied, too. (see also Deleting Supplementary Files).
Deleting a Trace or Experiment
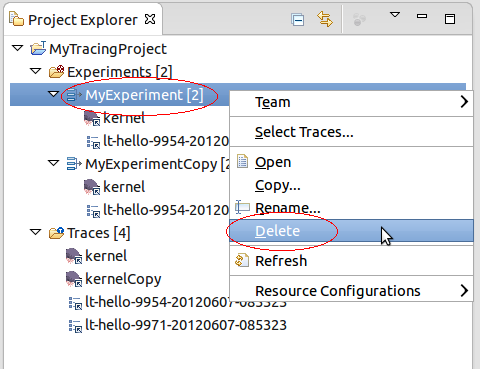
To delete a trace or experiment select the relevant trace or experiment in the Project Explorer view and click the right mouse button. Then select Delete... from the context sensitive menu. The trace or experiment needs to be closed in order to do this operation.
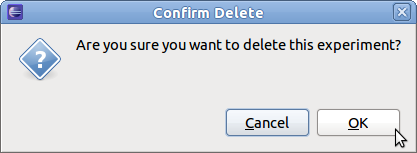
A confirmation dialog box will open. To perform the deletion press OK otherwise select Cancel.
After successful operation the selected trace or experiment will be removed from the project. In case of a linked trace only the link will be removed. The actual trace resource remain on the disk.
Note that the directory for all supplementary files will be deleted, too. (see also Deleting Supplementary Files).
Deleting Supplementary Files
Supplementary files are by definition trace specific files that accompany a trace. These file could be temporary files, persistent indexes or any other persistent data files created by the LTTng integration in Eclipse during parsing a trace. For the LTTng 2.0 trace viewer a persistent state history of the Linux Kernel is created and is stored under the name stateHistory.ht. The statistics for all traces are stored under statistics.ht. Other state systems may appear in the same folder as more custom views are added.
All supplementary file are hidden from the user and are handled internally by the TMF. However, there is a possibility to delete the supplementary files so that there are recreated when opening a trace.
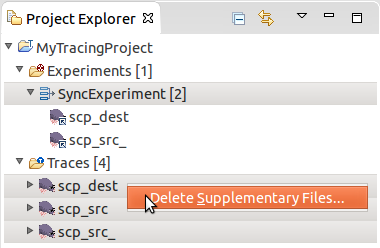
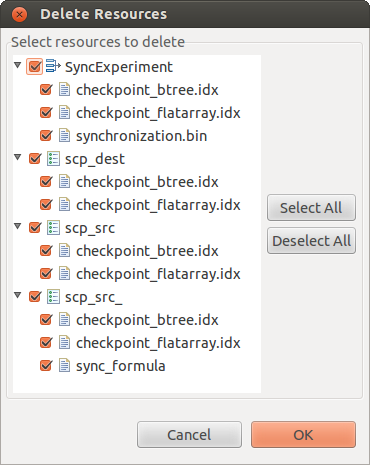
To delete all supplementary files from one or many traces and experiments, select the relevant traces and experiments in the Project Explorer view and click the right mouse button. Then select the Delete Supplementary Files... menu item from the context-sensitive menu.
A new dialog box will open with a list of supplementary files, grouped under the trace or experiment they belong to. Select the file(s) to delete from the list and press OK. The traces and experiments that need to be closed in order to do this operation will automatically be closed.
Link with Editor
The tracing projects support the feature Link With Editor of the Project Explorer view. With this feature it is now possible to
- select a trace element in the Project Explorer view and the corresponding Events Editor will get focus if the relevant trace is open.
- select an Events Editor and the corresponding trace element will be highlighted in the Project Explorer view.
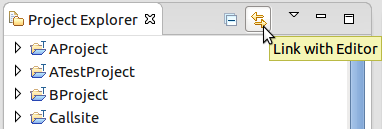
To enable or disable this feature toggle the Link With Editor button of the Project Explorer view as shown below.
Events Editor
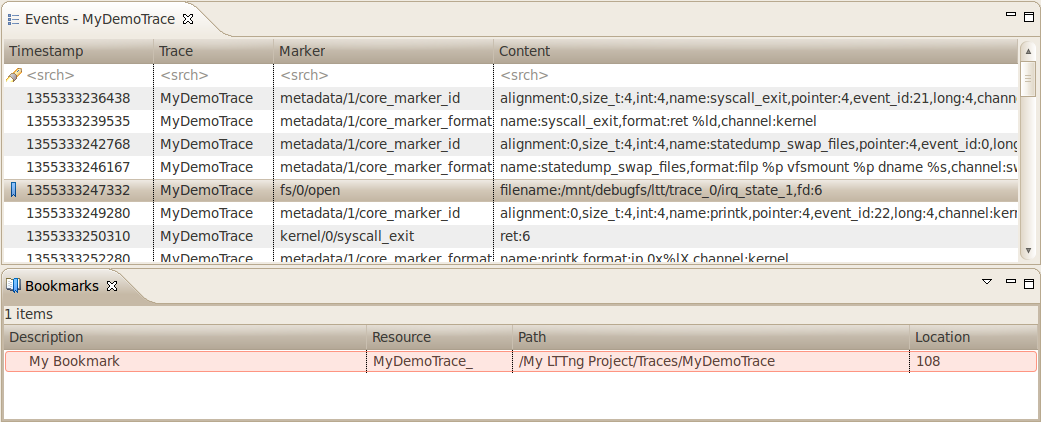
The Events editor shows the basic trace data elements (events) in a tabular format. The editors can be dragged in the editor area so that several traces may be shown side by side. These traces are synchronized by timestamp.
The header displays the current trace (or experiment) name.
Being part of the Tracing and Monitoring Framework, the default table displays the following fields:
- Timestamp: the event timestamp
- Source: the source of the event
- Type: the event type and localization
- Reference the event reference
- Content: the raw event content
The first row of the table is the header row a.k.a. the Search and Filter row.
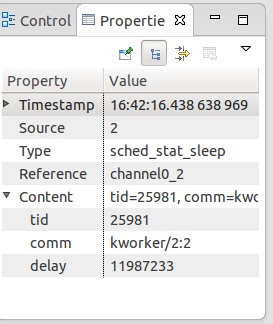
The highlighted event is the current event and is synchronized with the other views. If you select another event, the other views will be updated accordingly. The properties view will display a more detailed view of the selected event.
An event range can be selected by holding the Shift key while clicking another event or using any of the cursor keys (Up', Down, PageUp, PageDown, Home, End). The first and last events in the selection will be used to determine the current selected time range for synchronization with the other views.
The Events editor can be closed, disposing a trace. When this is done, all the views displaying the information will be updated with the trace data of the next event editor tab. If all the editor tabs are closed, then the views will display their empty states.
Searching and Filtering
Searching and filtering of events in the table can be performed by entering matching conditions in one or multiple columns in the header row (the first row below the column header).
To toggle between searching and filtering, click on the 'search' (![]() ) or 'filter' (
) or 'filter' (![]() ) icon in the header row's left margin, or right-click on the header row and select Show Filter Bar or Show Search Bar in the context menu.
) icon in the header row's left margin, or right-click on the header row and select Show Filter Bar or Show Search Bar in the context menu.
To apply a matching condition to a specific column, click on the column's header row cell, type in a regular expression and press the ENTER key. You can also enter a simple text string and it will be automatically be replaced with a 'contains' regular expression.
When matching conditions are applied to two or more columns, all conditions must be met for the event to match (i.e. 'and' behavior).
To clear all matching conditions in the header row, press the DEL key.
Searching
When a searching condition is applied to the header row, the table will select the next matching event starting from the top currently displayed event. Wrapping will occur if there is no match until the end of the trace.
All matching events will have a 'search match' icon in their left margin. Non-matching events will be dimmed.
Pressing the ENTER key will search and select the next matching event. Pressing the SHIFT-ENTER key will search and select the previous matching event. Wrapping will occur in both directions.
Press ESC to cancel an ongoing search.
Press DEL to clear the header row and reset all events to normal.
Filtering
When a filtering condition is entered in the head row, the table will clear all events and fill itself with matching events as they are found from the beginning of the trace.
A status row will be displayed before and after the matching events, dynamically showing how many matching events were found and how many events were processed so far. Once the filtering is completed, the status row icon in the left margin will change from a 'stop' to a 'filter' icon.
Press ESC to stop an ongoing filtering. In this case the status row icon will remain as a 'stop' icon to indicate that not all events were processed.
Press DEL or right-click on the table and select Clear Filters from the context menu to clear the header row and remove the filtering. All trace events will be now shown in the table. Note that the currently selected event will remain selected even after the filter is removed.
You can also search on the subset of filtered events by toggling the header row to the Search Bar while a filter is applied. Searching and filtering conditions are independent of each other.
Bookmarking
Any event of interest can be tagged with a bookmark.
To add a bookmark, double-click the left margin next to an event, or right-click the margin and select Add bookmark.... Alternatively use the Edit > Add bookmark... menu. Edit the bookmark description as desired and press OK.
The bookmark will be displayed in the left margin, and hovering the mouse over the bookmark icon will display the description in a tooltip.
The bookmark will be added to the Bookmarks view. In this view the bookmark description can be edited, and the bookmark can be deleted. Double-clicking the bookmark or selecting Go to from its context menu will open the trace or experiment and go directly to the event that was bookmarked.
To remove a bookmark, double-click its icon, select Remove Bookmark from the left margin context menu, or select Delete from the Bookmarks view.
Event Source Lookup
For CTF traces using specification v1.8.2 or above, information can optionally be embedded in the trace to indicate the source of a trace event. This is accessed through the event context menu by right-clicking on an event in the table.
Source Code
If a source file is available in the trace for the selected event, the item Open Source Code is shown in the context menu. Selecting this menu item will attempt to find the source file in all opened projects in the workspace. If multiple candidates exist, a selection dialog will be shown to the user. The selected source file will be opened, at the correct line, in its default language editor. If no candidate is found, an error dialog is shown displaying the source code information.
EMF Model
If an EMF model URI is available in the trace for the selected event, the item Open Model Element is shown in the context menu. Selecting this menu item will attempt to open the model file in the project specified in the URI. The model file will be opened in its default model editor. If the model file is not found, an error dialog is shown displaying the URI information.
Exporting To Text
It is possible to export the content of the trace to a text file based on the columns displayed in the events table. If a filter (see Filtering) was defined prior exporting only events that match the filter will be exported to the file. To export the trace to text, press the right mouse button on the events table. A context-sensitive menu will show. Select the Export To Text... menu option. A file locater dialog will open. Fill in the file name and location and then press on OK. A window with a progress bar will open till the export is finished.
Note: The columns in the text file are separated by tabs.
Collapsing of Repetitive Events
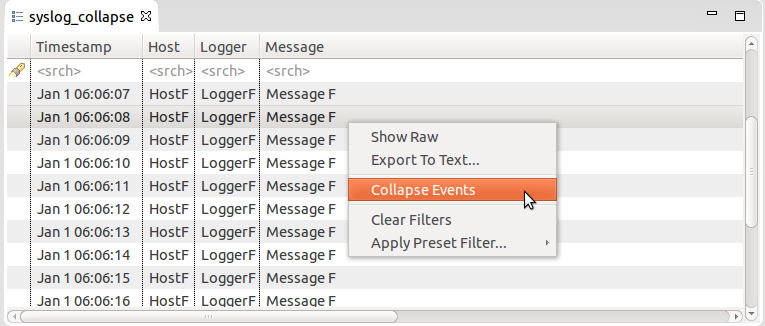
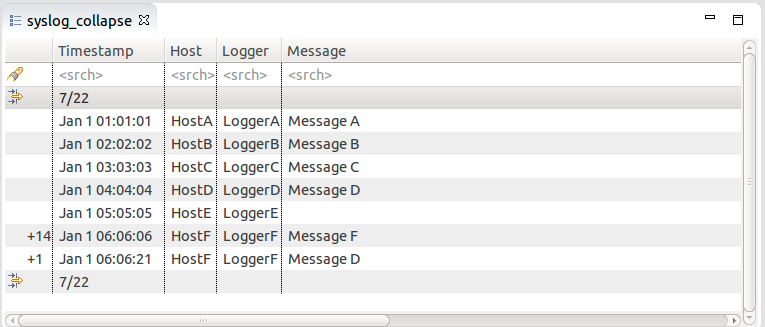
The implementation for collapsing of repetitive events is trace type specific and is only available for certain trace types. For example, a trace type could allow collapsing of consecutive events that have the same event content but not the same timestamp. If a trace type supports this feature then it is possible to select the Collapse Events menu item after pressing the right mouse button in the table.
When the collapsing of events is executing, the table will clear all events and fill itself with all relevant events. If the collapse condition is met, the first column of the table will show the number of times this event was repeated consecutively.
A status row will be displayed before and after the events, dynamically showing how many non-collapsed events were found and how many events were processed so far. Once the collapsing is completed, the status row icon in the left margin will change from a 'stop' to a 'filter' icon.
To clear collapsing, press the right mouse button in the table and select menu item Clear Filters in the context sensitive menu. Note that collapsing is also removed when another filter is applied to the table.
Histogram View
The Histogram View displays the trace events distribution with respect to time. When streaming a trace, this view is dynamically updated as the events are received.
The Hide Lost Events toggle button ![]() in the local toolbar allows to hide the bars of lost events. When the button is selected it can be toggled again to show the lost events.
in the local toolbar allows to hide the bars of lost events. When the button is selected it can be toggled again to show the lost events.
The Activate Trace Coloring toggle button ![]() in the local toolbar allows to use separate colors for each trace of an experiment. Note that this feature is not available if your experiment contains more than twenty two traces. When activated, a legend is displayed at the bottom on the histogram view.
in the local toolbar allows to use separate colors for each trace of an experiment. Note that this feature is not available if your experiment contains more than twenty two traces. When activated, a legend is displayed at the bottom on the histogram view.
On the top left, there are three text controls:
- Selection Start: Displays the start time of the current selection
- Selection End: Displays the end time of the current selection
- Window Span: Displays the current zoom window size in seconds
The controls can be used to modify their respective value. After validation, the other controls and views will be synchronized and updated accordingly. To modify both selection times simultaneously, press the link icon ![]() which disables the Selection End control input.
which disables the Selection End control input.
The large (full) histogram, at the bottom, shows the event distribution over the whole trace or set of traces. It also has a smaller semi-transparent orange window, with a cross-hair, that shows the current zoom window.
The smaller (zoom) histogram, on top right, corresponds to the current zoom window, a sub-range of the event set.
The x-axis of each histogram corresponds to the event timestamps. The start time and end time of the histogram range is displayed. The y-axis shows the maximum number of events in the corresponding histogram bars.
The vertical blue line(s) show the current selection time (or range). If applicable, the region in the selection range will be shaded.
The mouse can be used to control the histogram:
- Left-click: Set a selection time
- Left-drag: Set a selection range
- Shift-left-click or drag: Extend or shrink the selection range
- Middle-click or Ctrl-left-click: Center the zoom window on mouse (full histogram only)
- Middle-drag or Ctrl-left-drag: Move the zoom window
- Right-drag: Set the zoom window
- Shift-right-click or drag: Extend or shrink the zoom window (full histogram only)
- Mouse wheel up: Zoom in
- Mouse wheel down: Zoom out
Hovering the mouse over an histogram bar pops up an information window that displays the start/end time of the corresponding bar, as well as the number of events (and lost events) it represents. If the mouse is over the selection range, the selection span in seconds is displayed.
In each histogram, the following keys are handled:
- Left Arrow: Moves the current event to the previous non-empty bar
- Right Arrow: Moves the current event to the next non-empty bar
- Home: Sets the current time to the first non-empty bar
- End: Sets the current time to the last non-empty histogram bar
- Plus (+): Zoom in
- Minus (-): Zoom out
Statistics View
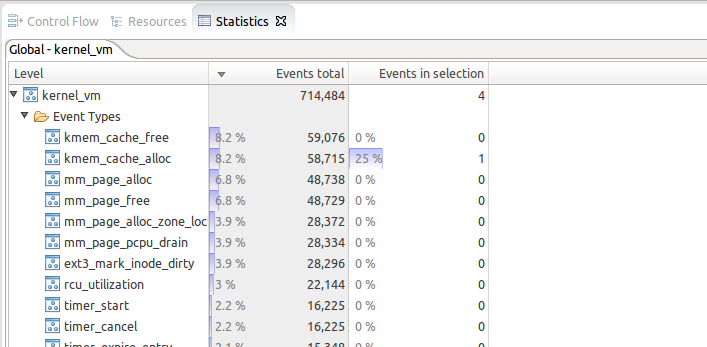
The Statistics View displays the various event counters that are collected when analyzing a trace. The data is organized per trace. After opening a trace, the element Statistics is added under the Tmf Statistics Analysis tree element in the Project Explorer. To open the view, double-click the Statistics tree element. Alternatively, select Statistics under Tracing within the Show View window (Window -> Show View -> Other...). This view shows 3 columns: Level Events total and Events in selected time range. After parsing a trace the view will display the number of events per event type in the second column and in the third, the currently selected time range's event type distribution is shown. The cells where the number of events are printed also contain a colored bar with a number that indicates the percentage of the event count in relation to the total number of events. The statistics is collected for the whole trace. This view is part of the Tracing and Monitoring Framework (TMF) and is generic. It will work for any trace type extensions. For the LTTng 2.0 integration the Statistics view will display statistics as shown below.:
By default, the statistics use a state system, therefore will load very quickly once the state system is written to the disk as a supplementary file.
Colors View
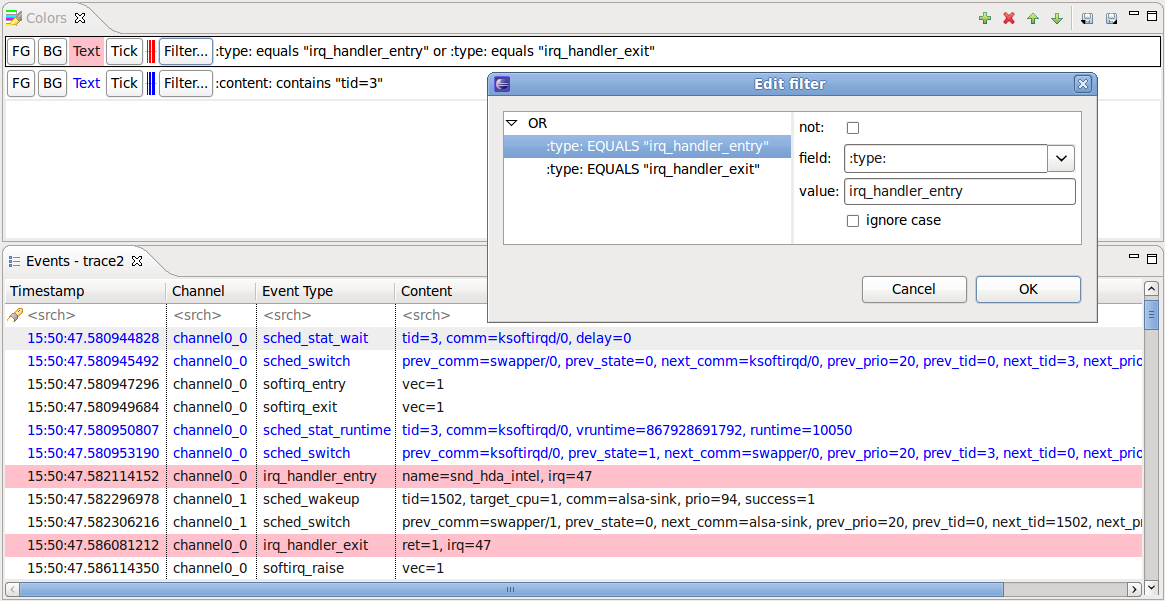
The Colors view allows the user to define a prioritized list of color settings.
A color setting associates a foreground and background color (used in any events table), and a tick color (used in the Time Chart view), with an event filter.
In an events table, any event row that matches the event filter of a color setting will be displayed with the specified foreground and background colors. If the event matches multiple filters, the color setting with the highest priority will be used.
The same principle applies to the event tick colors in the Time Chart view. If a tick represents many events, the tick color of the highest priority matching event will be used.
Color settings can be inserted, deleted, reordered, imported and exported using the buttons in the Colors view toolbar. Changes to the color settings are applied immediately, and are persisted to disk.
Filters View
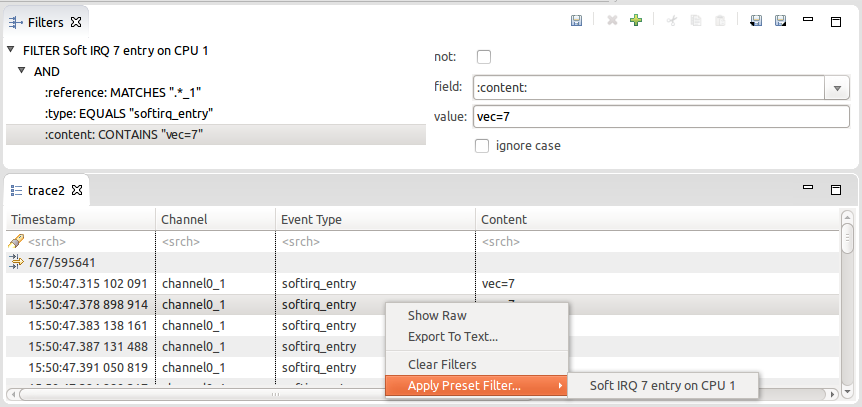
The Filters view allows the user to define preset filters that can be applied to any events table.
The filters can be more complex than what can be achieved with the filter header row in the events table. The filter is defined in a tree node structure, where the node types can be any of EVENTTYPE, AND, OR, CONTAINS, EQUALS, MATCHES or COMPARE. Some nodes types have restrictions on their possible children in the tree.
The EVENTTYPE node filters against the event type of the trace as defined in a plug-in extension or in a custom parsers. When used, any child node will have its field combo box restricted to the possible fields of that event type.
The AND node applies the logical and condition on all of its children. All children conditions must be true for the filter to match. A not operator can be applied to invert the condition.
The OR node applies the logical or condition on all of its children. At least one children condition must be true for the filter to match. A not operator can be applied to invert the condition.
The CONTAINS node matches when the specified event field value contains the specified value string. A not operator can be applied to invert the condition. The condition can be case sensitive or insensitive.
The EQUALS node matches when the specified event field value equals exactly the specified value string. A not operator can be applied to invert the condition. The condition can be case sensitive or insensitive.
The MATCHES node matches when the specified event field value matches against the specified regular expression. A not operator can be applied to invert the condition.
The COMPARE node matches when the specified event field value compared with the specified value gives the specified result. The result can be set to smaller than, equal or greater than. The type of comparison can be numerical, alphanumerical or based on time stamp. A not operator can be applied to invert the condition.
Filters can be added, deleted, imported and exported using the buttons in the Filters view toolbar. The nodes in the view can be Cut (Ctrl-X), Copied (Ctrl-C) and Pasted (Ctrl-V) by using the buttons in the toolbar or by using the key bindings. This makes it easier to quickly build new filters from existing ones. Changes to the preset filters are only applied and persisted to disk when the save filters button is pressed.
To apply a saved preset filter in an events table, right-click on the table and select Apply preset filter... > filter name.
Time Chart View
The Time Chart view allows the user to visualize every open trace in a common time chart. Each trace is display in its own row and ticks are display for every punctual event. As the user zooms using the mouse wheel or by right-clicking and dragging in the time scale, more detailed event data is computed from the traces.
Time synchronization is enabled between the time chart view and other trace viewers such as the events table.
Color settings defined in the Colors view can be used to change the tick color of events displayed in the Time Chart view.
When a search is applied in the events table, the ticks corresponding to matching events in the Time Chart view are decorated with a marker below the tick.
When a bookmark is applied in the events table, the ticks corresponding to the bookmarked event in the Time Chart view is decorated with a bookmark above the tick.
When a filter is applied in the events table, the non-matching ticks are removed from the Time Chart view.
The Time Chart only supports traces that are opened in an editor. The use of an editor is specified in the plug-in extension for that trace type, or is enabled by default for custom traces.
State System Explorer View
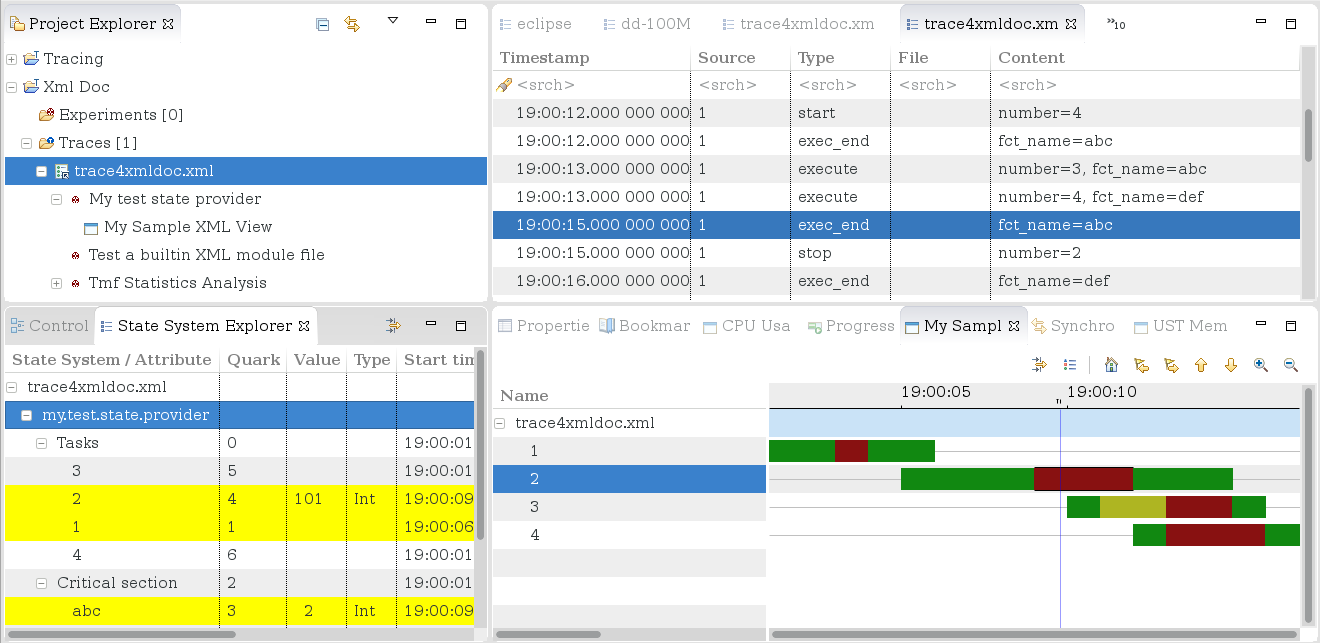
The State System Explorer view allows the user to inspect the state interval values of every attribute of a state system at a particular time.
The view shows a tree of currently selected traces and their registered state system IDs. For each state system the tree structure of attributes is displayed. The attribute name, quark, value, start and end time, and full attribute path are shown for each attribute.
To modify the time of attributes shown in the view, select a different current time in other views that support time synchronization (e.g. event table, histogram view). When a time range is selected, this view uses the begin time.
Custom Parsers
Custom parser wizards allow the user to define their own parsers for text or XML traces. The user defines how the input should be parsed into internal trace events and identifies the event fields that should be created and displayed. Traces created using a custom parser can be correlated with other built-in traces or traces added by plug-in extension.
Creating a custom text parser
The New Custom Text Parser wizard can be used to create a custom parser for text logs. It can be launched several ways:
- Select File > New > Other... > Tracing > Custom Text Parser
- Open the Manage Custom Parsers dialog, select the Text radio button and click the New... button
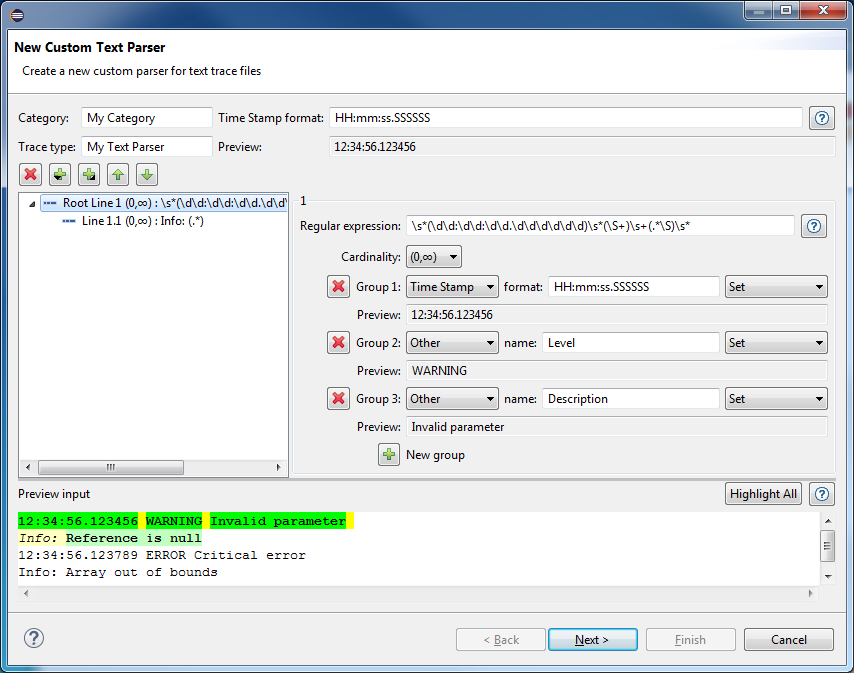
Fill out the first wizard page with the following information:
- Category: Enter a category name for the trace type.
- Trace type: Enter a name for the trace type, which is also the name of the custom parser.
- Time Stamp format: Enter the date and time pattern that will be used to output the Time Stamp.
Note: information about date and time patterns can be found here: [../reference/api/org/eclipse/linuxtools/tmf/core/timestamp/TmfTimestampFormat.html TmfTimestampFormat]
Click the Add next line, Add child line or Remove line buttons to create a new line of input or delete it. For each line of input, enter the following information:
- Regular expression: Enter a regular expression that should match the input line in the log, using capturing groups to extract the data.
Note: information about date and time patterns can be found here: [2]
- Cardinality: Enter the minimum and maximum number of lines matching this line's regular expression that must be found in the log. At least the minimum number of lines must be found before the parser will consider the next line. Child lines will always be considered first.
Important note: The custom parsers identify a log entry when the first line's regular expression matches (Root Line n). Each subsequent text line in the log is attempted to be matched against the regular expression of the parser's input lines in the order that they are defined (Line n.*). Only the first matching input line will be used to process the captured data to be stored in the log entry. When a text line matches a Root Line's regular expression, a new log entry is started.
Click the Add group or Remove group buttons to define the data extracted from the capturing groups in the line's regular expression. For each group, enter the following information:
- Name combo: Select a name for the extracted data:
- Time Stamp: Select this option to identify the time stamp data. The input's data and time pattern must be entered in the format: text box.
- Message: Select this option to identify the main log entry's message. This is usually a group which could have text of greater length.
- Other: Select this option to identify any non-standard data. The name must be entered in the name: text box.
- Action combo: Select the action to be performed on the extracted data:
- Set: Select this option to overwrite the data for the chosen name when there is a match for this group.
- Append: Select this option to append to the data with the chosen name, if any, when there is a match for this group.
- Append with | : Select this option to append to the data with the chosen name, if any, when there is a match for this group, using a | separator between matches.
The Preview input text box can be used to enter any log data that will be processed against the defined custom parser. When the wizard is invoked from a selected log file resource, this input will be automatically filled with the file contents.
The Preview: text field of each capturing group and of the Time Stamp will be filled from the parsed data of the first matching log entry.
In the Preview input text box, the matching entries are highlighted with different colors:
-
Yellow: indicates uncaptured text in a matching line. -
Green: indicates a captured group in the matching line's regular expression for which a custom parser group is defined. This data will be stored by the custom parser. -
Magenta: indicates a captured group in the matching line's regular expression for which there is no custom parser group defined. This data will be lost. -
White: indicates a non-matching line.
The first line of a matching entry is highlighted with darker colors.
By default only the first matching entry will be highlighted. To highlight all matching entries in the preview input data, click the Highlight All button. This might take a few seconds to process, depending on the input size.
Click the Next > button to go to the second page of the wizard.
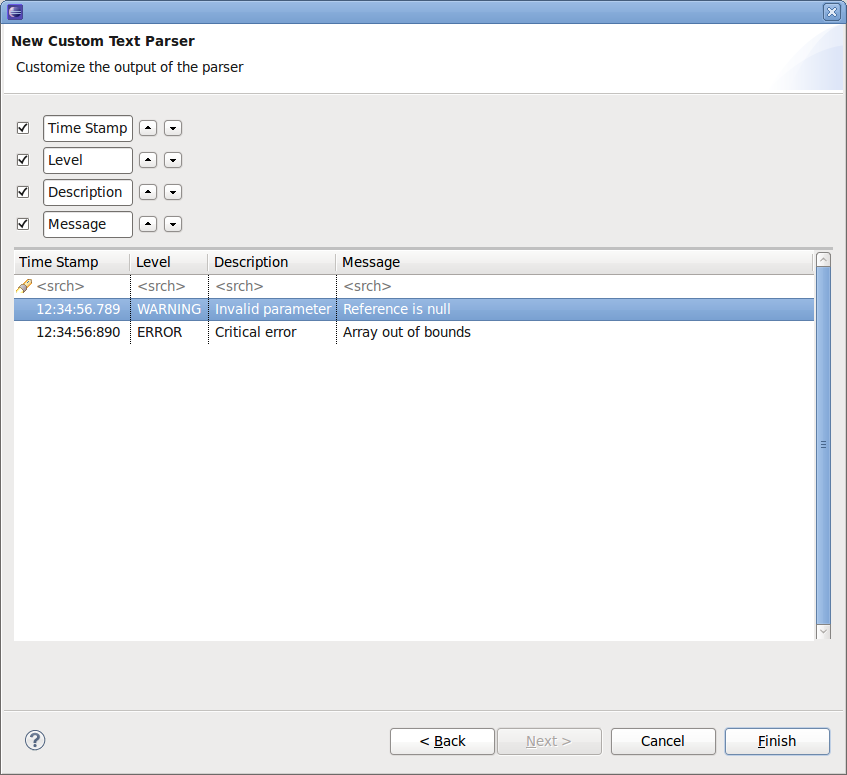
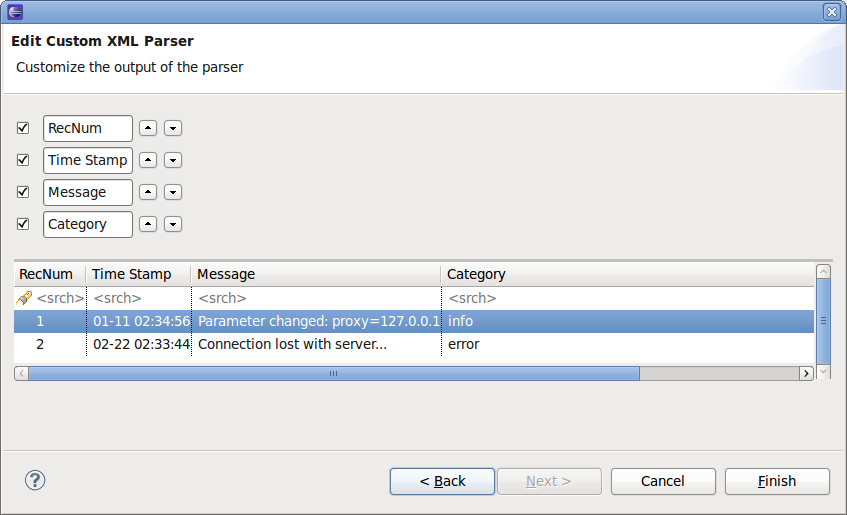
On this page, the list of default and custom data is shown, along with a preview of the custom parser log table output.
The custom data output can be modified by the following options:
- Visibility: Select or unselect the checkbox to display the custom data or hide it.
- Column order: Click Move before or Move after to change the display order of custom data.
The table at the bottom of the page shows a preview of the custom parser log table output according to the selected options, using the matching entries of the previous page's Preview input log data.
Click the Finish button to close the wizard and save the custom parser.
Creating a custom XML parser
The New Custom XML Parser wizard can be used to create a custom parser for XML logs. It can be launched several ways:
- Select File > New > Other... > Tracing > Custom XML Parser
- Open the Manage Custom Parsers dialog, select the XML radio button and click the New... button
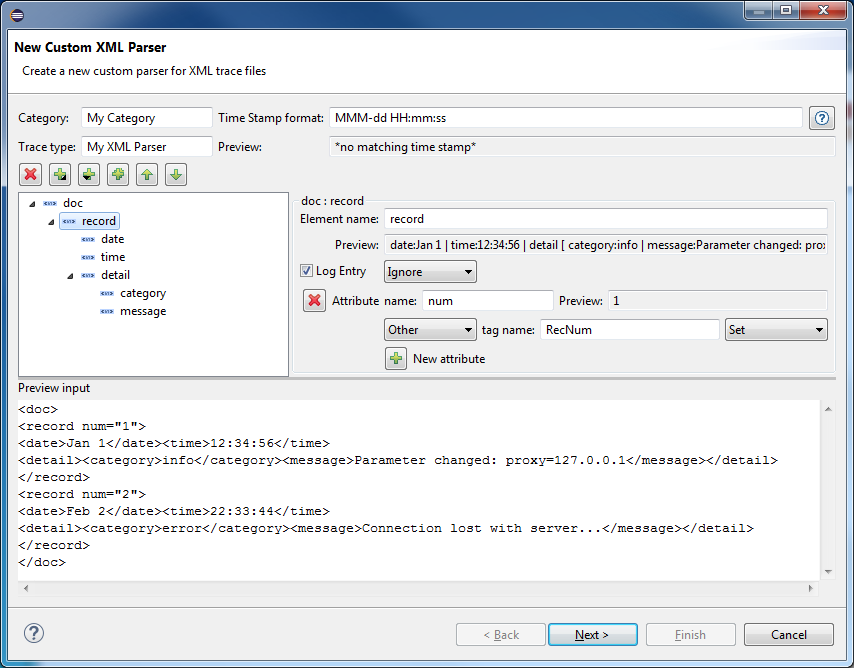
Fill out the first wizard page with the following information:
- Category: Enter a category name for the trace type.
- Trace type: Enter a name for the trace type, which is also the name of the custom parser.
- Time Stamp format: Enter the date and time pattern that will be used to output the Time Stamp.
Note: information about date and time patterns can be found here: [../reference/api/org/eclipse/linuxtools/tmf/core/timestamp/TmfTimestampFormat.html TmfTimestampFormat]
Click the Add document element button to create a new document element and enter a name for the root-level document element of the XML file.
Click the Add child button to create a new element of input to the document element or any other element. For each element, enter the following information:
- Element name: Enter a name for the element that must match an element of the XML file.
- Log entry: Select this checkbox to identify an element which represents a log entry. Each element with this name in the XML file will be parsed to a new log entry. At least one log entry element must be identified in the XML document. Log entry elements cannot be nested.
- Name combo: Select a name for the extracted data:
- Ignore: Select this option to ignore the extracted element's data at this level. It is still possible to extract data from this element's child elements.
- Time Stamp: Select this option to identify the time stamp data. The input's data and time pattern must be entered in the format: text box.
- Message: Select this option to identify the main log entry's message. This is usually an input which could have text of greater length.
- Other: Select this option to identify any non-standard data. The name must be entered in the name: text box. It does not have to match the element name.
- Action combo: Select the action to be performed on the extracted data:
- Set: Select this option to overwrite the data for the chosen name when there is a match for this element.
- Append: Select this option to append to the data with the chosen name, if any, when there is a match for this element.
- Append with | : Select this option to append to the data with the chosen name, if any, when there is a match for this element, using a | separator between matches.
Note: An element's extracted data 'value' is a parsed string representation of all its attributes, children elements and their own values. To extract more specific information from an element, ignore its data value and extract the data from one or many of its attributes and children elements.
Click the Add attribute button to create a new attribute input from the document element or any other element. For each attribute, enter the following information:
- Attribute name: Enter a name for the attribute that must match an attribute of this element in the XML file.
- Name combo: Select a name for the extracted data:
- Time Stamp: Select this option to identify the time stamp data. The input's data and time pattern must be entered in the format: text box.
- Message: Select this option to identify the main log entry's message. This is usually an input which could have text of greater length.
- Other: Select this option to identify any non-standard data. The name must be entered in the name: text box. It does not have to match the element name.
- Action combo: Select the action to be performed on the extracted data:
- Set: Select this option to overwrite the data for the chosen name when there is a match for this element.
- Append: Select this option to append to the data with the chosen name, if any, when there is a match for this element.
- Append with | : Select this option to append to the data with the chosen name, if any, when there is a match for this element, using a | separator between matches.
Note: A log entry can inherited input data from its parent elements if the data is extracted at a higher level.
Click the Feeling lucky button to automatically and recursively create child elements and attributes for the current element, according to the XML element data found in the Preview input text box, if any.
Click the Remove element or Remove attribute buttons to remove the extraction of this input data. Take note that all children elements and attributes are also removed.
The Preview input text box can be used to enter any XML log data that will be processed against the defined custom parser. When the wizard is invoked from a selected log file resource, this input will be automatically filled with the file contents.
The Preview: text field of each capturing element and attribute and of the Time Stamp will be filled from the parsed data of the first matching log entry. Also, when creating a new child element or attribute, its element or attribute name will be suggested if possible from the preview input data.
Click the Next > button to go to the second page of the wizard.
On this page, the list of default and custom data is shown, along with a preview of the custom parser log table output.
The custom data output can be modified by the following options:
- Visibility: Select or unselect the checkbox to display the custom data or hide it.
- Column order: Click Move before or Move before to change the display order of custom data.
The table at the bottom of the page shows a preview of the custom parser log table output according to the selected options, using the matching entries of the previous page's Preview input log data.
Click the Finish button to close the wizard and save the custom parser.
Managing custom parsers
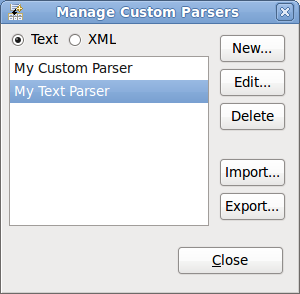
The Manage Custom Parsers dialog is used to manage the list of custom parsers used by the tool. To open the dialog:
- Open the Project Explorer view.
- Select Manage Custom Parsers... from the Traces folder context menu, or from a trace's Select Trace Type... context sub-menu.
The ordered list of currently defined custom parsers for the selected type is displayed on the left side of the dialog.
To change the type of custom parser to manage, select the Text or XML radio button.
The following actions can be performed from this dialog:
- New...
Click the New... button to launch the New Custom Parser wizard.
- Edit...
Select a custom parser from the list and click the Edit... button to launch the Edit Custom Parser wizard.
- Delete
Select a custom parser from the list and click the Delete button to remove the custom parser.
- Import...
Click the Import... button and select a file from the opened file dialog to import all its custom parsers.
- Export...
Select a custom parser from the list, click the Export... button and enter or select a file in the opened file dialog to export the custom parser. Note that if an existing file containing custom parsers is selected, the custom parser will be appended to the file.
Opening a trace using a custom parser
Once a custom parser has been created, any imported trace file can be opened and parsed using it.
To do so:
- Select a trace in the Project Explorer view
- Right-click the trace and select Select Trace Type... > category name > parser name
- Double-click the trace or right-click it and select Open
The trace will be opened in an editor showing the events table, and an entry will be added for it in the Time Chart view.
LTTng Tracer Control
The LTTng Tracer Control in Eclipse for the LTTng Tracer toolchain version v2.0 (or later) is done using SSH and requires an SSH server to be running on the remote host. For the SSH connection the SSH implementation of RSE is used. For that a new System Type was defined using the corresponding RSE extension. The functions to control the LTTng tracer (e.g. start and stop), either locally or remotely, are available from a dedicated Control View.
In the following sections the LTTng 2.0 tracer control integration in Eclipse is described. Please refer to the LTTng 2.0 tracer control command line manual for more details and descriptions about all commands and their command line parameters References.
Control View
To open the Control View, select 'Window->Show View->Other...->LTTng->Control View.
Creating a New Connection to a Remote Host
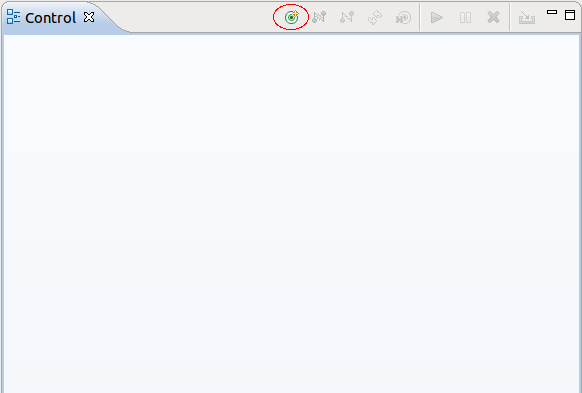
To connect to a remote host, select the New Connection button in the Control View.
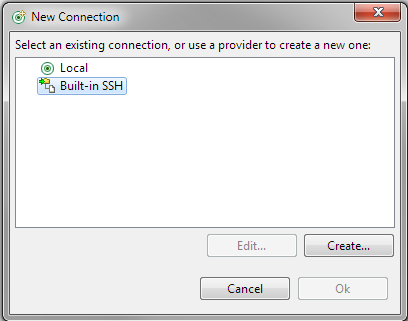
A new dialog is opened for selecting a remote connection. You can also edit or define a remote connection from here.
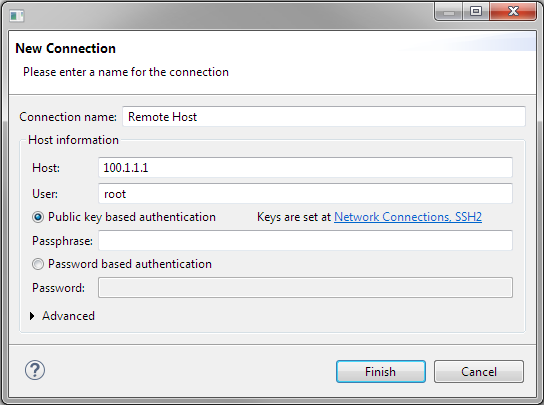
To define a new remote host using the default SSH service, select Buit-in SSH and then select Create.... This will start the standard New Connection wizard provided by the Remote Services plugin. Similar, to edit the definition of a remote connection, select Edit... and use the Edit Connection wizard provided by the SSH service. In case you have installed an additional adapter for the Remote Services, you can choose to define a remote connection based on this adapter.
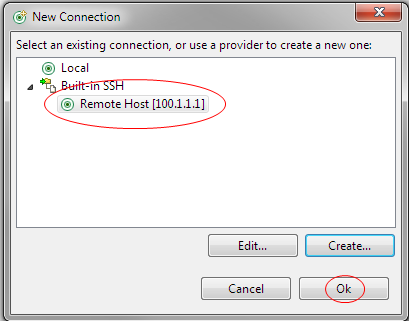
To use an existing connection definition, select the relevant entry in the tree and then select Ok.
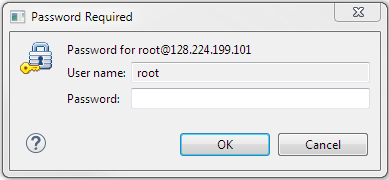
A new display will show for providing the user name and password. This display only opens if no password had been saved before. Enter user name and password in the Password Required dialog box and select Ok.
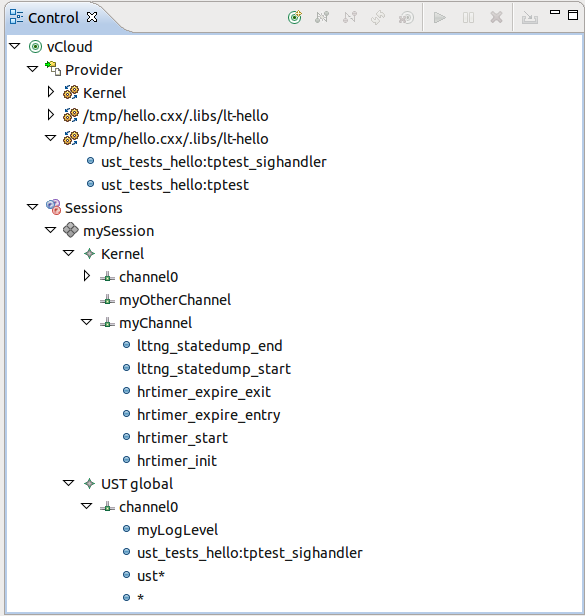
After pressing Ok the SSH connection will be established and after successful login the Control View implementation retrieves the LTTng Tracer Control information. This information will be displayed in the Control View in form of a tree structure.
The top level tree node is the representation of the remote connection (host). The connection name of the connection will be displayed. Depending on the connection state different icons are displayed. If the node is CONNECTED the icon is shown ![]() , otherwise (states CONNECTING, DISCONNNECTING or DISCONNECTED the icon is
, otherwise (states CONNECTING, DISCONNNECTING or DISCONNECTED the icon is ![]() .
.
Under the host level two folder groups are located. The first one is the Provider group. The second one is the Sessions group.
Under the Provider group all trace providers are displayed. Trace providers are Kernel and any user space application that supports UST tracing. Under each provider a corresponding list of events are displayed.
Under the Sessions group all current sessions will be shown. The level under the sessions show the configured domains. Currently the LTTng 2.0 Tracer Toolchan supports domain Kernel and UST global. Under each domain the configured channels will be displayed. The last level is under the channels where the configured events are displayed.
Each session can be ACTIVE or INACTIVE. Active means that tracing has been started, inactive means that the tracing has been stopped. Depending on the state of a session a different icon is displayed. The icon for an active session is ![]() . The icon for an inactive session is
. The icon for an inactive session is ![]() .
.
Each channel can be ENABLED or DISABLED. An enabled channel means that all configured events of that channel will be traced and a disabled channel won't trace any of its configured events. Different icons are displayed depending on the state of the channel. The icon for an enabled channel is ![]() and the icon for a disabled channel is
and the icon for a disabled channel is ![]() .
.
Events within a channel can be in state ENABLED or DISABLED. Enabled events are stored in the trace when passed during program execution. Disabled events on the other hand won't be traced. Depending on the state of the event the icons for the event is different. An enabled event has the icon ![]() and a disabled event the icon
and a disabled event the icon ![]() .
.
Disconnecting from a Remote Host
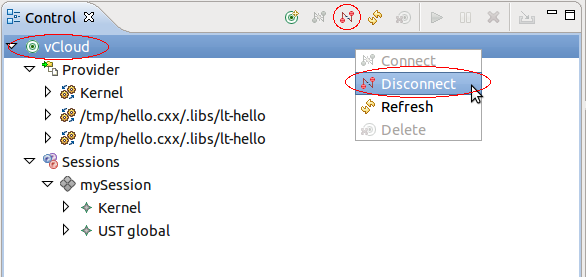
To disconnect from a remote host, select the host in the Control View and press the Disconnect button. Alternatively, press the right mouse button. A context-sensitive menu will show. Select the Disconnect button.
Connecting to a Remote Host
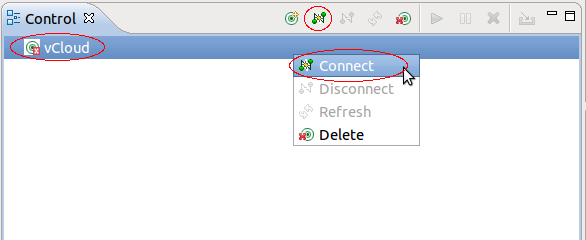
To connect to a remote host, select the host in the Control View and press the Connect button. Alternatively, press the right mouse button. A context-sensitive menu will show. Select the Connect button. This will start the connection process as discribed in Creating a New Connection to a Remote Host.
Deleting to a Remote Host Connection
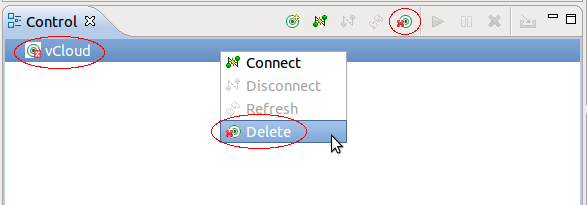
To delete a remote host connection, select the host in the Control View and press the Delete button. Alternatively, press the right mouse button. A context-sensitive menu will show. Select the Delete button. For that command to be active the connection state has to be DISCONNECTED and the trace has to be closed.
Creating a Tracing Session
To create a tracing session, select the tree node Sessions and press the right mouse button. Then select the Create Session... button of the context-sensitive menu.
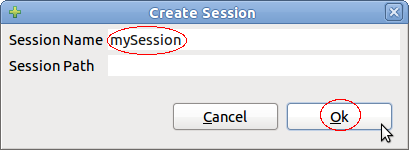
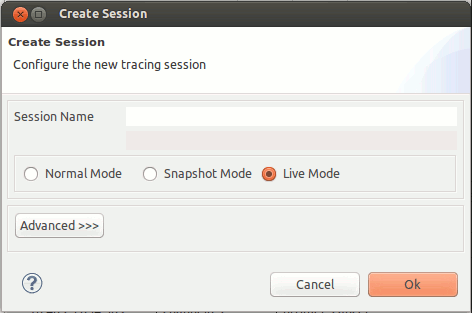
A dialog box will open for entering information about the session to be created.
Fill in the Session Name and optionally the Session Path and press Ok. Upon successful operation a new session will be created and added under the tree node Sessions.
Creating a Tracing Session With Advanced Options
LTTng Tools version v2.1.0 introduces the possibility to configure the trace output location at session creation time. The trace can be stored in the (tracer) local file system or can be transferred over the network.
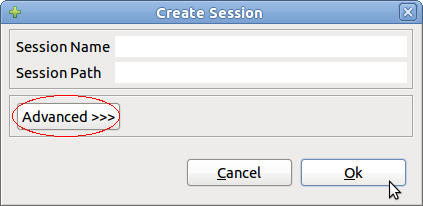
To create a tracing session and configure the trace output, open the trace session dialog as described in chapter Creating a Tracing Session. A dialog box will open for entering information about the session to be created.
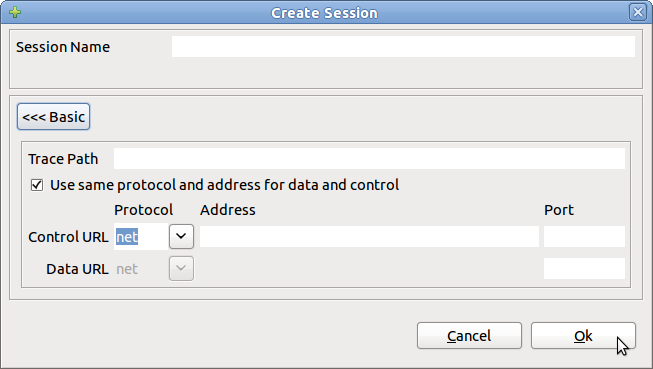
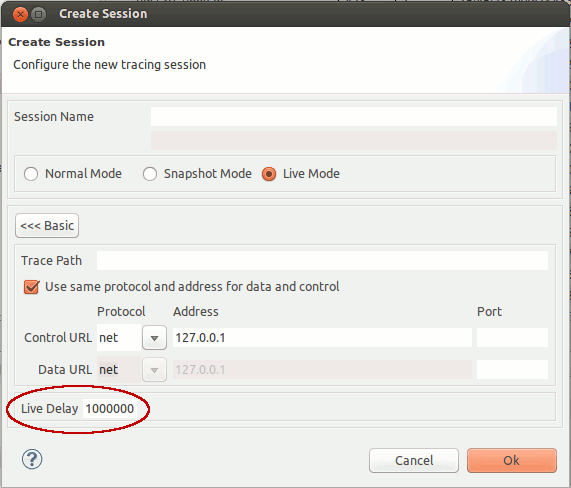
The button Advanced >>> will only show if the remote host has LTTng Tools v2.1.0 installed. To configure the trace output select the Advanced >>> button. The Dialog box will be shown new fields to configure the trace output location.
By default, the button Use same protocol and address for data and control is selected which allows to configure the same Protocol and Address for both data URL and control URL.
If button Use same protocol and address for data and control is selected the Protocol can be net for the default network protocol which is TCP (IPv4), net6 for the default network protocol which is TCP (IPv6) and file for the local file system. For net and net6 the port can be configured. Enter a value in Port for data and control URL or keep them empty for the default port to be used. Using file as protocol no port can be configured and the text fields are disabled.
If button Use same protocol and address for data and control is not selected the Protocol can be net for the default network protocol which is TCP (IPv4), net6 for the default network protocol which is TCP (IPv6), tcp for the network protocol TCP (IPv4) and tcp6 for the network protocol TCP (IPv6). Note that for net and net6 always the default port is used and hence the port text fields are disabled. To configure non-default ports use tcp or tcp6.
The text field Trace Path allows for specifying the path relative to the location defined by the relayd or relative to the location specified by the Address when using protocol file. For more information about the relayd see LTTng relayd User Manual in chapter References.
To create a session with advanced options, fill in the relevant parameters and press Ok. Upon successful operation a new session will be created and added under the tree node Sessions.
Creating a Snapshot Tracing Session
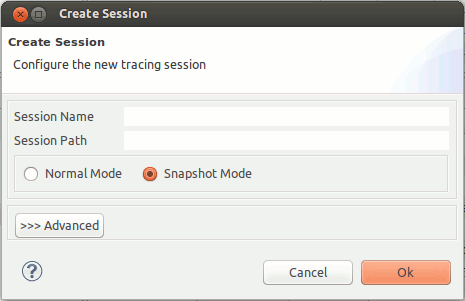
LTTng Tools version v2.3.0 introduces the possibility to create snapshot tracing sessions. After starting tracing the trace events are not stored on disk or over the network. They are only transfered to disk or over the network when the user records a snapshot. To create such a snapshot session, open the trace session dialog as described in chapter Creating a Tracing Session.
Fill in all necessary information, select the radio button for Snapshot Mode and press Ok. By default, the location for the snapshot output will be on the host where the host is located.
Refer to chapter Recording a Snapshot for how to create a snapshot.
Creating a Live Tracing Session
LTTng Tools version v2.4.0 introduces the possibility to create live tracing sessions. The live mode allows you to stream the trace and view it while it's being recorded. To create such a live session, open the trace session dialog as described in chapter Creating a Tracing Session.
In the advanced options, it is possible to set the Live Delay. The Live Delay is the delay in micro seconds before the data is flushed and streamed.
Fill in all necessary information, select the radio button for Live Mode and press Ok.
Enabling Channels - General
Enabling channels can be done using a session tree node when the domain hasn't be created in the session or, alternatively on a domain tree node of a session in case the domain is already available.
Enabling Channels On Session Level
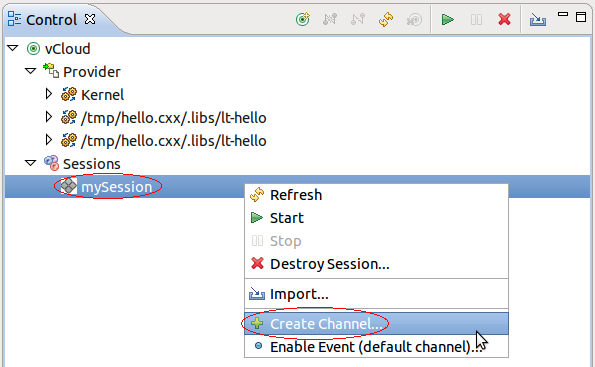
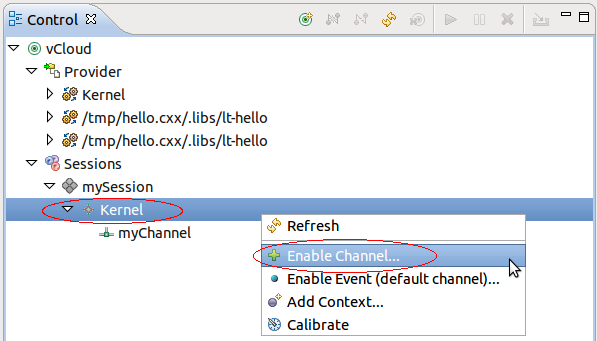
To enable a channel, select the tree node of the relevant session and press the right mouse button. Then select the Enable Channel... button of the context-sensitive menu.
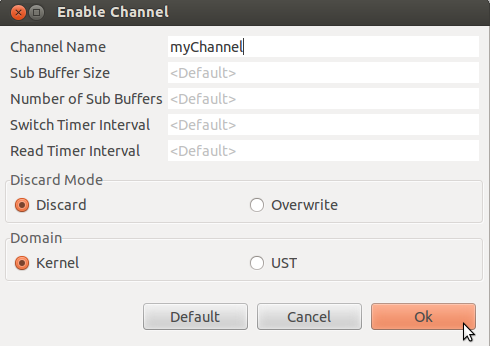
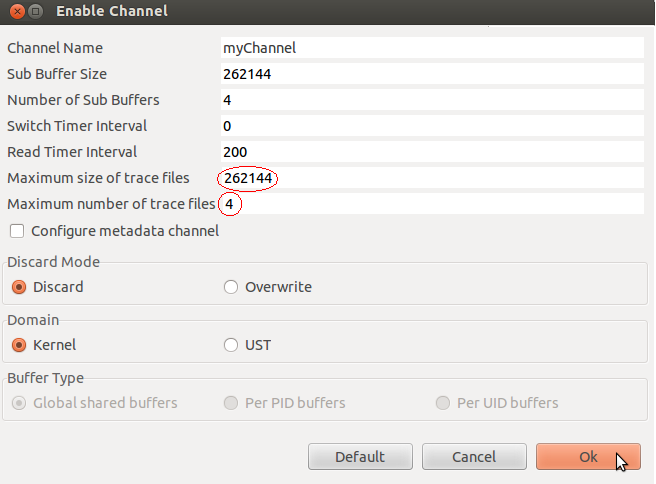
A dialog box will open for entering information about the channel to be created.
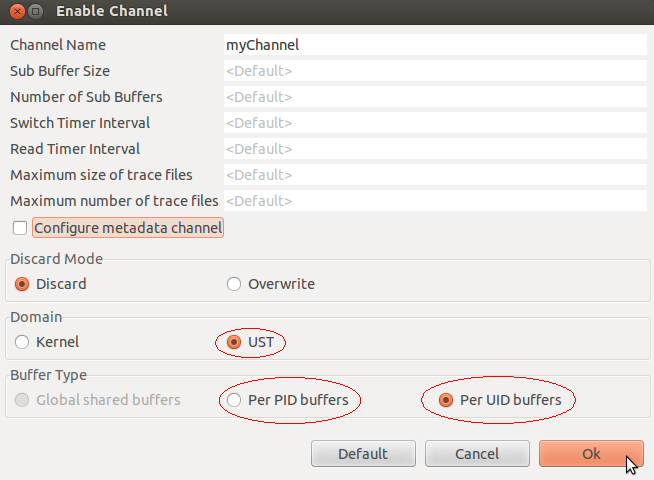
By default the domain Kernel is selected. To create a UST channel, select UST under the domain section. The label <Default> in any text box indicates that the default value of the tracer will be configured. To initialize the dialog box press button Default.
If required update the following channel information and then press Ok.
- Channel Name: The name of the channel.
- Sub Buffer size: The size of the sub-buffers of the channel (in bytes).
- Number of Sub Buffers: The number of sub-buffers of the channel.
- Switch Timer Interval: The switch timer interval.
- Read Timer Interval: The read timer interval.
- Discard Mode: Overwrite events in buffer or Discard new events when buffer is full.
Upon successful operation, the requested domain will be created under the session tree node as well as the requested channel will be added under the domain. The channel will be ENABLED.
Configuring Trace File Rotation
Since LTTng Tools v2.2.0 it is possible to set the maximum size of trace files and the maximum number of them. These options are located in the same dialog box that is used for enabling channels.
- Maximum size of trace files: The maximum size of trace files
- Maximum number of trace files: The maximum number of trace files
Configuring per UID and per PID Buffers (UST only)
Since LTTng Tools v2.2.0 it is possible to configure the type of buffers for UST application. It is now possible to choose between per UID buffers (per user ID) and per PID buffers (per process ID) using the dialog box for enabling channels.
- Per PID buffers: To activate the per PID buffers option for UST channels
- Per UID buffers: To activate the per UID buffers option for UST channels
If no buffer type is selected then the default value of the tracer will be configured.
Note that Global shared buffers is only for kernel channel and is pre-selected when Kernel is selected in the dalog box.
Configuring Periodical Flush for metadata Channel
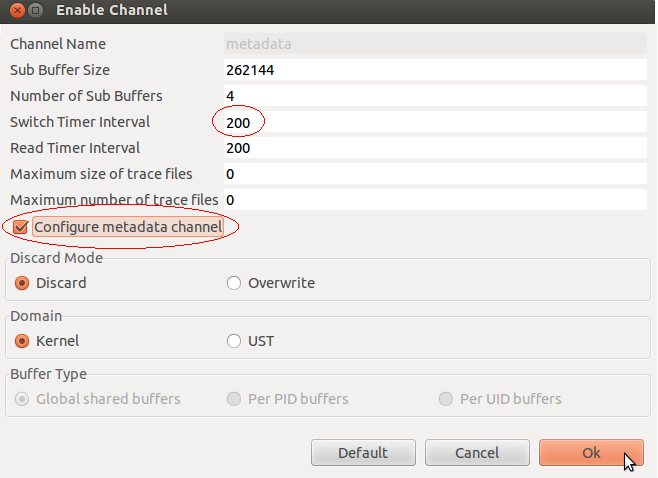
Since LTTng Tools v2.2.0 it is possible to configure periodical flush for the metadata channel. To set this, use the checkbox Configure metadata channel then fill the switch timer interval.
Enabling Channels On Domain Level
Once a domain is available, channels can be enabled directly using the domain. To enable a channel under an existing domain, select the tree node of the relevant domain and press the right mouse button. Then select the Enable Channel... button of the context-sensitive menu.
The dialog box for enabling channel will open for entering information about the channel to be created. Note that the domain is pre-selected and cannot be changed. Fill the relevant information and press Ok.
Enabling and Disabling Channels
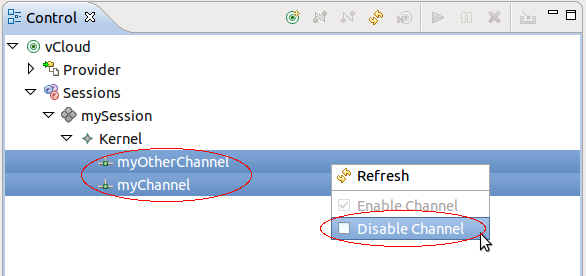
To disable one or more enabled channels, select the tree nodes of the relevant channels and press the right mouse button. Then select the Disable Channel menu item of the context-sensitive menu.
Upon successful operation, the selected channels will be DISABLED and the icons for the channels will be updated.
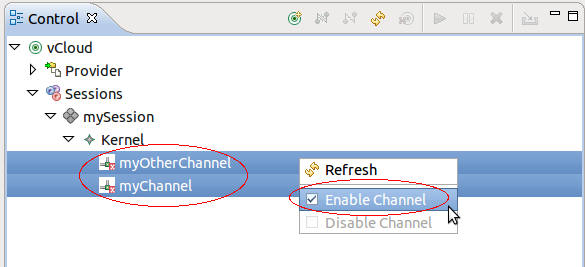
To enable one or more disabled channels, select the tree nodes of the relevant channels and press the right mouse button. Then select the Enable Channel menu item of the context-sensitive menu.
Upon successful operation, the selected channels will be ENABLED and the icons for the channels will be updated.
Enabling Events - General
Enabling events can be done using different levels in the tree node. It can be done on the session, domain level and channel level. For the case of session or domain, i.e. when no specific channels is assigned then enabling of events is done on the default channel with the name channel0 which created, if not already exists, by the LTTng tracer control on the server side.
Enabling Kernel Events On Session Level
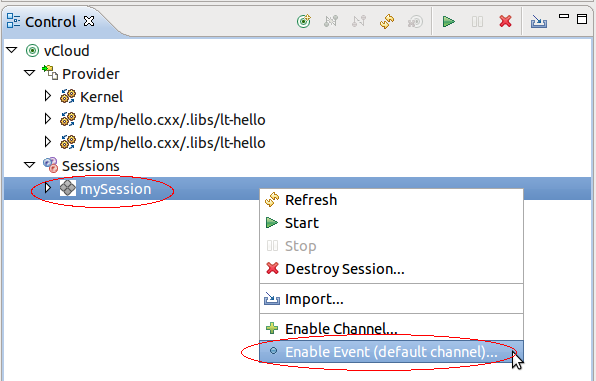
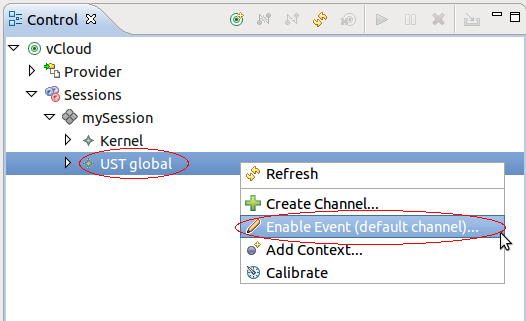
To enable events, select the tree node of the relevant session and press the right mouse button. Then select the Enable Event (default channel)... button of the context-sensitive menu.
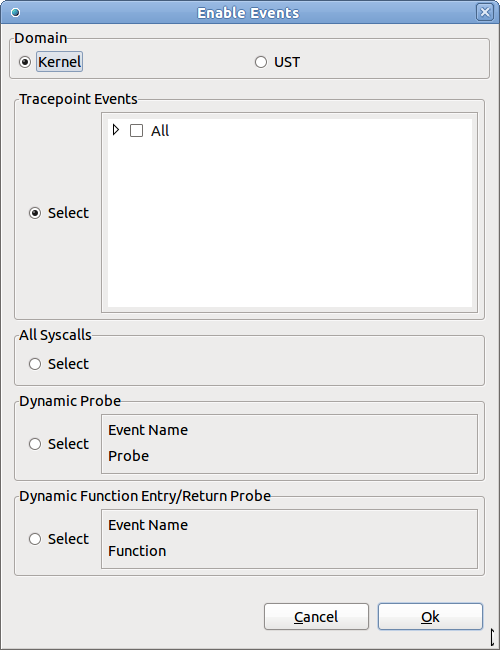
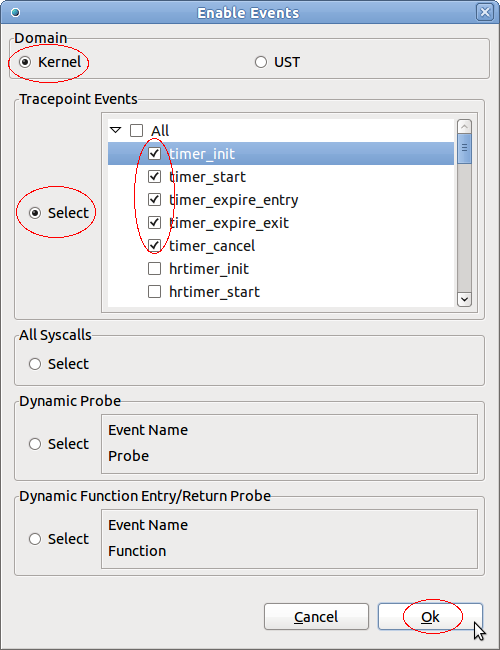
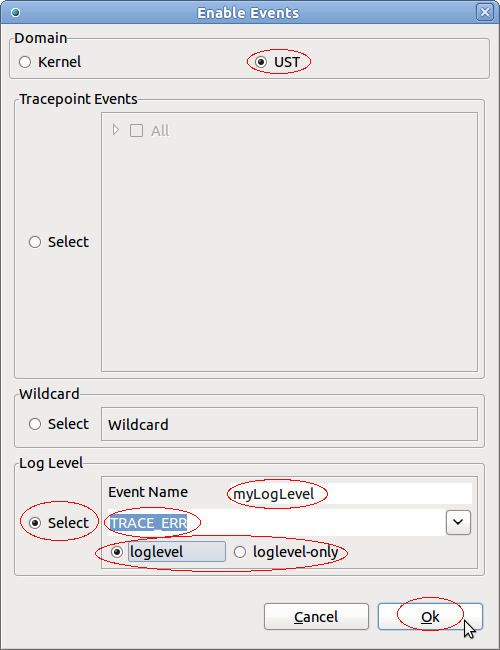
A dialog box will open for entering information about events to be enabled.
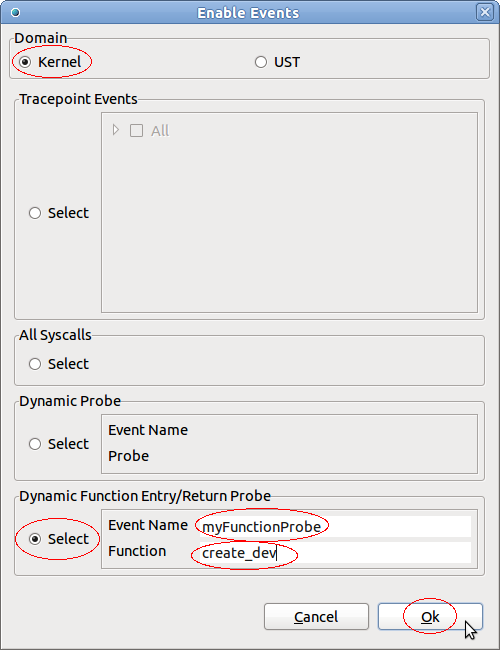
By default the domain Kernel is selected and the kernel specific data sections are created. From this dialog box kernel Tracepoint events, System calls (Syscall), a Dynamic Probe or a Dynamic Function entry/return probe can be enabled. Note that events of one of these types at a time can be enabled.
To enable Tracepoint events, first select the corresponding Select button, then select either all tracepoins (select All) or select selectively one or more tracepoints in the displayed tree of tracepoints and finally press Ok.
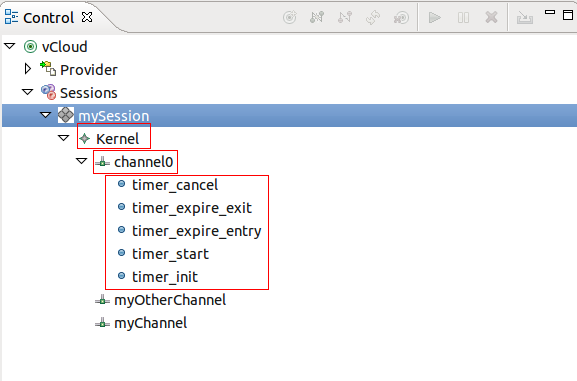
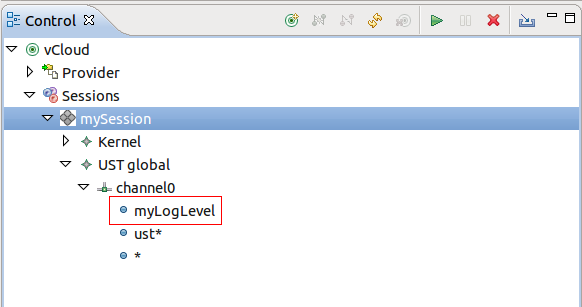
Upon successful operation, the domain Kernel will be created in the tree (if neccessary), the default channel with name "channel0" will be added under the domain (if necessary) as well as all requested events of type TRACEPOINT under the channel. The channel and events will be ENABLED.
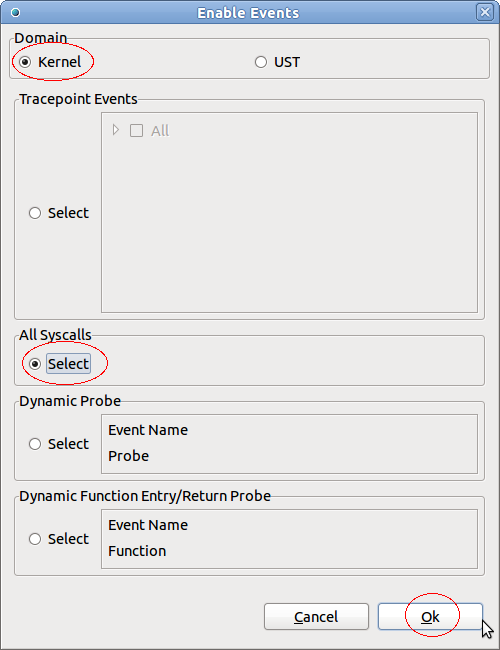
To enable all Syscalls, select the corresponding Select button and press Ok.
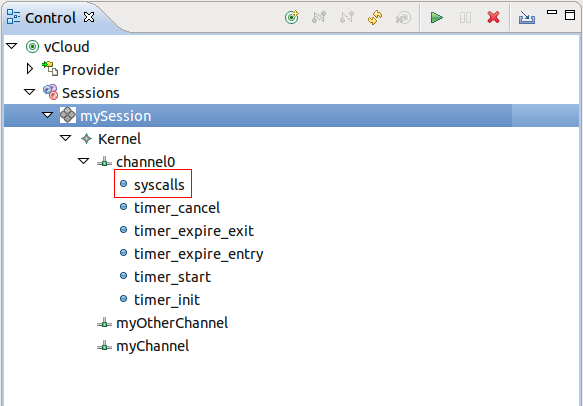
Upon successful operation, the event with the name syscalls and event type SYSCALL will be added under the default channel (channel0). If necessary the domain Kernel and the channel channel0 will be created.
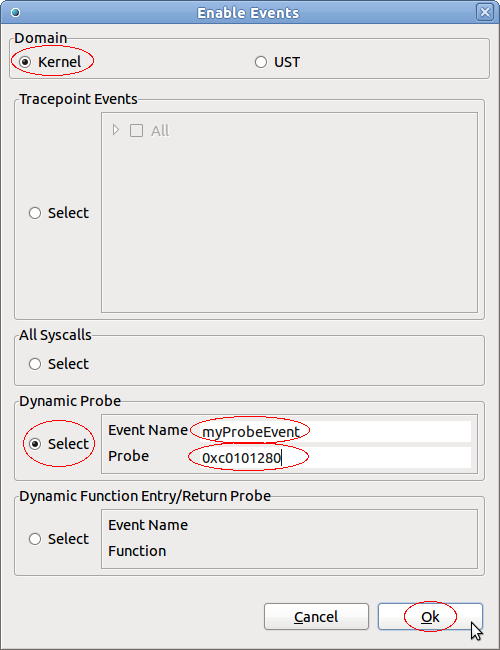
To enable a Dynamic Probe event, select the corresponding Select button, fill the Event Name and Probe fields and press Ok. Note that the probe can be an address, symbol or a symbol+offset where the address and offset can be octal (0NNN...), decimal (NNN...) or hexadecimal (0xNNN...).
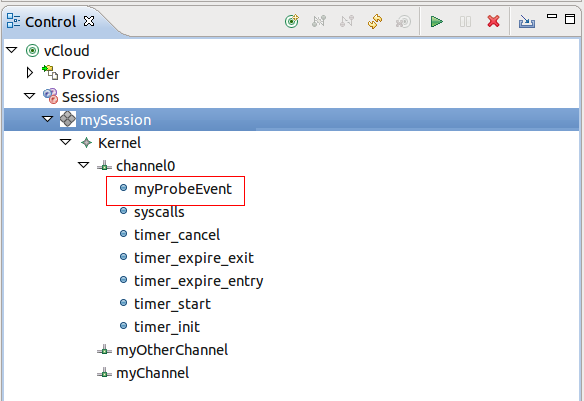
Upon successful operation, the dynamic probe event with the given name and event type PROBE will be added under the default channel (channel0). If necessary the domain Kernel and the channel channel0 will be created.
To enable a Dynamic Function entry/return Probe event, select the corresponding Select button, fill the Event Name and Function fields and press Ok. Note that the funtion probe can be an address, symbol or a symbol+offset where the address and offset can be octal (0NNN...), decimal (NNN...) or hexadecimal (0xNNN...).
Upon successful operation, the dynamic function probe event with the given name and event type PROBE will be added under the default channel (channel0). If necessary the domain Kernel and the channel channel0 will be created.
Enabling UST Events On Session Level
For enabling UST events, first open the enable events dialog as described in section Enabling Kernel Events On Session Level and select domain UST.
To enable Tracepoint events, first select the corresponding Select button, then select either all tracepoins (select All) or select selectively one or more tracepoints in the displayed tree of tracepoints and finally press Ok.
Upon successful operation, the domain UST global will be created in the tree (if neccessary), the default channel with name "channel0" will be added under the domain (if necessary) as well as all requested events under the channel. The channel and events will be ENABLED. Note that for the case that All tracepoints were selected the wildcard * is used which will be shown in the Control View as below.
For UST it is possible to enable Tracepoint events using a wildcard. To enable Tracepoint events with a wildcard, select first the corresponding Select button, fill the Wildcard field and press Ok.
Upon successful operation, the event with the given wildcard and event type TRACEPOINT will be added under the default channel (channel0). If necessary the domain UST global and the channel channel0 will be created.
For UST it is possible to enable Tracepoint events using log levels. To enable Tracepoint events using log levels, select first the corresponding Select button, select a log level from the drop down menu, fill in the relevant information (see below) and press Ok.
- Event Name: Name to display
- loglevel: To specify if a range of log levels (0 to selected log level) shall be configured
- loglevel-only: To specify that only the specified log level shall be configured
Upon successful operation, the event with the given event name and event type TRACEPOINT will be added under the default channel (channel0). If necessary the domain UST global and the channel channel0 will be created.
Enabling Events On Domain Level
Kernel events can also be enabled on the domain level. For that select the relevant domain tree node, click the right mouse button and the select Enable Event (default channel).... A new dialog box will open for providing information about the events to be enabled. Depending on the domain, Kernel or UST global, the domain specifc fields are shown and the domain selector is preselected and read-only.
To enable events for domain Kernel follow the instructions in section Enabling Kernel Events On Session Level, for domain UST global, see section Enabling UST Events On Session Level. The events will be add to the default channel channel0. This channel will be created by on the server side if neccessary.
Enabling Events On Channel Level
Kernel events can also be enabled on the channel level. If necessary, create a channel as described in sections Enabling Channels On Session Level or Enabling Channels On Domain Level.
Then select the relevant channel tree node, click the right mouse button and the select Enable Event.... A new dialog box will open for providing information about the events to be enabled. Depending on the domain, Kernel or UST global, the domain specifc fields are shown and the domain selector is preselected and read-only.
To enable events for domain Kernel follow the instructions in section Enabling Kernel Events On Session Level, for domain UST global Enabling UST Events On Session Level.
When enabling events on the channel level, the events will be add to the selected channel.
Enabling and Disabling Events
To disable one or more enabled events, select the tree nodes of the relevant events and click the right mouse button. Then select Disable Event menu item in the context-sensitive menu.
Upon successful operation, the selected events will be DISABLED and the icons for these events will be updated.
To enable one or more disabled events, select the tree nodes of the relevant events and press the right mouse button. Then select the Enable Event menu item of the context-sensitive menu.
Upon successful operation, the selected events will be ENABLED and the icons for these events will be updated.
Note: There is currently a limitation for kernel event of type SYSCALL. This kernel event can not be disabled. An error will appear when trying to disable this type of event. A work-around for that is to have the syscall event in a separate channel and disable the channel instead of the event.
Enabling Tracepoint Events From Provider
It is possible to enable events of type Tracepoint directly from the providers and assign the enabled event to a session and channel. Before doing that a session has to be created as described in section Creating a Tracing Session. Also, if other than default channel channel0 is required, create a channel as described in sections Creating Channels On Session Level or Creating Channels On Domain Level.
To assign tracepoint events to a session and channel, select the events to be enabled under the provider (e.g. provider Kernel), click right mouse button and then select Enable Event... menu item from the context sensitive menu.
A new display will open for defining the session and channel.
Select a session from the Session List drop-down menu, a channel from the Channel List drop-down menu and the press Ok. Upon successful operation, the selected events will be added to the selected session and channel of the domain that the selected provider belongs to. In case that there was no channel available, the domain and the default channel channel0 will be created for corresponding session. The newly added events will be ENABLED.
Configuring Filter Expression On UST Event Fields
Since LTTng Tools v2.1.0 it is possible to configure a filter expression on UST event fields. To configure a filter expression on UST event fields, open the enable event dialog as described in chapters Enabling UST Events On Session Level, Enabling Events On Domain Level or Enabling Events On Channel Level, select UST if needed, select the relevant Tracepoint event(s) and enter the filter expression in the Filter Expression text field.
Alternatively, open the dialog box for assigning events to a session and channel described in Enabling Tracepoint Events From Provider (for UST providers) and enter the filter expression in the Filter Expression text field.
For the syntax of the filter expression refer to the LTTng Tracer Control Command Line Tool User Manual of chapter References.
Adding Contexts to Channels and Events of a Domain
It is possible to add contexts to channels and events. Adding contexts on channels and events from the domain level, will enable the specified contexts to all channels of the domain and all their events. To add contexts on the domain level, select a domain, click right mouse button on a domain tree node (e.g. provider Kernel) and select the menu item Add Context... from the context-sensitive menu.
A new display will open for selecting one or more contexts to add.
The tree shows all available context that can be added. Select one or more context and the press Ok. Upon successful operation, the selected context will be added to all channels and their events of the selected domain.
Note: The LTTng UST tracer only supports contexts procname, pthread_id, vpid vtid. Adding any other contexts in the UST domina will fail.
Adding Contexts to All Events of a Channel
Adding contexts on channels and events from the channel level, will enable the specified contexts to all events of the selected channel. To add contexts on the channel level, select a channel, click right mouse button on a channel tree node and select the menu item Add Context... from the context-sensitive menu.
A new display will open for selecting one or more contexts to add. Select one or more contexts as described in chapter Adding Contexts to Channels and Events of a Domain. Upon successful operation, the selected context will be added to all channels and their events of the selected domain. Note that the LTTng 2.0 tracer control on the remote host doesn't provide a way to retrieve added contexts. Hence it's not possible to display the context information in the GUI.
Adding Contexts to an Event of a Specific Channel
Adding contexts to an event of a channel is only available in LTTng Tools versions v2.0.0-2.1.x. The menu option won't be visible for LTTng Tools version v2.2.0 or later. To add contexts on an event select an event of a channel, click right mouse button on the corresponding event tree node and select the menu item Add Context... from the context-sensitive menu.
A new display will open for selecting one or more contexts to add. Select one or more contexts as described in chapter Adding Contexts to Channels and Events of a Domain. Upon successful operation, the selected context will be added to the selected event.
Start Tracing
To start tracing, select one or more sessions to start in the Control View and press the Start button. Alternatively, press the right mouse button on the session tree nodes. A context-sensitive menu will show. Then select the Start menu item.
Upon successful operation, the tracing session will be ACTIVE and the icon of the session will be updated.
Recording a Snapshot
LTTng Tools version v2.3.0 introduces the possibility to create snapshot tracing sessions. After creating a snapshot session (see Creating a Snapshot Tracing Session) and starting tracing (see Start Tracing) it possible to record snapshots. To record a snapshot select one or more sessions and press the Record Snapshot button. Alternatively, press the right mouse button on the session tree nodes. A context-sensitive menu will show. Then select the Recored Snapshot menu item.
This action can be executed many times. It is possible to import the recorded snpshots to a tracing project. The trace session might be ACTIVE or INACTIVE for that. Refer to section Importing Session Traces to a Tracing Project on how to import a trace to a tracing project.
Stop Tracing
To stop tracing, select one or more sessions to stop in the Control View and press the Stop button. Alternatively, click the right mouse button on the session tree node. A context-sensitive menu will show. Then select the Stop menu item.
Upon successful operation, the tracing session will be INACTIVE and the icon of the session will be updated.
Destroying a Tracing Session
To destroy a tracing session, select one or more sessions to destroy in the Control View and press the Destroy button. Alternatively, click the right mouse button on the session tree node. A context-sensitive menu will show. Then select the Destroy... menu item. Note that the session has to be INACTIVE for this operation.
A confirmation dialog box will open. Click on Ok to destroy the session otherwise click on Cancel.
Upon successful operation, the tracing session will be destroyed and removed from the tree.
Refreshing the Node Information
To refresh the remote host information, select any node in the tree of the Control View and press the Refresh button. Alternatively, click the right mouse button on any tree node. A context-sensitive menu will show. Then select the Refresh menu item.
Upon successful operation, the tree in the Control View will be refreshed with the remote host configuration.
Quantifing LTTng overhead (Calibrate)
The LTTng calibrate command can be used to find out the combined average overhead of the LTTng tracer and the instrumentation mechanisms used. For now, the only calibration implemented is that of the kernel function instrumentation (kretprobes). To run the calibrate command, select the a domain (e.g. Kernel), click the right mouse button on the domain tree node. A context-sensitive menu will show. Select the Calibrate menu item.
Upon successful operation, the calibrate command is executed and relevant information is stored in the trace. Note: that the trace has to be active so that to command as any effect.
Importing Session Traces to a Tracing Project
To import traces from a tracing session, select the relevant session and click on the Import Button. Alternatively, click the right mouse button on the session tree node and select the menu item Import... from the context-sensitive menu.
A new display will open for selecting the traces to import.
By default all traces are selected. A default project with the name Remote is selected which will be created if necessary. Update the list of traces to be imported, if necessary, by selecting and deselecting the relevant traces in the tree viewer. Use buttons Select All or Deselect All to select or deselect all traces. Also if needed, change the tracing project from the Available Projects combo box. Select the Overwrite button (Overwrite existing trace without warning) if required. Then press button Ok. Upon successful import operation the selected traces will be stored in the Traces directory of the specified tracing project. The session directory structure as well as the trace names will be preserved in the destination tracing project. For Kernel traces the trace type LTTng Kernel Trace and for UST traces the trace type LTTng UST Trace will be set. From the Project Explorer view, the trace can be analyzed further.
Note: If the overwrite button (Overwrite existing trace without warning) was not selected and a trace with the same name of a trace to be imported already exists in the destination directory of the project, then a new confirmation dialog box will open.
To Overwrite select the Overwrite Button and press Ok.
If the existing trace should not be overwritten select, then select the Rename option of the confirmation dialog box above, enter a new name and then press Ok.
Importing Network Traces to a Tracing Project
Since LTTng Tools v2.1.0 it is possible to store traces over the network. To import network traces, execute the Import action as described in chapter Importing Session Traces to a Tracing Project. For network traces the Import Trace Wizard will be displayed. Follow the instructions in chapter Importing to import the network traces of the current session.
Properties View
The Control View provides property information of selected tree component. Depending on the selected tree component different properties are displayed in the property view. For example, when selecting the node level the property view will be filled as followed:
List of properties:
- Host Properties
- Connection Name: The alias name to be displayed in the Control View.
- Host Name: The IP address or DNS name of the remote system.
- State: The state of the connection (CONNECTED, CONNECTING, DISCONNNECTING or DISCONNECTED).
- Kernel Provider Properties
- Provider Name: The name of the provider.
- UST Provider Properties
- Provider Name: The name of the provider.
- Process ID: The process ID of the provider.
- Event Properties (Provider)
- Event Name: The name of the event.
- Event Type: The event type (TRACEPOINT only).
- Fields: Shows a list of fields defined for the selected event. (UST only, since support for LTTng Tools v2.1.0)
- Log Level: The log level of the event.
- Session Properties
- Session Name: The name of the Session.
- Session Path: The path on the remote host where the traces will be stored. (Not shown for snapshot sessions).
- State: The state of the session (ACTIVE or INACTIVE)
- Snapshot ID: The snapshot ID. (Only shown for snapshot sessions).
- Snapshot Name: The name of the snapshot output configuration. (Only shown for snapshot sessions).
- Snapshot Path: The path where the snapshot session is located. (Only shown for snapshot sessions).
- Domain Properties
- Domain Name: The name of the domain.
- Buffer Type: The buffer type of the domain.
- Channel Properties
- Channel Name: The name of the channel.
- Number of Sub Buffers: The number of sub-buffers of the channel.
- Output type: The output type for the trace (e.g. splice() or mmap())
- Overwrite Mode: The channel overwrite mode (true for overwrite mode, false for discard)
- Read Timer Interval: The read timer interval.
- State: The channel state (ENABLED or DISABLED)
- Sub Buffer size: The size of the sub-buffers of the channel (in bytes).
- Switch Timer Interval: The switch timer interval.
- Event Properties (Channel)
- Event Name: The name of the event.
- Event Type: The event type (TRACEPOINT, SYSCALL or PROBE).
- Log Level: The log level of the event. (For LTTng Tools v2.4.0 or later, <= prior the log level name will indicate a range of log levels and == a single log level.)
- State: The Event state (ENABLED or DISABLED)
- Filter: Shows with filter if a filter expression is configured else property Filter is omitted. (since support for LTTng Tools v2.1.0)
LTTng Tracer Control Preferences
Serveral LTTng 2.0 tracer control preferences exists which can be configured. To configure these preferences, select Window->Preferences from the top level menu. The preference display will open. Then select Tracing->LTTng Tracer Control Preferences. This preferences page allows the user to specify the tracing group of the user and to specify the command execution timeout as well as it allows the user to configure the logging of LTTng 2.0 tracer control commands and results to a file.
To change the tracing group of the user which will be specified on each command line, enter the new group name in the Tracing Group text field and click button OK. The default tracing group is tracing and can be restored by pressing the Restore Defaults button.
To configure logging of trace control commands and the corresponding command result to a file, selected the button Logging. To append to an existing log file, select the Append button. Deselect the Append button to overwrite any existing log file. It's possible to specify a verbose level. There are 3 levels with inceasing verbosity from Level 1 to Level 3. To change the verbosity level, select the relevant level or select None. If None is selected only commands and command results are logged. Then press on button OK. The log file will be stored in the users home directory with the name lttng_tracer_control.log. The name and location cannot be changed. To reset to default preferences, click on the button Restore Defaults.
To configure the LTTng command execution timeout, enter a timeout value into the text field Command Timeout (in seconds) and press on button OK. To reset to the default value of 15 seconds, click on the button Restore Defaults.
LTTng Kernel Analysis
Historically, LTTng was developped to trace the Linux kernel and, over time, a number of kernel-oriented analysis views were developped and organized in a perspective.
This section presents a description of the LTTng Kernel Perspective.
LTTng Kernel Perspective
The LTTng Kernel perspective is built upon the Tracing Perspective, re-organizes them slightly and adds the following views:
- Control Flow View - to visualize processes state transitions
- Resources View - to visualize system resources state transitions
- LTTng Tracer Control - to configure LTTng tracing sessions remotely
The perspective can be opened from the Eclipse Open Perspective dialog (Window > Open Perspective... > Other).
Control Flow View
The Control Flow view is a LTTng-specific view that shows per-process events graphically. The LTTng Kernel analysis is executed the first time a LTTng Kernel is opened. After opening the trace, the element Control Flow is added under the LTTng Kernel Analysis tree element in the Project Explorer. To open the view, double-click the Control Flow tree element.
Alternatively, select Control Flow under LTTng within the Show View window (Window -> Show View -> Other...):
You should get something like this:
The view is divided into the following important sections: process tree and information, control flow and the toolbar.
The following sections provide detailed information for each part of the Control Flow View.
Process tree and information
Processes are organized as a tree within this view. This way, child and parent processes are easy to identify.
The layout is based on the states computed from the trace events.
A given process may be shown at different places within the tree since the nodes are unique (TID, birth time) couples. This means that if process B of parent A dies, you'll still see it in the tree. If process A forks process B again, it will be shown as a different node since it won't have the same birth time (and probably not the same TID). This has the advantage that the tree, once loaded, never changes: horizontal scrolling within the control flow remains possible.
The TID column shows the process node's thread ID and the PTID column shows its parent thread ID (nothing is shown if the process has no parent).
Control flow
This part of the Control Flow View is probably the most interesting one. Using the mouse, you can navigate through the trace (go left, right) and zoom on a specific region to inspect its details.
The colored bars you see represent states for the associated process node. When a process state changes in time, so does the color. For state SYSCALL the name of the system call is displayed in the state bar. States colors legend is available through a toolbar button:
This dark yellow is what you'll see most of the time since scheduling puts processes on hold while others run.
The vertical blue line with T1 above it is the current selection indicator. When a time range is selected, the region between the begin and end time of the selection will be shaded and two lines with T1 and T2 above will be displayed. The time stamps corresponding to T1, T2 and their delta are shown in the status line when the mouse is hovering over the control flow.
Arrows can be displayed that follow the execution of each CPU across processes. The arrows indicate when the scheduler switches from one process to another for a given CPU. The CPU being followed is indicated on the state tooltip. When the scheduler switches to and from the idle process, the arrow skips to the next process which executes on the CPU after the idle process. Note that an appropriate zoom level is required for all arrows to be displayed.
The display of arrows is optional and can be toggled using the Hide Arrows toolbar button. It is also possible to follow a CPU's execution across state changes and the scheduler's process switching using the Follow CPU Forward/Backward toolbar buttons.
Using the mouse
The states flow is usable with the mouse. The following actions are set:
- left-click: select a time or time range begin time
- Shift-left-click: select a time range end time
- left-drag horizontally: select a time range or change the time range begin or end time
- middle-drag or Ctrl-left-drag horizontally: pan left or right
- right-drag horizontally: zoom region
- click on a colored bar: the associated process node is selected and the current time indicator is moved where the click happened
- mouse wheel up/down: scroll up or down
- Ctrl-mouse wheel up/down: zoom in or out
- drag the time ruler horizontally: zoom in or out with fixed start time
- double-click the time ruler: reset zoom to full range
When the current time indicator is changed (when clicking in the states flow), all the other views are synchronized. For example, the Events Editor will show the event matching the current time indicator. The reverse behaviour is also implemented: selecting an event within the Events View will update the Control Flow View current time indicator.
Incomplete regions
You'll notice small dots over the colored bars at some places:
Those dots mean the underlying region is incomplete: there's not enough pixels to view all the events. In other words, you have to zoom in.
When zooming in, small dots start to disappear:
When no dots are left, you are viewing all the events and states within that region.
Zoom region
To zoom in on a specific region, right-click and drag in order to draw a time range:
The states flow horizontal space will only show the selected region.
Tooltips
Hover the cursor over a colored bar and a tooltip will pop up:
The tooltip indicates:
- the process name
- the pointed state name
- the CPU (if applicable)
- the system call name (if applicable)
- the pointed state date and start/stop times
- the pointed state duration (seconds)
Toolbar
The Control Flow View toolbar, located at the top right of the view, has shortcut buttons to perform common actions:
Resources View
This view is specific to LTTng kernel traces. The LTTng Kernel analysis is executed the first time a LTTng Kernel is opened. After opening the trace, the element Resources is added under the LTTng Kernel Analysis tree element of the Project Explorer. To open the view, double-click the Resources tree element.
Alternatively, go in Window -> Show View -> Other... and select LTTng/Resources in the list.
This view shows the state of system resources i.e. if changes occured during the trace either on CPUs, IRQs or soft IRQs, it will appear in this view. The left side of the view present a list of resources that are affected by at least one event of the trace. The right side illustrate the state in which each resource is at some point in time. For state USERMODE it also prints the process name in the state bar. For state SYSCALL the name of the system call is displayed in the state region.
Just like other views, according to which trace points and system calls are activated, the content of this view may change from one trace to another.
Each state are represented by one color so it is faster to say what is happening.
To go through the state of a resource, you first have to select the resource and the timestamp that interest you. For the latter, you can pick some time before the interesting part of the trace.
Then, by selecting Next Event, it will show the next state transition and the event that occured at this time.
This view is also synchronized with the others : Histogram View, Events Editor, Control Flow View, etc.
See Control Flow View's Using the mouse and Zoom region.
Incomplete regions
See Control Flow View's Incomplete regions.
Toolbar
The Resources View toolbar, located at the top right of the view, has shortcut buttons to perform common actions:
LTTng CPU Usage View
The CPU Usage analysis and view is specific to LTTng Kernel traces. The CPU usage is derived from a kernel trace as long as the sched_switch event was enabled during the collection of the trace. This analysis is executed the first time that the CPU Usage view is opened after opening the trace. To open the view, double-click on the CPU Usage tree element under the LTTng Kernel Analysis tree element of the Project Explorer.
Now, the CPU Usage view will show:
The view is divided into the following important sections: Process Information and the CPU Usage Chart.
Process Information
The Process Information is displayed on the left side of the view and shows all threads that were executing on all available CPUs in the current time range. For each process, it shows in different columns the thread ID (TID), process name (Process), the average (%) execution time and the actual execution time (Time) during the current time range. It shows all threads that were executing on the CPUs in the current time range.
CPU Usage Chart
The CPU Usage Chart on the right side of the view, plots the total time spent on all CPUs of all processes and the time of the selected process.
Using the mouse
The CPU Usage chart is usable with the mouse. The following actions are set:
- left-click: select a time or time range begin time
- Shift-left-click: select a time range end time
- left-drag horizontally: select a time range or change the time range begin or end time
- middle-drag: pan left or right
- right-drag horizontally: zoom region
- mouse wheel up/down: zoom in or out
Tooltips
Hover the cursor over a line of the chart and a tooltip will pop up with the following information:
- time: current time of mouse position
- Total: The total CPU usage
LTTng Kernel Events Editor
The LTTng Kernel Events editor is the plain TMF Events Editor, except that it provides its own specialized viewer to replace the standard one. In short, it has exactly the same behaviour but the layout is slightly different:
- Timestamp: the event timestamp
- Channel: the event channel (data collector)
- Event Type: the event type (or kernel marker)
- Content: the raw event content
LTTng-UST Analyses
The Userspace traces are taken on an application level. With kernel traces, you know what events you will have as the domain is known and cloistered. Userspace traces can contain pretty much anything. Some analyses are offered if certain events are enabled.
Call Stack View
The Call Stack view allows the user to visualize the call stack per thread over time, if the application and trace provide this information.
To open this view go in Window -> Show View -> Other... and select Tracing/Call Stack in the list. The view shows the call stack information for the currently selected trace. Conversely, you can select a trace and expand it in the Project Explorer then expand LTTng-UST CallStack Analysis (the trace must be loaded) and open Call Stack.
The table on the left-hand side of the view shows the threads and call stack. The function name, depth, entry and exit time and duration are shown for the call stack at the selected time.
Double-clicking on a function entry in the table will zoom the time graph to the selected function's range of execution.
The time graph on the right-hand side of the view shows the call stack state graphically over time. The function name is visible on each call stack event if size permits. The color of each call stack event is randomly assigned based on the function name, allowing for easy identification of repeated calls to the same function.
Clicking on the time graph will set the current time and consequently update the table with the current call stack information.
Shift-clicking on the time graph will select a time range. When the selection is a time range, the begin time is used to update the stack information.
Double-clicking on a call stack event will zoom the time graph to the selected function's range of execution.
Clicking the Select Next Event or Select Previous Event or using the left and right arrows will navigate to the next or previous call stack event, and select the function currently at the top of the call stack.
Clicking the Import Mapping File (![]() ) icon will open a file selection dialog, allowing you to import a text file containing mappings from function addresses to function names. If the callstack provider for the current trace type only provides function addresses, a mapping file will be required to get the function names in the view. See the following sections for an example with LTTng-UST traces.
) icon will open a file selection dialog, allowing you to import a text file containing mappings from function addresses to function names. If the callstack provider for the current trace type only provides function addresses, a mapping file will be required to get the function names in the view. See the following sections for an example with LTTng-UST traces.
Using the Callstack View with LTTng-UST traces
There is support in the LTTng-UST integration plugin to display the callstack of applications traced with the liblttng-ust-cyg-profile.so library (see the liblttng-ust-cyg-profile man page for additional information). To do so, you need to:
- Recompile your application with "-g -finstrument-functions".
- Add the vtid and procname contexts to your trace session. See the Adding Contexts to Channels and Events of a Domain section. Or if using the command-line:
-
lttng add-context -u -t vtid -t procname
-
- Preload the liblttng-ust-cyg-profile library when running your program:
-
LD_PRELOAD=/usr/lib/liblttng-ust-cyg-profile.so ./myprogram
-
Once you load the resulting trace, making sure it's set to the Common Trace Format - LTTng UST Trace type, the Callstack View should be populated with the relevant information. However, since GCC's cyg-profile instrumentation only provides function addresses, and not names, an additional step is required to get the function names showing in the view. The following section explains how to do so.
Importing a function name mapping file for LTTng-UST traces
If you followed the steps in the previous section, you should have a Callstack View populated with function entries and exits. However, the view will display the function addresses instead of names in the intervals, which are not very useful by themselves. To get the actual function names, you need to:
- Generate a mapping file from the binary, using:
-
nm myprogram > mapping.txt
-
- Click the Import Mapping File (
 ) button in the Callstack View, and select the mapping.txt file that was just created.
The view should now update to display the function names instead. Make sure the binary used for taking the trace is the one used for this step too (otherwise, there is a good chance of the addresses not being the same).
Memory Usage
The Memory Usage view allows the user to visualize the active memory usage per thread over time, if the application and trace provide this information.
The view shows the memory consumption for the currently selected trace.
The time chart plots heap memory usage graphically over time. There is one line per process, unassigned memory usage is mapped to "Other".
In this implementation, the user needs to trace while hooking the liblttng-ust-libc-wrapper by running LD_PRELOAD=liblttng-ust-libc-wrapper.so <exename>. This will add tracepoints to memory allocation and freeing to the heap, NOT shared memory or stack usage. If the contexts vtid and procname are enabled, then the view will associate the heap usage to processes. As detailed earlier, to enable the contexts, see the Adding Contexts to Channels and Events of a Domain section. Or if using the command-line:
-
lttng add-context -u -t vtid -t procname
If thread information is available the view will look like this:
If thread information is not available it will look like this:
The view allows selection of a specific time by left-clicking on a point in the chart. Left mouse dragging will select a time range. Right mouse dragging on the area will zoom in on that window. Middle mouse dragging will move the display window. Mouse wheel operations will zoom in and out also.
Please note this view will not show shared memory or stack memory usage.
Trace synchronization
It is possible to synchronize traces from different machines so that they have the same time reference. Events from the reference trace will have the same timestamps as usual, but the events from traces synchronized with the first one will have their timestamps transformed according to the formula obtained after synchronization.
Obtain synchronizable traces
To synchronize traces from different machines, they need to exchange packets through the network and have events enabled such that the data can be matched from one trace to the other. For now, only TCP packets can be matched between two traces.
LTTng traces that can be synchronized are obtained using one of two methods (both methods are compatible):
LTTng-module network tracepoint with complete data
The tracepoints net_dev_queue and netif_receive_skb will be used for synchronization. Both tracepoints are available in lttng-modules since version 2.2, but they do not contain sufficient data to be used to synchronize traces.
An experimental branch introduces this extra data: lttng-modules will need to be compiled by hand.
Obtain the source code for the experimental lttng-modules
   # git clone git://git.dorsal.polymtl.ca/~gbastien/lttng-modules.git
   # cd lttng-modules
Checkout the net_data_experimental branch, compile and install lttng-modules as per the lttng-modules documentation
   # git checkout net_data_experimental
   # make
   # sudo make modules_install
   # sudo depmod -a
This experimental branch adds IP, IPv6 and TCP header data to the tracepoints. Packets received and sent with other protocols do not have this extra header data, but all packets are captured.
LTTng-modules addons kernel module with dynamic tracepoints
This method adds dynamic instrumentation on TCP packets via extra kernel modules. Only TCP packets are captured.
Obtain the source code, along with lttng-modules
   # git clone https://github.com/giraldeau/lttng-modules.git
   # cd lttng-modules
Checkout the addons branch, compile and install lttng-modules as per the lttng-modules documentation. The make command will fail at first with a message about the unset SYSMAP variable. Instructions on how to generate a System.map are mentioned in the error message.
   # git checkout addons
   # make
   # (follow the instructions to obtain the System.map file and set the SYSMAP variable)
   # make
   # sudo make modules_install
   # sudo depmod -a
The lttng-addons modules must be inserted manually for the TCP tracepoints to be made available.
   # sudo modprobe lttng-addons
   # sudo modprobe lttng-probe-addons
The following tracepoints will be available
   # sudo lttng list -k
   Kernel events:
   -------------
     ...
     inet_sock_create (loglevel: TRACE_EMERG (0)) (type: tracepoint)
     inet_sock_delete (loglevel: TRACE_EMERG (0)) (type: tracepoint)
     inet_sock_clone (loglevel: TRACE_EMERG (0)) (type: tracepoint)
     inet_accept (loglevel: TRACE_EMERG (0)) (type: tracepoint)
     inet_connect (loglevel: TRACE_EMERG (0)) (type: tracepoint)
     inet_sock_local_in (loglevel: TRACE_EMERG (0)) (type: tracepoint)
     inet_sock_local_out (loglevel: TRACE_EMERG (0)) (type: tracepoint)
     ...
The ones used for trace synchronization are inet_sock_local_in and inet_sock_local_out.
Synchronize traces in TMF
In order to synchronize traces, create a new experiment and select all traces that need to be synchronized. Right-click on the experiment and select Synchronize traces. For each trace whose time needs to be transformed, a new trace named as the original but followed by a '_' will be created with the transformed timestamps, and the original trace will be replaced in the experiment. The original trace can still be accessed under the Traces folder.
When opening the experiment now, all the views will be synchronized. The following screenshot presents the differences in the filtered Control Flow View before and after the time synchronization.
Information on the quality of the synchronization, the timestamp transformation formula and some synchronization statistics can be visualized in the Synchronization view. To open the Synchronization view, use the Eclipse Show View dialog (Window -> Show View -> Other...). Then select Synchronization under Tracing.
Time offsetting
The time offsetting feature allows the user to apply a fixed offset to all event timestamps in a trace. It can be used, for example, to adjust the start time of a trace, or to manually align the timestamp of events from different traces.
Basic mode
If the time offset to apply is known, it can be applied directly to the trace. In the Project Explorer view, select a trace, right-click and select Apply Time Offset.... It is also possible to select multiple traces, experiments or trace folders. All contained traces will be selected.
The dialog opens, in Basic mode.
Enter a time offset to apply in the Offset in seconds column, with or without decimals. Then press the OK button.
The time offset is applied to the trace and can be seen in the time offset property in the Properties view when the trace is selected.
The applied time offset is added to any time offset or time transformation formula currently set for the trace, and the resulting offset replaces any previous setting.
Advanced mode
The time offset can also be computed using selected trace events or manually entered timestamps. After selecting one or more traces in the Project Explorer view, right-click and select Apply Time Offset.... In the opened dialog, select the Advanced button.
Double-clicking a trace name will open the trace in an editor. The Reference Time will be set to the trace start time. Selecting any event in the trace editor will set the Reference Time for that trace to the event's timestamp.
Selecting an event or a time in any view or editor that supports time synchronization will set the Target Time for every trace in the dialog.
Pressing the << button will compute the time offset that should be applied in order to make the reference time align to the target time, provided that both fields are set.
The Reference Time, Target Time and Offset in seconds fields can also be edited and entered manually.
To synchronize two events from different traces, first select an event in the trace to which the time offset should be applied, which will set its Reference Time field.
Then select a corresponding event in the second trace, which will set the Target Time field for the first trace.
Finally, press the << button, which will automatically compute the time offset that should be applied in order to make the first event's timestamp align to the second event's timestamp.
Then press the OK button. The time offset is applied to the trace and can be seen in the time offset property in the Properties view when the trace is selected.
The applied time offset is added to any time offset or time transformation formula currently set for the trace, and the resulting offset replaces any previous setting.
Clearing time offset
The time offset previously applied can be cleared to reset the trace to its original timestamps. In the Project Explorer view, select a trace, right-click and select Clear Time Offset. It is also possible to select multiple traces, experiments or trace folders. All contained traces will be affected.
The time offset or any time transformation formula will be deleted.
Timestamp formatting
Most views that show timestamps are displayed in the same time format. The unified timestamp format can be changed in the Preferences page. To get to that page, click on Window -> Preferences -> Tracing -> Time Format. Then a window will show the time format preferences.
The preference page has several subsections:
- Current Format a format string generated by the page
- Sample Display an example of a timestamp formatted with the Current Format string.
- Time Zone the time zone to use when displaying the time. The value Local time corresponds to the local, system-configured, time zone.
- Data and Time format how to format the date (days/months/years) and the time (hours/minutes/seconds)
- Sub-second format how much precision is shown for the sub-second units
- Date delimiter the character used to delimit the date units such as months and years
- Time delimiter the character to separate super-second time units such as seconds and minutes
- Sub-Second Delimiter the character to separate the sub-second groups such as milliseconds and nanoseconds
- Restore Defaults restores the system settings
- Apply apply changes
This will update all the displayed timestamps.
Data driven analysis
It is possible to define custom trace analyses and a way to view them in an XML format. These kind of analyses allow doing more with the trace data than what the default analyses shipped with TMF offer. It can be customized to a specific problem, and fine-tuned to show exactly what you're looking for.
Importing an XML file containing analysis
If you already have an XML file defining state providers and/or views, you can import it in your TMF workspace by right-clicking on the Traces or Experiments folder and selecting Import XML Analysis.
You will be prompted to select the file. It will be validated before importing it and if successful, the new analysis and views will be shown under the traces for which they apply. You will need to close any already opened traces and re-open them before the new analysis can be executed.
Right now, there is no way to "unimport" analyses from within the application. A UI to manage the imported analyses is currently being worked on. In the meantime, you can navigate to your workspace directory, and delete the files in .metadata/.plugins/org.eclipse.linuxtools.tmf.analysis.xml.core/xml_files .
Defining XML components
To define XML components, you need to create a new XML file and use the XSD that comes with the XML plugin.
For now, the XSD is only available through the source code in org.eclipse.linuxtools.tmf.analysis.xml.core/src/org/eclipse/linuxtools/tmf/analysis/xml/core/module/xmlDefinition.xsd.
An empty file, with no content yet would look like this:
<?xml version="1.0" encoding="UTF-8"?>
<tmfxml xmlns:xsi="http://www.w3.org/2001/XMLSchema-instance"
    xsi:noNamespaceSchemaLocation="xmlDefinition.xsd">

</tmfxml>
Defining an XML state provider
The state system is a component of TMF which can track the states of different elements of the system over the duration of a trace. To build this state system, events have to go chronologically through a state provider, which defines what changes are caused by the event to the system.
The state system obtained by the state provider can then be used to populate data-driven views without having to re-read the trace, or to query specific timestamps in the trace without needing to access the trace file.
Definitions and example
Before we start, we'll define a few terms used in the following sections. The interested reader should read the Tmf Developer Guide for more complete description of the state system and state providers.
- The state system can be viewed as a model of the system, where the different elements (attributes) can be seen as a tree, and their evolution (states) is tracked through time.
- Attribute: An attribute is the smallest element of the model that can be in any particular state. Since many attributes may have the same name, each attribute is represented by its full path in the attribute tree.
- State: A state is a value assigned to an attribute at a given time. Each model has its own state values.
- Attribute tree: Elements in the model can be placed in a tree-like structure, for logical grouping. Each element in the tree can have both children and a state. Also, the tree is just a logical structure, all elements may be top-level elements.
- State history: Whereas the attribute tree may be seen as the first dimension of the state system, the state history is the second dimension, over time. It tracks the intervals at which an attribute was in a given state.
In the following sections, we'll use an example trace with the following events:
- start(number): A new task with ID 'number' just started.
- execute(number, fct_name): The task with ID 'number' is executing a critical section named 'fct_name'.
- wait(number): The task with ID 'number' cannot execute a critical section and needs to wait for it.
- exec_end(fct_name): A task finished executing the critical section named 'fct_name'.
- stop(number): The task with ID 'number' has just finished.
Determining the state system structure
The first thing to do is to determine the attribute tree we'll use to represent the model of the system. The attribute tree is like a file system with directories and files, where files are logically gathered in the same parent directory. There is no one good way to build a tree, the logic will depend on the situation and on the person defining it.
The generated state system may be used later on to populate views, so attributes of the tree could be grouped in such a way as to make it easy to reach them with a simple path. The view will then be more simple.
In our example case, we'll want to track the status of each task and, for each critical section, which task is running them.
|- Tasks
|    |- 1
|    |- 2
|   ...
|- Critical section
     |- Crit_sect1
     |- Crit_sect2
    ...
Then we determine how each event will affect the state of the attributes. But first, let's ask ourselves what values should each state take.
Let's see with the tree:
|- Tasks            -> Empty
|    |- 1           -> Each task can be in one of
|    |- 2             RUNNING, CRITICAL, WAITING
|   ...
|- Critical section -> Empty
     |- Crit_sect1  -> Each critical section will hold the currently running task number
     |- Crit_sect2
    ...
Then we determine how each event will affect the state of the attributes. In the attribute paths below, elements in {} are values coming from the trace event, while strings are constants. For the sake of simplicity, we'll say "update attribute", but if an attribute does not exist, it will be created.
- start(number): Update state value of attribute "Tasks/{number}" to "RUNNING".
- execute(number, fct_name): Update state value of attribute "Tasks/{number}" to "CRITICAL" and Update attribute "Critical section/{fct_name}" to "{number}".
- wait(number): Update state value of attribute "Tasks/{number}" to "WAITING".
- exec_end(fct_name): Update state value of attribute "Tasks/{valueOf Critical section/{fct_name}}" to RUNNING and update "Critical section/{fct_name}" to null.
- stop(number): Update state value of attribute "Tasks/{number}" to null.
Writing the XML state provider
Once the model is done at a high level, it is time to translate it to an XML data-driven analysis. For details on how to use each XML element, refer to the documentation available in the XSD files. Some elements will be commented on below.
First define the state provider element.
The "version" attribute indicates which version of the state system is defined here. Once a state provider has been defined for a trace type, it will typically be used by a team of people and it may be modified over time. This version number should be bumped each time a new version of the state provider is published. This will force a rebuild of any existing state histories (if applicable) whose version number is different from the current one.
The "id" attribute uniquely identifies this state provider, and the analysis that will contain it.
<stateProvider version="0" id="my.test.state.provider">
Optional header information can be added to the state provider. A "traceType" should be defined to tell TMF which trace type this analysis will apply to. If no tracetype is specified, the analysis will appear under every trace. A "label" can optionally be added to have a more user-friendly name for the analysis.
<head>
    <traceType id="my.trace.id" />
    <label value="My test analysis" />
</head>
If pre-defined values will be used in the state provider, they must be defined before the state providers. They can then be referred to in the state changes by name, preceded by the '$' sign. It is not necessary to use pre-defined values, the state change can use values like (100, 101, 102) directly.
<definedValue name="RUNNING" value="100" />
<definedValue name="CRITICAL" value="101" />
<definedValue name="WAITING" value="102" />
The following event handler shows what to do with the event named start. It causes one state change. The sequence of stateAttribute elements represents the path to the attribute in the attribute tree, each element being one level of the tree. The stateValue indicates which value to assign to the attribute at the given path. The "$RUNNING" value means it will use the predefined value named RUNNING above.
Suppose the actual event is start(3). The result of this state change is that at the time of the event, the state system attribute "Tasks/3" will have value 100.
<eventHandler eventName="start">
    <stateChange>
        <stateAttribute type="constant" value="Tasks" />
        <stateAttribute type="eventField" value="number" />
        <stateValue type="int" value="$RUNNING" />
    </stateChange>
</eventHandler>
The full XML file for the example above would look like this:
<?xml version="1.0" encoding="UTF-8"?>
<tmfxml xmlns:xsi="http://www.w3.org/2001/XMLSchema-instance" xsi:noNamespaceSchemaLocation="../../org.eclipse.linuxtools.tmf.analysis.xml.core/src/org/eclipse/linuxtools/tmf/analysis/xml/core/module/xmlDefinition.xsd">
    <stateProvider version="0" id="my.test.state.provider">
        <head>
            <traceType id="my.trace.id" />
            <label value="My test analysis" />
        </head>

        <definedValue name="RUNNING" value="100" />
        <definedValue name="CRITICAL" value="101" />
        <definedValue name="WAITING" value="102" />

        <eventHandler eventName="start">
            <stateChange>
                <stateAttribute type="constant" value="Tasks" />
                <stateAttribute type="eventField" value="number" />
                <stateValue type="int" value="$RUNNING" />
            </stateChange>
        </eventHandler>
        <eventHandler eventName="execute">
            <stateChange>
                <stateAttribute type="constant" value="Tasks" />
                <stateAttribute type="eventField" value="number" />
                <stateValue type="int" value="$CRITICAL" />
            </stateChange>
            <stateChange>
                <stateAttribute type="constant" value="Critical section" />
                <stateAttribute type="eventField" value="fct_name" />
                <stateValue type="eventField" value="number" />
            </stateChange>
        </eventHandler>
        <eventHandler eventName="wait">
            <stateChange>
                <stateAttribute type="constant" value="Tasks" />
                <stateAttribute type="eventField" value="number" />
                <stateValue type="int" value="$WAITING" />
            </stateChange>
        </eventHandler>
        <eventHandler eventName="exec_end">
            <stateChange>
                <stateAttribute type="constant" value="Tasks" />
                <stateAttribute type="query">
                    <stateAttribute type="constant" value="Critical section" />
                    <stateAttribute type="eventField" value="fct_name" />
                </stateAttribute>
                <stateValue type="int" value="$RUNNING" />
            </stateChange>
            <stateChange>
                <stateAttribute type="constant" value="Critical section" />
                <stateAttribute type="eventField" value="fct_name" />
                <stateValue type="null" />
            </stateChange>
        </eventHandler>
        <eventHandler eventName="stop">
            <stateChange>
                <stateAttribute type="constant" value="Tasks" />
                <stateAttribute type="eventField" value="number" />
                <stateValue type="null" />
            </stateChange>
        </eventHandler>
    </stateProvider>
</tmfxml>
Debugging the XML state provider
To debug the state system that was generated by the XML state provider, one could use the State System Explorer View, along with the events editor. By selecting an event, you can see what changes this event caused and the states of other attributes at the time.
If there are corrections to make, you may modify the XML state provider file, and re-import it. To re-run the analysis, you must first delete the supplementary files by right-clicking on your trace, and selecting Delete supplementary files.... Check you analysis's .ht file, so that the analysis will be run again when the trace is reopened. The supplementary file deletion will have closed the trace, so it needs to be opened again to use the newly imported analysis file.
If modifications are made to the XML state provider after it has been "published", the version attribute of the xmlStateProvider element should be updated. This avoids having to delete each trace's supplementary file manually. If the saved state system used a previous version, it will automatically be rebuilt from the XML file.
Defining an XML time graph view
A time graph view is a view divided in two, with a tree viewer on the left showing information on the different entries to display and a Gantt-like viewer on the right, showing the state of the entries over time. The Control Flow View is an example of a time graph view.
Such views can be defined in XML using the data in the state system. The state system itself could have been built by an XML-defined state provider or by any pre-defined Java analysis. It only requires knowing the structure of the state system, which can be explored using the State System Explorer View (or programmatically using the methods in ITmfStateSystem).
In the example above, suppose we want to display the status for each task. In the state system, it means the path of the entries to display is "Tasks/*". The attribute whose value should be shown in the Gantt chart is the entry attribute itself. So the XML to display these entries would be as such:
<entry path="Tasks/*">
    <display type="self" />
</entry>
But first, the view has to be declared. It has an ID, to uniquely identify this view among all the available XML files.
<timeGraphView id="my.test.time.graph.view">
Optional header information can be added to the view. analysis elements will associate the view only to the analysis identified by the "id" attribute. It can be either the ID of the state provider, like in this case, or the analysis ID of any analysis defined in Java. If no analysis is specified, the view will appear under every analysis with a state system. The label element allows to give a more user-friendly name to the view. The label does not have to be unique. As long as the ID is unique, views for different analyses can use the same name.
<head>
    <analysis id="my.test.state.provider" />
    <label value="My Sample XML View" />
</head>
Also, if the values of the attributes to display are known, they can be defined, along with a text to explain them and a color to draw them with. Note that the values are the same as defined in the state provider, but the name does not have to be the same. While in the state provider, a simple constant string makes sense to use in state changes. But in the view, the name will appear in the legend, so a user-friendly text is more appropriate.
<definedValue name="The process is running" value="100" color="#118811" />
<definedValue name="Critical section" value="101" color="#881111" />
<definedValue name="Waiting for critical section" value="102" color="#AEB522" />
Here is the full XML for the time graph view:
<tmfxml xmlns:xsi="http://www.w3.org/2001/XMLSchema-instance" xsi:noNamespaceSchemaLocation="../../org.eclipse.linuxtools.tmf.analysis.xml.core/src/org/eclipse/linuxtools/tmf/analysis/xml/core/module/xmlDefinition.xsd">
    <timeGraphView id="my.test.time.graph.view">
        <head>
            <analysis id="my.test.state.provider" />
            <label value="My Sample XML View" />
        </head>

        <definedValue name="The process is running" value="100" color="#118811" />
        <definedValue name="Critical section" value="101" color="#881111" />
        <definedValue name="Waiting for critical section" value="102" color="#AEB522" />

        <entry path="Tasks/*">
            <display type="self" />
        </entry>
    </timeGraphView>
</tmfxml>
The following screenshot shows the result of the preceding example on a test trace. The trace used, as well as the XML file are available here.
Defining an XML XY chart
An XY chart displays series as a set of numerical values over time. The X-axis represents the time and is synchronized with the trace's current time range. The Y-axis can be any numerical value.
Such views can be defined in XML using the data in the state system. The state system itself could have been built by an XML-defined state provider or by any pre-defined Java analysis. It only requires knowing the structure of the state system, which can be explored using the State System Explorer View (or programmatically using the methods in ITmfStateSystem).
We will use the LTTng Kernel Analysis on LTTng kernel traces to show an example XY chart. In this state system, the status of each CPU is a numerical value. We will display this value as the Y axis of the series. There will be one series per CPU. The XML to display these entries would be as such:
<entry path="CPUs/*">
	<display type="constant" value="Status" />
	<name type="self" />
</entry>
But first, the view has to be declared. It has an ID, to uniquely identify this view among all the available XML files.
<xyView id="my.test.xy.chart.view">
Like for the time graph views, optional header information can be added to the view. analysis elements will associate the view only to the analysis identified by the "id" attribute. It can be either the ID of the state provider, like in this case, or the analysis ID of any analysis defined in Java. If no analysis is specified, the view will appear under every analysis with a state system. The label element allows to give a more user-friendly name to the view. The label does not have to be unique. As long as the ID is unique, views for different analyses can use the same name.
<head>
    <analysis id="org.eclipse.linuxtools.lttng2.kernel.analysis" />
    <label value="CPU status XY view" />
</head>
Here is the full XML for the XY Chart that displays the CPU status over time of an LTTng Kernel Trace:
<tmfxml xmlns:xsi="http://www.w3.org/2001/XMLSchema-instance" xsi:noNamespaceSchemaLocation="../../org.eclipse.linuxtools.tmf.analysis.xml.core/src/org/eclipse/linuxtools/tmf/analysis/xml/core/module/xmlDefinition.xsd">
	<xyView id="my.test.xy.chart.view">
		<head>
			<analysis id="org.eclipse.linuxtools.lttng2.kernel.analysis" />
			<label value="CPU status XY view" />
		</head>

		<entry path="CPUs/*">
			<display type="constant" value="Status" />
			<name type="self" />
		</entry>
	</xyView>
</tmfxml>
The following screenshot shows the result of the preceding example on a LTTng Kernel Trace.
Limitations
- When parsing text traces, the timestamps are assumed to be in the local time zone. This means that when combining it to CTF binary traces, there could be offsets by a few hours depending on where the traces were taken and where they were read.
- LTTng Tools v2.1.0 introduced the command line options --no-consumer and --disable-consumer for session creation as well as the commands enable-consumer and disable-consumer. The LTTng Tracer Control in Eclipse doesn't support these options and commands because they will obsolete in LTTng Tools v2.2.0 and because the procedure for session creation offers already all relevant advanced parameters.
How to use LTTng to diagnose problems
LTTng is a tracer, it will give an enormous amount of information about the system it is running on. This means it can solve many types of problems.
The following are examples of problems that can be solved with a tracer.
Random stutters
Bob is running a computer program and it stutters periodically every 2 minutes. The CPU load is relatively low and Bob isn't running low on RAM.
He decides to trace his complete system for 10 minutes. He opens the LTTng view in eclipse. From the control, he creates a session and enables all kernel tracepoints.
He now has a 10 GB trace file. He imports the trace to his viewer and loads it up.
A cursory look at the histogram bar on the bottom show relatively even event distribution, there are no interesting spikes, so he will have to dig deeper to find the issue. If he had seen a spike every 2 minutes, there would be strong chances this would be the first thing to investigate as it would imply a lot of kernel activity at the same period as his glitch, this would have been a path to investigate.
As Bob suspects that he may be having some hardware raising IRQs or some other hardware based issue and adding delays. He looks at the ressource view and doesn't see anything abnormal.
Bob did note an exact second one glitch occured: 11:58:03. He zooms into the time range or 11:58:02-11:58:04 using the histogram.He is happy to see the time is human readable local wall clock time and no longer in "nanseconds since the last reboot".
In the resource view, once again, he sees many soft irqs being raised at the same time, around the time his gui would freeze. He changes views and looks at the control flow view at that time and sees a process spending a lot of time in the kernel: FooMonitor- his temperature monitoring software.
At this point he closes FooMonitor and notices the bug dissapeared. He could call it a day but he wants to see what was causing the system to freeze. He cannot justify closing a piece of software without understanding the issue. It may be a conflict that HIS software is causing after all.
The system freezes around the time this program is running. He clicks on the process in the control flow view and looks at the corresponding events in the detailed events view. He sees: open - read - close repeated hundreds of times on the same file. The file being read was /dev/HWmonitor. He sends a report to the FooMonitor team and warns his team that FooMonitor was glitching their performance.
The FooMonitor team finds that they were calling a system bus call that would halt a cpu while reading the temperature so that the core would not induce an 0.1 degree error in the reading, by disabling this feature, they improve their software and stop the glitches from occurring on their custommer's machine. They also optimize their code to open the file read and clone it once.
By using system wide kernel tracing, even without deep kernel knowledge Bob was able to isolate a bug in a rogue piece of software in his system.
Slow I/O
Alice is running her server. She noticed that one of her nodes was slowing down, and wasn't sure why, upon reading the trace she noticed that her time between a block request and complete was around 10ms.
This is abnormal, normally her server handles IOs in under 100us, since they are quite local.
She walks up to the server and hears the hard drive thrashing, This prompts her to look up in the events view the sectors being read in the block complete requests. There are her requests interleaved with other ones at the opposite side of the hard drive.
She sees the tracer writing but there is another process that is writing to the server disk non stop. She looks in the control flow view and sees that there's a program from another fellow engineer, "Wally" that is writing in his home in a loop "All work and no play makes Jack a dull boy.".
Alice kills the program, and immediately the server speeds up. She then goes to discuss this with Wally and implements strict hard disk quotas on the server.
References
- Linux Tools - LTTng integration
- LTTng project
- LTTng Tracer Control Command Line Tool User Manual
- LTTng relayd User Manual
- TMF User Guide
Updating This Document
This document is maintained in a collaborative wiki. If you wish to update or modify this document please visit http://wiki.eclipse.org/Linux_Tools_Project/LTTng2/User_Guide

