Notice: This Wiki is now read only and edits are no longer possible. Please see: https://gitlab.eclipse.org/eclipsefdn/helpdesk/-/wikis/Wiki-shutdown-plan for the plan.
Linux Tools Project/GDB/User Guide
Contents
Overview
The GDB Tracepoint Analysis feature is an extension to the Tracing and Monitoring Framework that allows the visualization and analysis of C/C++ tracepoint data collected by GDB and stored to a log file.
Getting Started
The feature can be installed from the Eclipse update site by selecting Linux Tools > GDB Tracepoint Analysis.
The feature requires GDB version 7.2 or later to be installed on the local host. The executable program 'gdb' must be found in the path.
GDB Trace Perspective
To open the perspective, select Window > Open Perspective > Other... > GDB Trace.
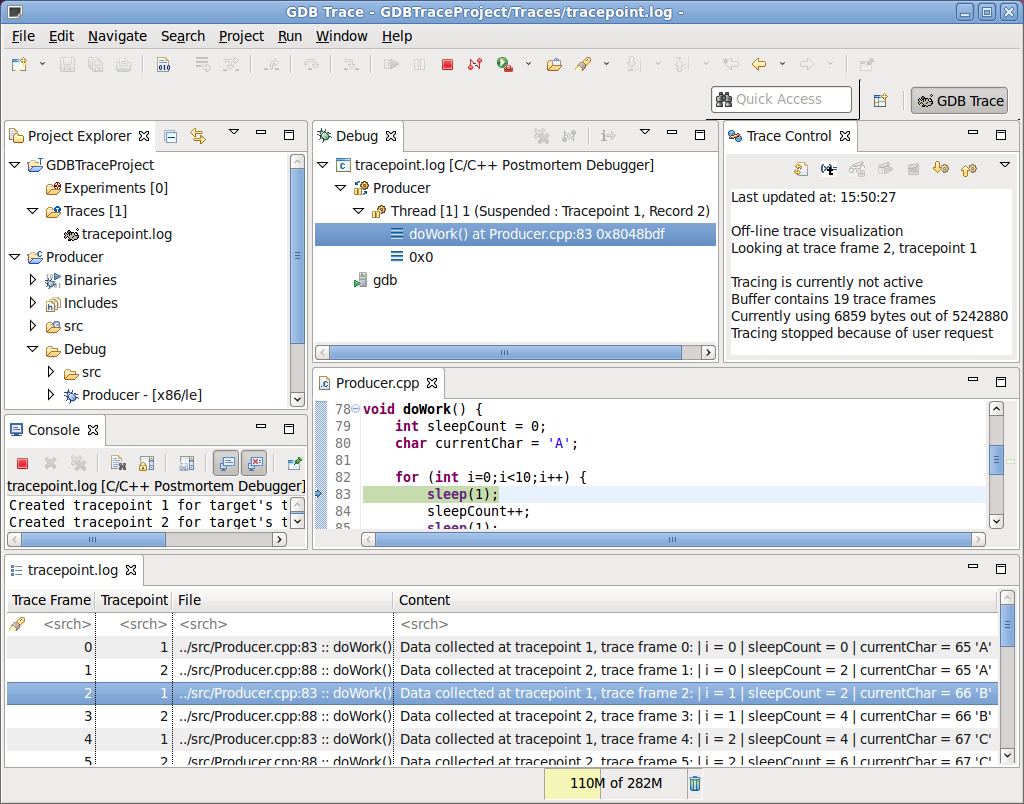
The perspective includes the following views by default:
- Project Explorer: This view shows the projects in the workspace and is used to create and manage Tracing projects.
- Debug: This view shows the running C/C++ Postmortem Debugger instances and displays the thread and stack trace associated with a tracepoint.
- Trace Control: This view shows the status of the debugger and allows navigation of trace records.
- Console: This view displays console output of the C/C++ Postmortem Debugger.
The editor area contains the Events and C/C++ editors when a GDB Trace is opened.
Collecting Tracepoint Data
Collecting the C/C++ tracepoint data is outside the scope of this feature. It can be done from the GDB command line or by using the CDT debug component within Eclipse. See the CDT FAQ entry in the References section.
Importing Tracepoint Data
Some information in this section is redundant with the LTTng User Guide. For further details, see the LTTng User Guide entry in the References section.
Creating a Tracing Project
In the Project Explorer view, right-click and select New > Project... from the context menu. In the New Project dialog, select Tracing > Tracing Project, click Next, name your project and click Finish.
Importing a GDB Trace
In your tracing project, right-click on the Traces folder and select Import.... Browse to, or enter, a source directory. Select the trace file in the tree. Optionally set the trace type to GDB : GDB Trace. Click Finish.
Alternatively, the trace can be drag & dropped to the Traces folder from any external file manager.
Selecting the GDB Trace Type
Right-click the imported trace in the Traces folder and choose Select Trace Type... > GDB > GDB Trace from the context menu. This step can be omitted if the trace type was selected at import.
The trace will be updated with the GDB icon ![]() .
.
Selecting the Trace Executable
The executable file that created the tracepoint data must be identified so that the C/C++ Postmortem Debugger can be launched properly.
Right-click the GDB trace in the Traces folder and choose Select Trace Executable... from the context menu. Browse to, or enter, the path of the executable file and press OK.
The selected file must be recognized by GDB as an executable.
Visualizing Tracepoint Data
Opening a GDB Trace
In the Traces folder, double-click the GDB trace or right-click it and select Open from the context menu.
The tracepoint data will be opened in an Events editor, and a C/C++ Postmortem Debugger instance will be launched.
If available in the workspace, the source code corresponding to the first trace record will also be opened in a C/C++ editor.
At this point it is recommended to relocate the Events editor outside of the default editor area, so that it is not hidden by the C/C++ editor.
Viewing Trace Data
In the Events editor, a table is shown with one row for each trace record. The Trace Frame column shows the sequential trace record number. The Tracepoint column shows the number assigned by GDB at collection time for this tracepoint. The File column shows the file name, line number and method where the tracepoint was set. The Content column shows the data collected at run-time by the tracepoint.
Searching and filtering can be done on any column by entering a regular expression in the column header.
Trace records can be selected in the Events editor using the keyboard or mouse. The C/C++ Postmortem Debugger in the Debug view will be updated to show the stack trace of the current trace record.
The trace can also be navigated from the Trace Control view by clicking the Next Trace Record or Previous Trace Record buttons. The Events editor and Debug views will be updated.
References
Updating This Document
This document is maintained in a collaborative wiki. If you wish to update or modify this document please visit http://wiki.eclipse.org/Linux_Tools_Project/GDB_Tracepoint_Analysis/User_Guide

