Notice: This Wiki is now read only and edits are no longer possible. Please see: https://gitlab.eclipse.org/eclipsefdn/helpdesk/-/wikis/Wiki-shutdown-plan for the plan.
Graphical Modeling Framework/Tutorial/BPMN
More recent documentation on customization can be found here: Graphical Modeling Framework/Tutorial/Part 2 <- Read it first!
This additional tutorial covers the basics of GMF and was created using the 1.0 release for OOPSLA 2006. A zip of the solution files is found here.
Note that BPMN diagramming and BPEL generation are being developed for Eclipse within the context of the | SOA Tools Platform project. The diagram is based on GMF and was initially contributed | here.
Contents
Graphical Definition
Note that steps 1 and 2 can be done out of order. For those preferring to begin with the domain model, perform step 2 before the graphical definition of step 1. It is possible to create a Mapping model with no domain elements specified and run the diagram to test the graphical and tooling models.
Below are the detailed steps to be taken:
- Using the new dialog (File > New… or Ctrl+N), select ‘Graphical Modeling Framework > Default > GMFGraph Model’
- Name the model bpmn.gmfgraph and select the ‘model’ folder under your project for its parent
- Select ‘Canvas’ as the Model Object and Finish
- Using the editor and Properties view, give the Canvas root a name of ‘BPMN Diagram’
- To the Canvas, add a child ‘Figure Gallery’ named ‘BPMN Figures’
- To the Figure Gallery, add a child ‘Rounded Rectangle’ named ‘TaskFigure’
- To the Figure Gallery, add a child ´Figure Descriptor´ named ´Rectangle TaskName´
- Drag the Rectangle to the Figure Descriptor
- Alter the properties of the TaskFigure element as you wish, optionally adding child Preferred Size Dimension and Foreground Color
- Add a child Label to the TaskFigure named ‘TaskLabelFigure’
- Add a ‘StackLayout’ as a child of the TaskFigure so that our Label will be centered in the TaskFigure
- Add a ‘Node’ to the Canvas, name it ‘Task’ and select our ‘Rounded Rectangle TaskFigure’ as its Figure
- Finally, add a ‘Diagram Label’ named ‘TaskName’ to the Canvas, select our ‘Figure Descriptor’ as its figure, with no ‘Element Icon’
Running Diagram with no Domain (optional)
- In the New dialog, select ‘GMFMap Model’ under ‘Graphical Modeling Framework > Default’
- Name the model bpmn.gmfmap and again select your ‘model’ folder as its parent
- Select ‘Mapping’ as the Model Object and Finish
- In the editor, right-click and select ‘Load Resource…’
- Select your bpmn.gmfgraph model using ‘Browse Workspace…’
- Add a child ‘Canvas Mapping’ to the root ‘Mapping’ element
- Specify our ‘Canvas BPMN Diagram’ as the Diagram Canvas, leaving the other properties blank
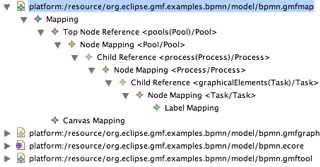
- Add a child ‘Top Node Reference’ to the root ‘Mapping’ element
- Add a child ‘Node Mapping’ to the new ‘Top Node Reference’ and select our ‘Node Task’ as the ‘Diagram Node’
- Add a child ‘Label Mapping’ to the ‘Node Mapping’ and select our ‘TaskName’ label as the ‘Diagram Label’
- Right-click the Mapping element and select ‘Create generator model…’’
- Name the model bpmn.gmfgen and opt to use IMapMode when prompted
- Open the bpmn.gmfgen model and change the properties of the ‘Gen Editor Generator’ element:
- Change ‘Diagram File Extension’ to ‘bpd’
- Change ‘Package Name Prefix’ to ‘oopsla.bpmn’
- Change ‘Model ID’ to ‘BPMN’
- Save the model
- Right-click the bpmn.gmfgen model and select ‘Generate diagram code’
- A new ‘design.diagram’ project is created which we can run using ‘Run > Run…’
- In the Run dialog, select ‘Eclipse Application’ and ‘New’
- Change the ‘Name:’ field to ‘design.diagram’ and adjust ‘Location:’ to match
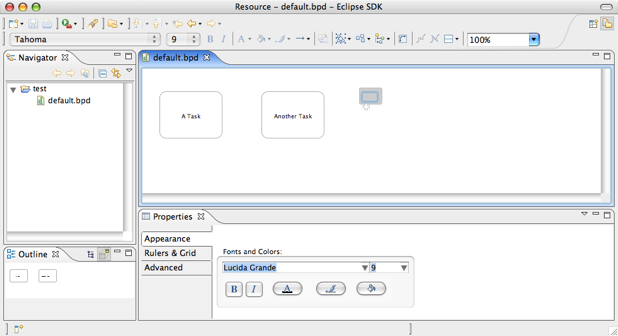
- Run the runtime workbench, create a new project and diagram (under ‘Examples’ in New dialog) to test it works
Note that without a tool definition model, we will have no palette. Task elements can be added to the diagram regardless, using the popup menus that appear on the diagram under the mouse cursor.
You can continue to develop your graphical elements in this manner and test their look and feel in a ‘domain-free’ environment. The goal is to potentially reuse elements from these graphical definition models in other diagram definitions. Another option is to reuse those provided with GMF and any that may be developed and shared within the community. GMF provides basic, class, and state diagram galleries in its org.eclipse.gmf.graphdef plug-in, which can be loaded into your models using ‘Load Resource…’ and providing a URI of platform:/plugin/org.eclipse.gmf.graphdef/models/basic.gmfgraph (or classDiagram.gmfgraph, or stateDiagram.gmfgraph).
Developing the Domain Model
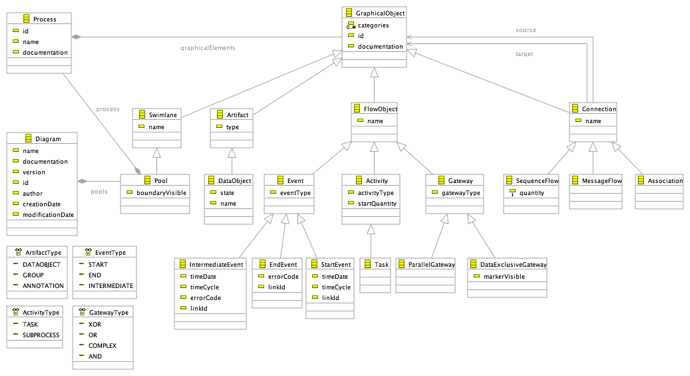
We will leverage one of GMF’s example diagrams to develop an ecore domain model for BPMN, using the specification Annex B. Optionally, you can copy the provided bpmn.ecore into your ‘model’ folder and create a diagram for it using the right-click ‘Initialize ecore_diagram diagram file’ option. If you do so, start with Step 4.
- Using the wizard for a new Ecore Diagram, give it the name ‘bpmn’
- In the properties view ‘Advanced’ tab, change the Name, Ns Prefix, and Ns URI to be ‘bpmn’ for the diagram
- Create your domain model using the image above
- Create an EMF generator mode using ‘File > New > Other… > Eclipse Modeling Framework > EMF Model’
- Name the model bpmn.genmodel create it in your ‘model’ folder
- Select the ‘Ecore model’ importer
- Browse your workspace and select your bpmn.ecore domain model (press ‘Load’ to continue) and Finish
- Expand the root of the genmodel in the editor and give the ‘Bpmn’ package a ‘Base package’ name of ‘oopsla’
- Right-click on the root of the genmodel and select ‘Generate Model Code’ then ‘Generate Edit Code’ then ‘Generate Editor Code’ (optional)
Define the Tooling Model
As the Tooling Definition model is quite simplistic (only palette elements), we’ll use the provided wizard to create one from our domain model. Note that a similar wizard is available for creating a quick Graphical Definition model.
- Launch the wizard from ‘File > New > Other… > Graphical Modeling Framework > GMFTool Simple Model’
- Name the model ‘bpmn.gmftool’ and create in our ‘model’ folder as usual
- Select our ‘Diagram’ class for our ‘Diagram element’
- Deselect all initially, then check the node column for:
- Process
- Pool
- StartEvent
- EndEvent
- IntermediateEvent
- Task
- DataExclusiveGateway
- ParallelGateway
- DataObject
- And for the following, select the Link column and Finish:
- SequenceFlow
- MessageFlow
- Association
- Give the Palette the title ‘BPMN Elements’
- Rename the ‘bpmn’ group to ‘Nodes’
- Create a new ‘Tool Group’ under our Palette and name it ‘Links’
- Drag and drop our link creation tools to the ‘Links’ group
Note: you may want to select ‘true’ for the Collapsible property of the Tool Group items.
Define the Mapping Model
At this point, we are aware of how our domain will require us to construct diagrams using our graphical elements. Our basic Task node will be contained within a Process element, which itself is contained within a Pool element. There are many options to choose at this point, but for simplicity, we’ll begin by creating two simple dotted line rectangles to represent our Process and Pool elements. The specification seems a bit peculiar in that a Pool may have 0 or 1 Process items, but as the Process element is where all graphical elements are contained, it doesn’t seem like much of a diagram would exist without it ;-)
Note that if you opted to generate a ‘design.diagram’ plug-in earlier, you may delete that project and the associated bpmn.gmfmap and bpmn.genmodel models. To save a little time, you may keep the bpmn.gmfmap model and refactor as required given our new structure.
- Open your bpmn.gmfgraph model once again
- Create a new Rounded Rectangle element in the Figure Gallery named ‘DottedRectangleFigure’
- Set ‘Line Kind’ to LINE_DOT
- Set ‘Fill’ to ‘false’
- Add a child ‘XY Layout’ element to the DottedRectangleFigure
- Add a new Node to the Canvas named ‘Process’, selecting DottedRectangleFigure as its ‘Figure’
- Add another Node named ‘Pool’ and also assign the DottedRectangleFigure as its ‘Figure’
- Create a GMFMap model using ‘File > New > Other… > Graphical Modeling Framework > Default > GMFMap Model’ (if you’ve not done so already)
- Select ‘Mapping’ for the ‘Model Object’ and Finish
- Right-click in the editor and select ‘Load Resource…’
- Use ‘Browse Workspace’ to select your bpmn.ecore model
- Repeat until you’ve also added your bpmn.gmfgraph and bpmn.gmftool models
- To the root ‘Mapping’ add a child ‘Canvas Mapping’
- The Diagram Canvas maps to our ‘Canvas BPMN Diagram’
- The Palette maps to our ‘Palette BPMN Elements’
- The domain Element maps to our ‘EClass Diagram’
- Also to the ‘Mapping’ root, add a child ‘Top Node Reference’
- Set the ‘Containment Feature’ to ‘EReference pools’
- Add a child ‘Node Mapping’ to the Top Node Reference
- Set the Tool to ‘Creation Tool Pool’
- Set the Diagram Node to ‘Node Pool’
- Set the domain Element to ‘EClass Pool’
- Add a ‘Child Reference’ to our Node Mapping
- Set its Containment Feature to ‘EReference process’
- Add a Node Mapping to this Child Reference
- Set its Tool to ‘Creation Tool Process’
- Set its Diagram Node to ‘Node Process’
- Set its domain Element to ‘EClass Process’
- Add another ‘Child Reference’ to this Node Mapping
- Set its Containment Feature to ‘EReference graphicalElements’
- Add another ‘Node Mapping’ to this Child Reference
- Set its Tool to ‘Creation Tool Task’
- Set its Diagram Node to ‘Node Task’
- Set its domain Element to ‘EClass Task’
- Add a Label mapping to our Task
- Set the Diagram Label to ‘Diagram Label TaskName’
- Set the Features property to ‘EAttribute name’
At this point, we’ve completed our mappings. Subsequent graphical elements will be added as children of our Process mapping, similar to the Task node. For now, we can create our generator model and run our diagram.
Code Generation and Testing
- Right-click the bpmn.gmfmap file and select ‘Create generator model…’ (accept the defaults)
- Open the new bpmn.gmfgen model and examine/alter the properties:
- Set the Gen Editor Generator element property ‘Domain Gen Model’ to ‘Bpmn’
- Set the ‘Diagram File Extension’ to ‘bpd’
- Right-click on the bpmn.gmfgen file and select ‘Generate diagram code’
- In the Run > Run… dialog, create a new Eclipse Application configuration named ‘bpmn’ (adjust runtime workspace directory if desired)
- Run the workspace, create a new basic project and new ‘Bpmn Diagram’ (under Examples in New dialog)
Adding More Elements
Rather than list the step-by-step instructions here for the creation of these graphical elements, it’s recommended that you open the provided bpmn.gmfgraph model provided in the solution to this step. Examine the elements in the model and copy/paste the solution to your workspace and work on the mapping definition.
The mapping model is rather straightforward and similar to the elements mapped so far. The connections are slightly different, and if required can be copied from the provided bpmn.gmfmap for this step.
After recreating the generator model, the Gen Child Node DataObjectEdit part needs a modification to provide a default size to match the figure. Right-click on the Inner Class Viewmap DataObjectFlowFigure and add a Default Size Attributes child. Specify 25 for the Height and 20 for the Width.
Feature Initialization
In our domain model, each Event element has type assigned using the EventType enum. Upon creating each even on the diagram, we are creating the proper type to be instantiated as a result of our mapping definition (bpmn.gmfmap). However, we still need to initialize the eventType attribute of the class. We can accomplish this using Feature Initializers and OCL.
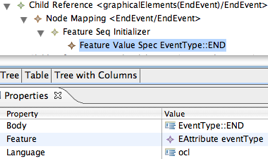
- Open your bpmn.gmfmap model and navigate to our Node Mapping for the EndEvent
- Right-click and add a new child ‘Feature Seq Initializer’ to the NodeMapping
- Then create a new child ‘Feature Value Spec’ to the initializer
- Enter ‘EventType::END’ in the ‘Body’ property
- Select ‘EAttribute eventType’ from the list for the ‘Feature’ property
- Regenerate your bpmn.gmfgen model and code as before
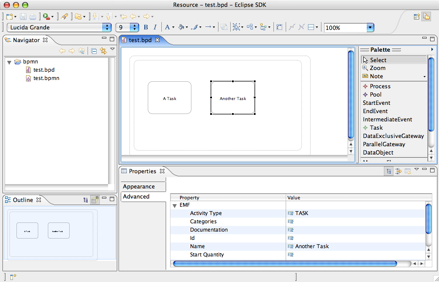
- Run your diagram and create a new End event, checking the initialization of its eventType attribute in the properties view
Tip : In GMF 2.1 a 'Feature Value Spec' doesn't have 'Body' and 'Language' attributes itself. Instead you have to add a 'Value Expression' child to the 'Feature Value Spec'. Then you can set the body expression in this 'Value Expression'.
OCL Constraints
Another use of OCL in GMF is for link constraints. In this step, we will add a constraint to prevent Association links from attaching to targets other than Artifacts.
- In your bpmn.gmfmap model, navigate to your Link Mapping for Associations
- Right-click and add a new child ‘Link Constraints’ element
- Right-click on the Link Constraint and add a child ‘Target End Constraint’
- In the ‘Body’ of the Constraint, add the text ‘self.oclIsKindOf(Artifact)’ [without the quotation marks]
- Once again, regenerate your bpmn.gmfgen model and code
- Run the diagram and attempt to create an Association link from an element to another non-Artifact element. You should receive feedback that the target is invalid.
Custom Figures
Polyline connections allow for source and target decorations. Unfortunately, there is no default support for ellipse decorations so we will have to provide our own custom figure to create the BPMN Message Flow link. As seen in the image, a Message Flow link has a hollow, closed arrow on the target with a small circle on the source of a dashed line connector. We will make use of an existing decorator in a graphical definition provided by GMF for the target decoration. File:MessageFlow.png
- Reopen your bpmn.gmfgraph model and add a new Polyline Connection to your Figure Gallery named ‘MessageFlowFigure’
- Chage the ‘Line Kind’ property to LINE_DASH
- Load the provided graphical definition model for standard class diagram elements by right-clicking in your editor and selecting ‘Load Resource…’
- Enter ‘platform:/plugin/org.eclipse.gmf.graphdef/models/classDiagram.gmfgraph’ in the dialog
- Now, in the ‘Target Decoration’ property for our MessageFlowFigure will be a ‘Polyline Decoration ClosedArrow’ option
- Select this decoration (Note, the only difference between this and the one we created for our NormalFlowFigure is the white fill color. The goal of this step is to demonstrate the ability to share/reuse Figure Gallery content between models)
- Right-click on our MessageFlowFigure and create a new child ‘Custom Decoration’
- Provide the name ‘CircleDecorationFigure’
- Enter ‘oopsla.bpmn.diagram.edit.parts.CircleDecoration’ in the ‘Qualified Class Name’ property
- In the MessageFlowFigure, select the new ‘CircleDecoration’ for the ‘Source Decoration’ in the properties view
- Right-click on the Custom Decoration to add a ‘Custom Attribute’ named ‘radius’ with a ‘value’ of ‘4’
- Add a Connection to our Canvas named ‘MessageFlow’ and select this new ‘MessageFlowFigure’ as its Figure
- Open the bpmn.gmfmap model and create a new Link Mapping as before for our MessageFlow link
- Regenerate the bpmn.gmfgen model and diagram code
- You will need to copy the provided CircleDecoration class file into the package indicated above in order to compile after regenerating
- Run the diagram and check the operation of the new Message Flow link
Custom Figures (SVG)
The only ‘dead’ tool that should exist in our palette is for the IntermediateEvent node. This time, we’ll use an SVG file to provide the element on our diagram.
- Open the bpmn.gmfgraph model and create a new Figure Gallery to our Canvas named ‘Images’ (to distinguish from our ‘Figures’ gallery)
- Add a new ‘Custom Figure’ to the new Figure Gallery
- Give it the name ‘IntermediateEventFigure’
- Give it a Qualified Class Name of ‘org.eclipse.gmf.runtime.draw2d.ui.render.figures.ScalableImageFigure’
- Create a new ‘Node’ named ‘IntermediateEvent’ to the Canvas and assign it this figure
- Open the bpmn.gmfmap model and create a new mapping for the IntermediateEvent node, similar to the other Event elements
- Regenerate the generator model and code and navigate to the createNodeShape() method in the generated class IntermediateEventEditPart (you will see a compiler error here)
- Enter the code snippet below to replace the generated body of this method (note the NOT word after @generated used to prevent overwriting this user-defined method body)
- In the *.diagram plug-in manifest (plugin.xml), add the plug-in org.eclipse.gmf.runtime.draw2d.ui.render to the list of ‘Required Plug-ins’ on the Dependencies tab of the editor
- Use Ctrl+Shift+O to clean up imports and eliminate compiler errors
- Copy the provided /images/circle.svg file into this folder structure below the generated *.diagram plug-in project (SVG code snippet below)
- Run the diagram and create a new IntermediateEvent element to test
/**
 * @generated NOT
 */
protected IFigure createNodeShape() {
	URL url = FileLocator.find(BpmnDiagramEditorPlugin.getInstance().getBundle(), new Path("images/circle.svg"), null); //$NON-NLS-1$
	return new ScalableImageFigure(RenderedImageFactory.getInstance(url), true, true, true);
}
<?xml version="1.0" standalone="no"?>
<!DOCTYPE svg PUBLIC "-//W3C//DTD SVG 1.1//EN" "http://www.w3.org/Graphics/SVG/1.1/DTD/svg11.dtd">
<svg width="50" height="50" xmlns="http://www.w3.org/2000/svg" version="1.1">
  	<circle cx="25" cy="25" r="23" fill="white" stroke="black" stroke-width="1"/>
	<circle cx="25" cy="25" r="20" fill="white" stroke="black" stroke-width="1"/>
</svg>

