Notice: This Wiki is now read only and edits are no longer possible. Please see: https://gitlab.eclipse.org/eclipsefdn/helpdesk/-/wikis/Wiki-shutdown-plan for the plan.
Debugging using XDebug
Contents
About Xdebug
Xdebug is an opensource Debugger and Profiler for PHP. PDT has built in support for Xdebug, which allows you to step-debug through your PHP projects.
Setup
Installation
The first step is to install Xdebug and verify that Xdebug is running. See the Installation section of the Xdebug manual for how to obtain the extension.
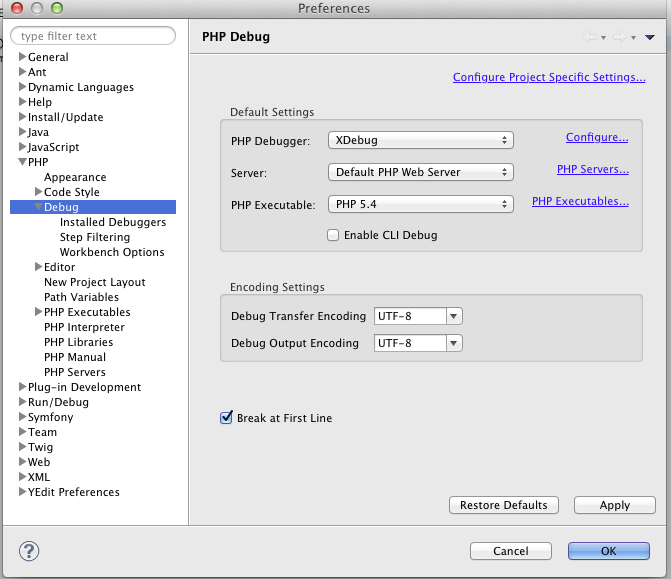
To setup Xdebug as your default debugger in PDT, simply configure the Default Settings in the Debug eclipse preference page of PHP
Configuration
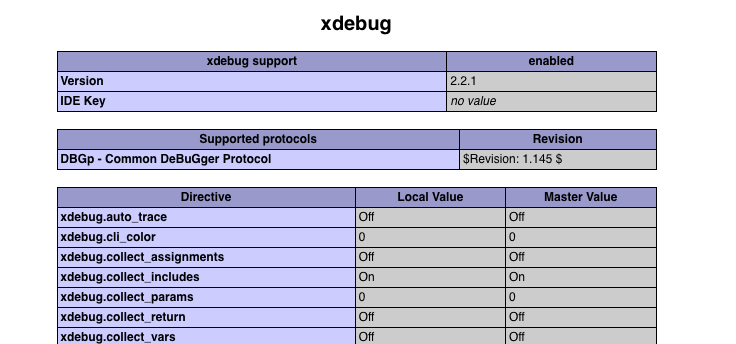
The most important setting for Xdebug to work with PDT is xdebug.remote_enable = 1. Typically you set this value in your php.ini. To verify that Xdebug
is loaded by your server, use the phpinfo() method and check if you can find an Xdebug configuration section.
Usage
The following examples assume you're debugging on a local mashine, not a remote server.
Debugging using the default DocumentRoot (http://localhost)
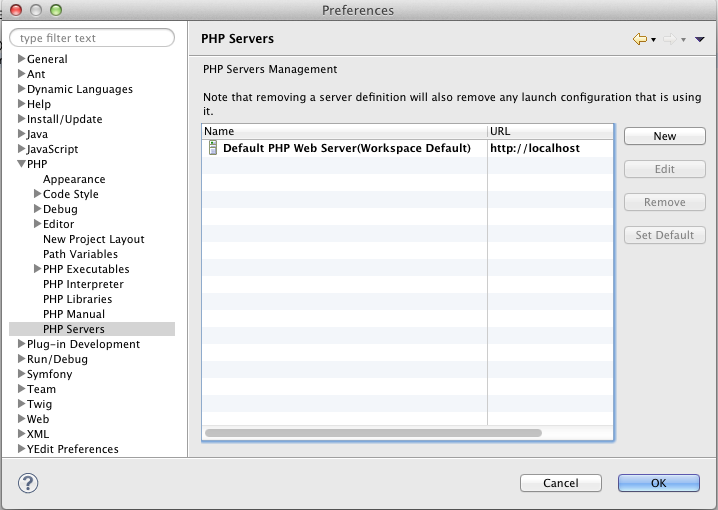
PDT provides a preference dialog to configure different PHP servers.
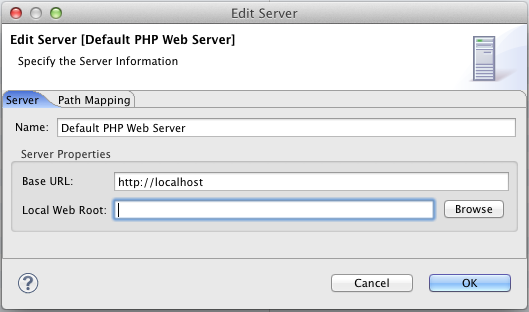
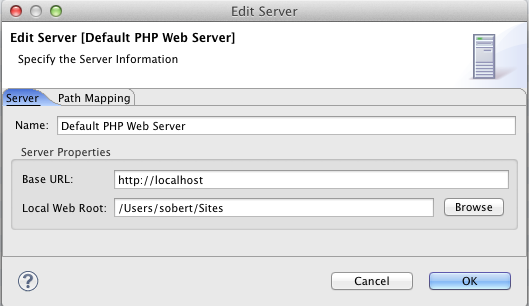
Each server has has a Base URL and a Local Web Root property.
When you start a debug session, the Base URL is used in conjunction with the path of the script you're debugging to determine the absolute URL to open. For example, when you debug
the script index.php in the root of your Project with the default PHP Server, PDT will launch a debug session in a browser with the URL http://localhost/index.php.
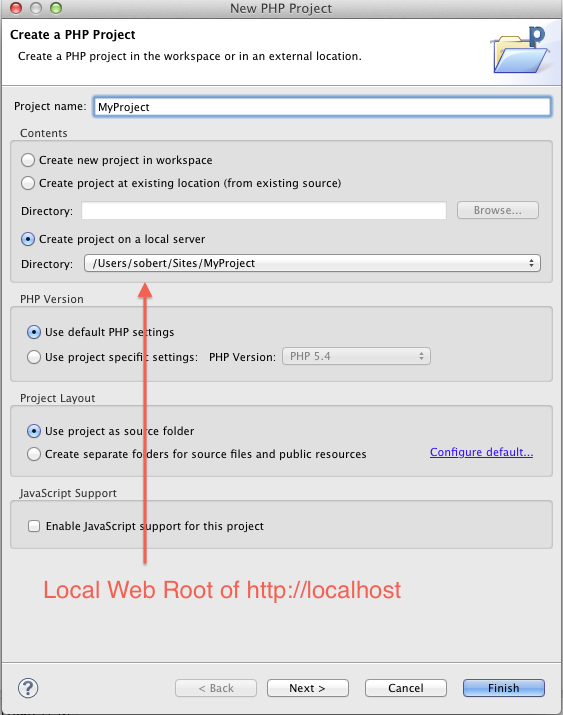
If the Local Web Root property of a server is set, you can choose the Server as the base-directory in the New PHP Project dialog (see screenshot below).
Typically you will set the Local Web Root of the default PHP server (http://localhost) to the DocumentRoot of your local Web server (e.g. apache).
The default PHP server is http://localhost and has no Local Web Root set. So the first thing to do is to open the PHP Servers preference page, and set the Local Web Root to the DocumentRoot
of your webserver (e.g. /var/www/htdocs).localhost
When creating a new PHP project, you will now see a 3rd option named Create project on local server. The new project will be created in a subfolder of the Local Web Root of the selected server, not
in the default workspace path:
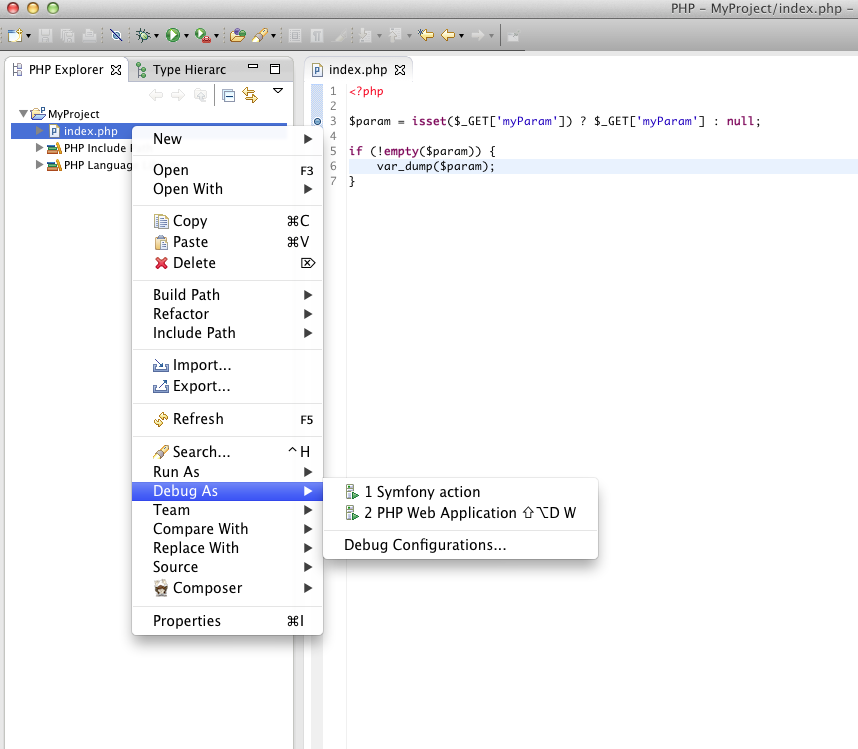
Now let's create a new empty PHP project named "MyProject" in the default PHP server and a simple index.php in the root of the project. To debug your script, all you need to do is right-clicking the index.php file and select Debug as -> PHP Web Application.
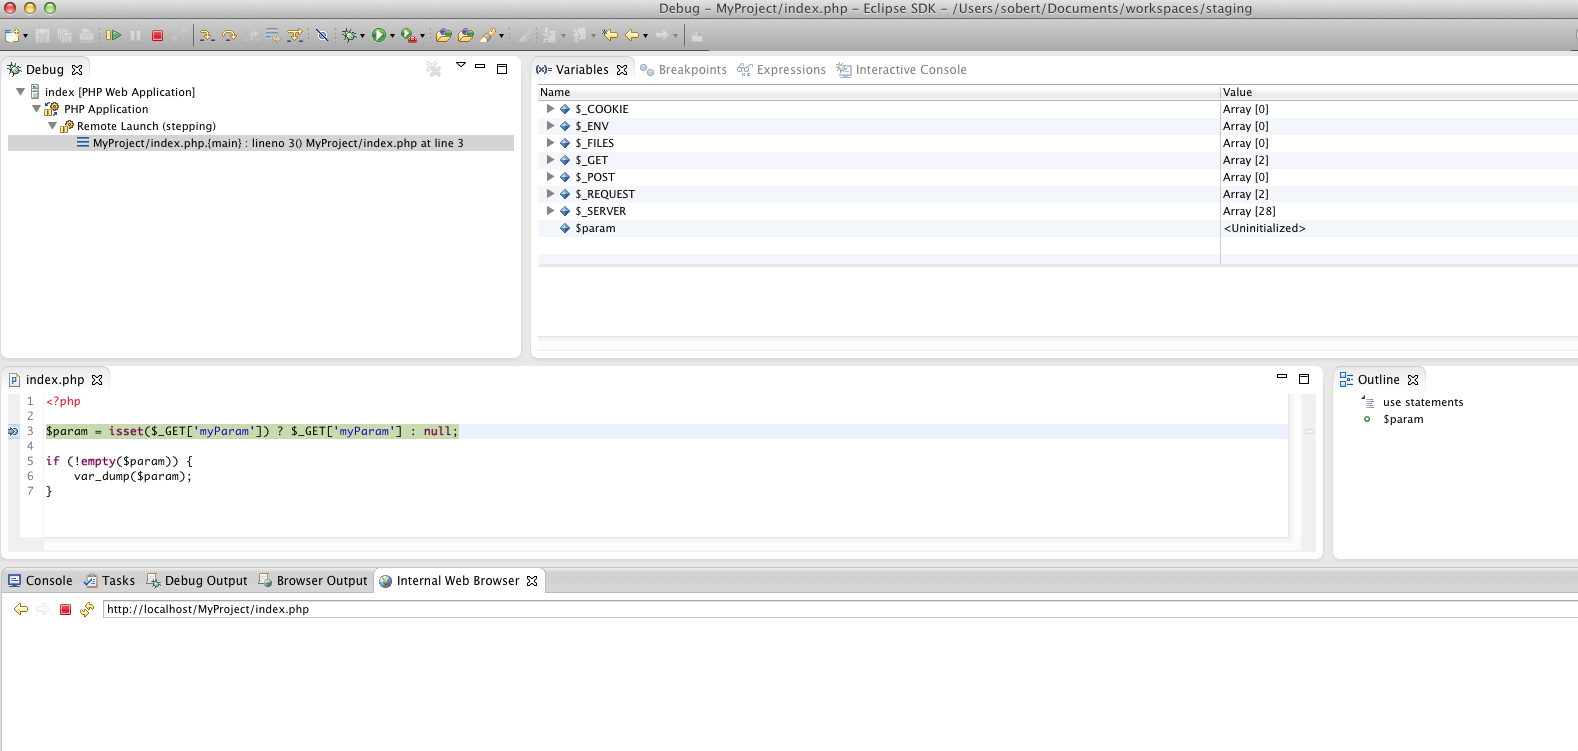
This will launch the default workbench browser with the URL http://localhost/MyProject/index.php and stop at the first line index.php (this is configurable via the Debug configuration):
You can set a breakpoint in the editor on any line by double clicking on a line number on the left.
Use Step Into (F5), Step Over (F6), Step Out (F7) or Resume (F8) to go through your scripts step by step.
Notice that the debugging session will still be open after pressing F8 (Resum), so you simply need to refresh the browser to restart debugging your script.
Debugging using VirtualHosts (http://myProject.local)
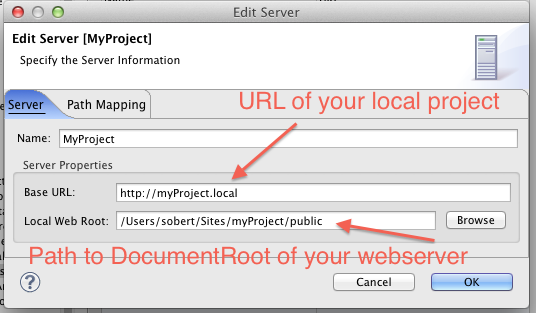
If you're using VirtualHosts for your local project, you need to configure a PHP Server first. This server simply needs to have the correct URL to your project, and the path to the Document root (Preferences -> PHP -> PHP Servers):
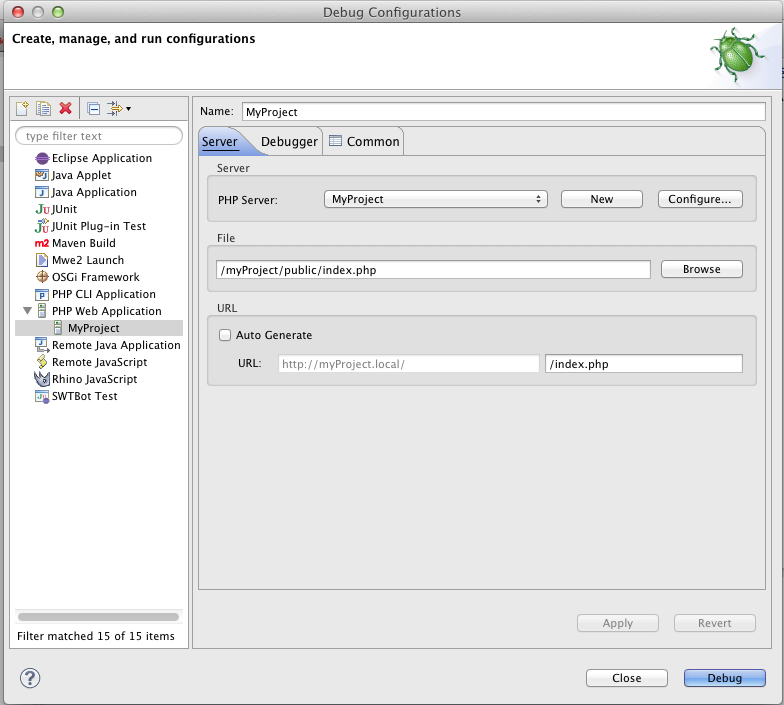
After you've setup the PHP server, you can create a new debug configuration (Run -> Debug Configurations -> PHP Web Application) using the newly created server:
Now you can simply click "Debug" and the debug session should open in your browser.
Choosing the browser to use for debugging
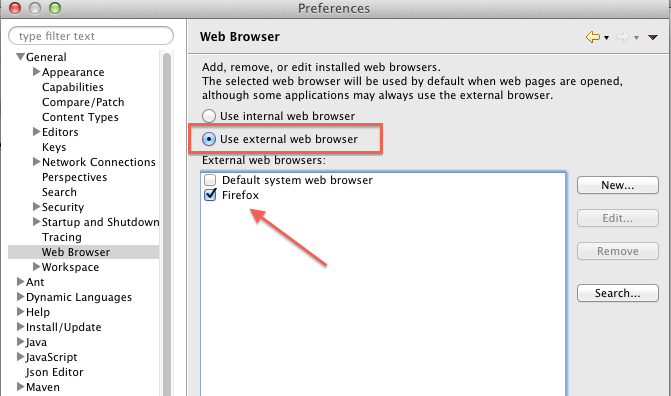
By default, eclipse launches the debug session inside the internal browser. It is recommended to use an external browser though. You can specify the browser to use in the general preferences:
Perspectives
Eclipse may be configured to open the Debug perspective automatically or to get back to the PHP perspective automatically, but not both (see bug 46336).

