Notice: This Wiki is now read only and edits are no longer possible. Please see: https://gitlab.eclipse.org/eclipsefdn/helpdesk/-/wikis/Wiki-shutdown-plan for the plan.
COSMOS Design 224166
Contents
Improve the Graph Response Viewer
Change History
| Name: | Date: | Revised Sections: |
|---|---|---|
| Ali Mehregani | 05/21/2008 |
|
| Ali Mehregani | 05/28/2008 |
|
Workload Estimation
| Process | Sizing | Names of people doing the work |
|---|---|---|
| Design | .5 | Ali Mehregani |
| Code | 3.5 | Ali Mehregani |
| Test | .5 | Ali Mehregani |
| Documentation | 0 | |
| Build and infrastructure | 0 | |
| Code review, etc.* | 0 | |
| TOTAL | 4.5 |
Terminologies/Acronyms
The terminologies/acronyms below are commonly used throughout this document. The list below defines each term regarding how it is used in this document:
| Term | Definition |
|---|---|
| MDR | Management Data Repository |
Purpose
This enhancement is associated with bugzilla 224166.
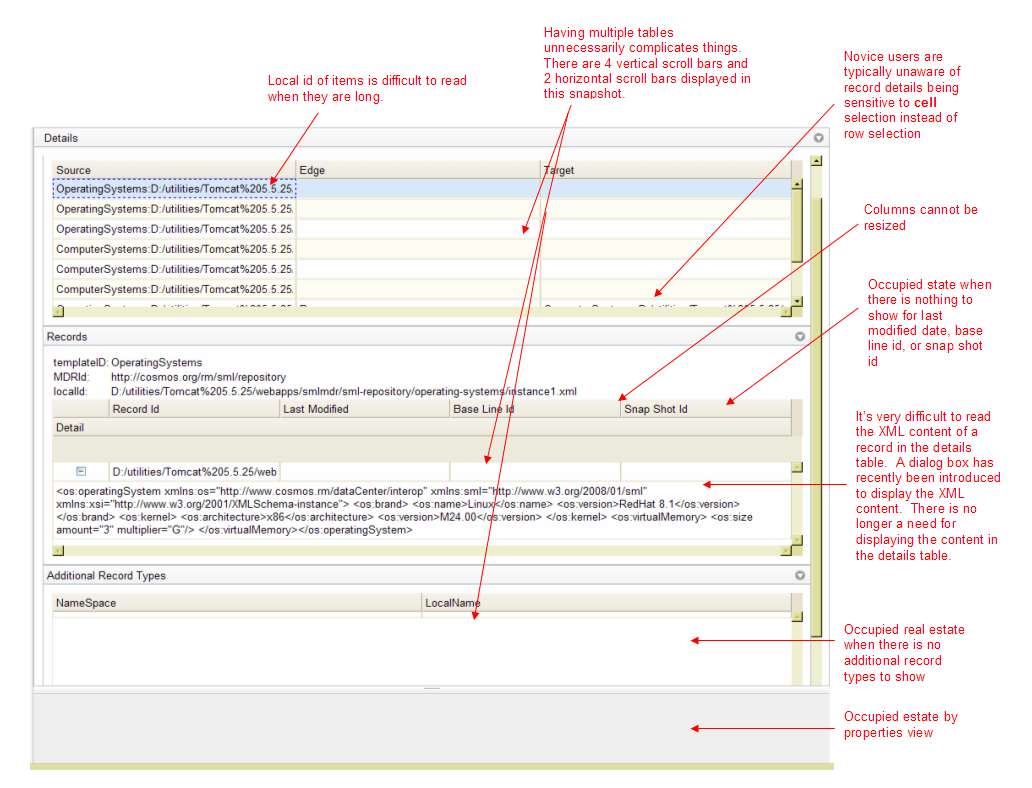
The purpose of this enhancement is to improve the graph response view displayed when querying an MDR. The view is currently convoluted and difficult to interpret by a novice user. This document lists a number of changes to improve usability and overall structure of the view.
The image below indicates a number of usability issues with the current view:

It was collectively agreed during the data visualization call (May 28/2008) for this enhancement not to replace the current graphical view. Users will have the option to use either one to display the CMDBf response.
Implementation Detail
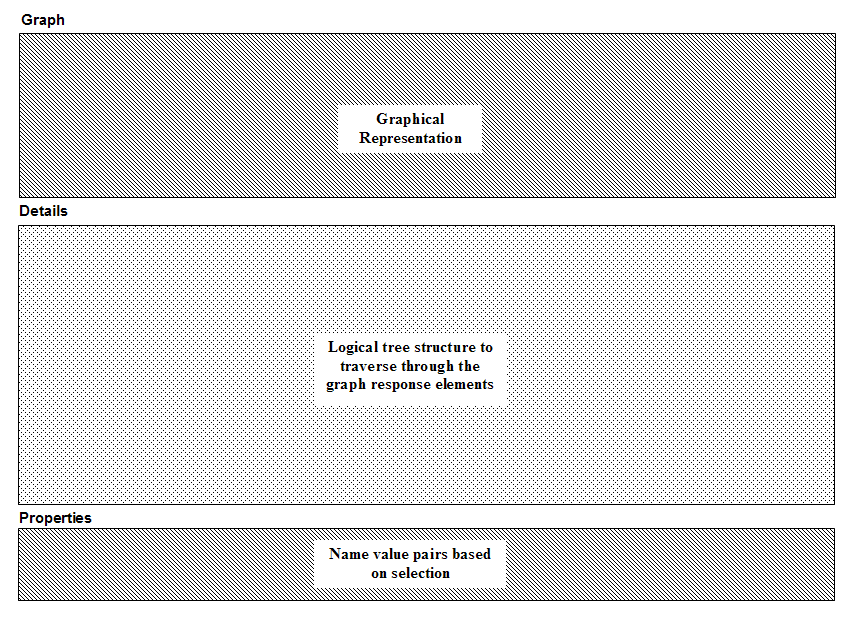
This section outlines an alternative layout to address the issues displayed above. The new layout will consist of two parts:
- A graphical view to display a visual overview of the response
- A logical tree structure to traverse through the elements of the response
The layout will consist of three sections, indicated in the image below:
Graphical View
The top most section of the view will consist of a graphical representation of the response. The section will leverage dojox.gfx APIs along with atomic shapes to render a graph. The APIs use SVG in FireFox and VML in IE to render the individual shapes. The end result is a static diagram with cross-browser support.
The image below shows a sample of what the graph will look like:
File:Graph response visual.png
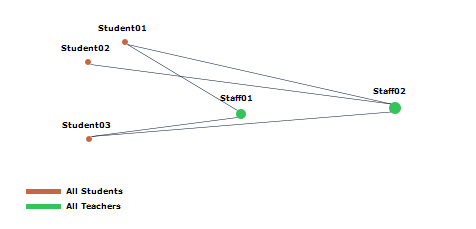
The graph layout algorithm renders adjacent nodes closer to each other. This will visually indicate entities that are closer together in relation. The radius of each node is determined by its order (i.e. outgoing edges from the node) and the color of the node is dependent on the template it belongs to. Notice a legend is displayed at the bottom of the diagram.
The graph layout algorithm is not sufficient for responses with many items or relationships. The graph is best suited for 30 or less nodes with a maximum node order of 3. The graph view will not be generated if this condition is not met. A warning will be displayed and the space will be reserved for the logical representation (see next section). Users will have the ability to discard the warning and display the graph if they choose to populate the view.
The image below displays a concrete example based on data from the student-teacher MDR. The value of this graphical overview is the ability to quickly identify relationships between two different entities. Using this diagram, the user is quickly able to identify the following relationships:
- Staff01 teaches Student01 and Student03
- Staff02 teaches Student01, Student02, Student03
Logical View
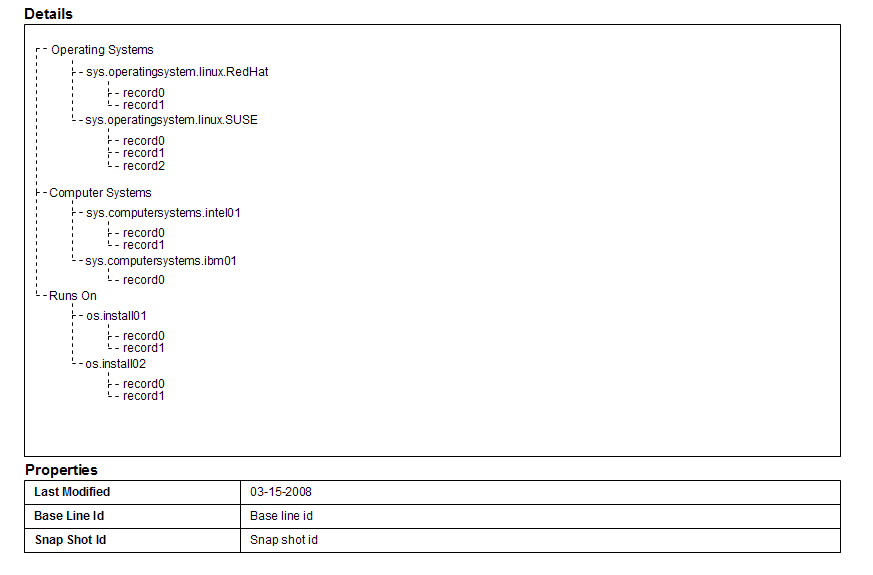
A tree structure is provided to allow traversal of the response elements. Unlike a grid structure, a tree will only occupy the space needed. The properties view will be used to display any fields associated with a selected tree node. The image below provides an overview of the tree structure:
Each level of the tree is described below:
- First level: item/relationship template ID
- Second level: the first item/relationship local ID
- Third level: record ID
The properties view will be populated based on selection of nodes. The following fields will be displayed for each tree item selected:
| Tree Item: | Fields: |
|---|---|
| Item/Relationship template | No fields will be displayed |
| Item/Relationship |
|
| Records |
|
Double clicking a record will open a dialog box with the XML content of the associated record.
Task Breakdown
The following section includes the tasks required to complete this enhancement
- Isolate the query response view as a separate test page (the one that currently exists is outdated) [complete]
- Define a structure to be used by the graph layout algorithm [complete]
- Modify outputters to generate the structure [complete]
- Create the graph layout algorithm [complete]
- Write code to render the graph [complete]
- Define a structure to be used by the logical tree structure (determine if the same structure as the graph layout can be used) [complete]
- Modify outputters to generate the structure [complete]
- Create a tree based on the structure [complete]
- Decorate the tree items with icons
- Use topic publication/subscription to detect tree item selections [complete]
- Populate the properties view based on the selection [complete]
- Create the overall layout of the view [complete]
- Add the graph and logical component to the main view [complete]
- Determine how to add this as an alternative view to displaying the CMDBf query response
Future Direction
- Showing direction of relationships in the graph view
- Displaying edges only when user hovers over a node
- Adding additional interaction (e.g. display information when hovering over a node)
- Once COSMOS has the capability of adding user profiles, add the ability to disable parts of the view users may not be interested in.
Open Issues/Questions
All reviewer feedback should go in the Talk page for 224166.


