Notice: This Wiki is now read only and edits are no longer possible. Please see: https://gitlab.eclipse.org/eclipsefdn/helpdesk/-/wikis/Wiki-shutdown-plan for the plan.
COSMOS Design 188390
Contents
Nagios Integration with COSMOS
This is the design document for bugzilla 188390.
Change History
| Name: | Date: | Revised Sections: |
|---|---|---|
| Ali Mehregani | 11/19/2007 |
|
| Ali Mehregani | 11/27/2007 |
|
| Ali Mehregani | 11/30/2007 |
|
Workload Estimation
| Process | Sizing | Names of people doing the work |
|---|---|---|
| Design | 4 | |
| Code | 14 | |
| Test | 4 | |
| Documentation | 1 | |
| Build and infrastructure | 0.5 | |
| Code review, etc.* | 0.5 | |
| TOTAL | 24 |
Terminologies/Acronyms
The terminologies/acronyms below are commonly used throughout this document. The list below defines each term regarding how it is used in this document:
| Term | Definition |
|---|---|
| MDR | Management Data Repository |
| CMDBf | Specification for a CMDB that federates between multiple MDRs |
| CMDB | Configuration Management Database |
| CBE | Common Base Event - A standard that defines a common format for logging |
| SML | Service Modeling Language - An XML based language used for modeling |
| SML Model | A set of SML compliant resources |
| SML Repository | The SML Repository describes any SML model together with a set of COSMOS API used to add new SML resources to the SML model and to query the SML model. |
| CMDBf query | MDRs make data available via a query service defined in the CMDBf specification. The input and output of a CMDBf query is a structured XML document described in the specification. |
| Host | A host in Nagios terms is any entity on a network that can be monitored (e.g. desktop, router, printer, etc...) |
| Host check | A host check in Nagios corresponds to running a command that will indicate the status of a host |
| Service | There are two types of services that can be monitored by Nagios on a host: public and private. Examples of public services are HTTP, FTP, POP3, SSH, etc... and examples of private services are CPU utilization, memory consumption, disk space, power consumption, etc... |
| Service check | Analogous to host check, a service check involves running a command that will check the status of a service |
| Command | A Nagios command is either a shell executable or a Perl script that performs a specific task (e.g. host/service check) |
Introduction
The COSMOS vision is entailed in the definition of what COSMOS is - "The world or universe regarded as an orderly, harmonious system". The intention of the project is to apply the same principle to the world of system management. Complementing standards such as SML, CMDBf, WSDM Event Format, WS-Notification, and Web2.0 technologies are making this vision a reality. The overall COSMOS vision is to provide an extensible framework, based on a set of acceptable standards, to simplify the task of building an ecosystem of existing system management tooling.
Inline with this vision is the ability to integrate systems management environments through loosely coupled services exposed via interfaces defined in open standards. In many circumstances, management environments are already well established and configured within an enterprise. These environments typically use a wide variety of heterogeneous management software that is pieced together for form a complete solution. It is not uncommon to find software from different vendors or open source for a particualar aspect of management, e.g. monitoring, configuration, et. The goal of this enhancement request is to provide a standards based integration strategy, based on the CMDBf specification for exposing configuration data contained within a Nagios server.
The next three sections provide a brief overview of Nagios, WS-Notification, and WSDM Event Format.
What is Nagios?
Nagios is a system and network monitoring application that is capable of detecting and notifying abnormal behavior. The definition and monitoring behavior is defined by administrators using a set of flat-file configurations. The files indicate what and how things should be monitored. There are three primary atomic entities in Nagios:
| Host | A physical device on a network that is intended to be monitored (e.g. a desktop, printer, router, switch, hub, etc...). |
| Service | Indicates the specific component of a host that should be monitored (e.g. CPU utilization, memory consumption, HTTP, etc...) |
| Command | A utility that allows for a host/service check, notification handling, alerts, etc.... For example, check_CPU can be a command used to monitor the CPU utilization on a particular host. |
An administrator is required to define hosts, services, and commands to effectively monitor a set of resources. The actual monitoring of a host/service is not done by Nagios. It is instead done by add-on plug-ins that are defined as individual commands. This architecture provides the capability to virtually monitor any aspect of a system that can be automated. There are already many available plug-ins for monitoring common hosts/services in a typical networking environment. Where limited, administrators can write their own plug-in to accomplish the monitoring of an uncommon host/service. The data collected from plug-ins are logged to flat files. Nagios itself doesn't persistent events to a database but plug-ins are available to direct events to an RDBMS such as MySQL.
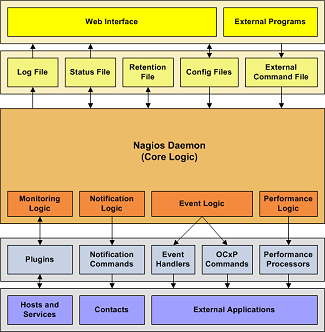
The Nagios service runs on Linux but it is capable of monitoring desktops running Windows via its plug-in architecture. As part of its monitoring solution, Nagios also provides an alerting mechanism that broadcasts a problem to sets of contacts or contact groups. A notification handler can also be registered to take certain actions based on incoming events (e.g. storing status information in an RDBMS). The diagram below, extracted from Nagios documentation, pictorially depicts the components:
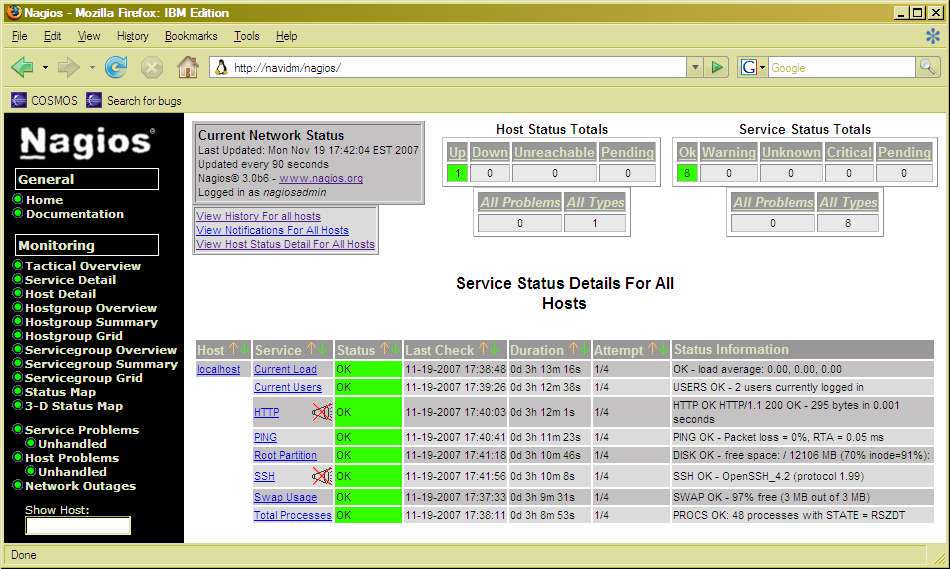
There is also a web-based UI included that provides reporting and limited administration capabilities. A screen shot of the Nagios web-based UI is included below.
See Nagios user guide to find out more about its capabilities.
What is WS-Notification?
WS-Notification is an umbrella for a set of specifications that describe the publishing and subscription of events in the context of Web services. There are three specifications that fall under WS-Notification:
The first specification is used to describe the basic interfaces and calls required by notification producers and consumers, the second specification describes a middle tier between a producer and a consumer, and finally the third specification describes the structure of topics for publishing and subscription.
COSMOS intends to provide a notification broker as part of its framework for publication and subscription of events. The notification broker should not be confused with the broker that resides in the management domain. They are separate entities with different functionalities. There are separate enhancements to cover the implementation detail of the notification broker and incident manager. The incident manager will be discussed later.
The following is a list of terminologies commonly used in the context of WS-Notification:
| Term | Definition |
|---|---|
| Notification Producer | An entity that creates a notification message |
| Notification Consumer | An entity receiving a notification message |
| Subscription | The act of advertising the interest for listening on a set of topics |
| Publishing | The act of advertising the interest for producing notification on a set of topics |
| Topic | A hierarchical structure to categorize the notification messages produced. |
| Topic Space | A forest of topic trees (i.e. a series of topic tress) |
WS-Notification falls short of defining a well structured event format as part of the notification message produced by a producer. The structure of the message is left to the entity creating the message. COSMOS will use WSDM Event Format (WEF) to report messages using a well defined structure. The next section gives a brief overview of what WEF is.
What is WEF?
WEF or WSDM Event Format is a well-structured XML language used to represent management event information. The format was established based on the submission of Common Base Event specification to OASIS by IBM and Cisco. The base requirement of the event format is described in part 1 of WSDM:MUWS and an extension is developed in part 2 of WSDM:MUWS. COSMOS will leverage the situation element described in part 2. The pseudo-schema of the event format as described in part 1 is shown below:
 <muws1:ManagementEvent ...
  muws1:ReportTime=”xs:dateTime”?>

    <muws1:EventId>xs:anyURI</muws1:EventId>

    <muws1:SourceComponent ...>
    <muws1:ResourceId>xs:anyURI</muws1:ResourceId> ?
    <muws1:ComponentAddress>{any}</muws1:ComponentAddress> *
    {any}*
    </muws1:SourceComponent>

    <muws1:ReporterComponent ...>
    <muws1:ResourceID>xs:anyURI</muws1:ResourceId> ?
    <muws1:ComponentAddress>{any}</muws1:ComponentAddress> *
    {any}*
    </muws1:ReporterComponent> ?
    {any}*
 </muws1:ManagementEvent>
The pseudo-schema of the situation element as described in part 2 of the specification is shown below:
 <muws2:Situation>
    <muws2:SituationCategory>
    muws2:SituationCategoryType
    </muws2:SituationCategory>

    <muws2:SuccessDisposition>
    (Successful|Unsuccessful)
    </muws2:SuccessDisposition> ?

    <muws2:SituationTime>xs:dateTime</muws2:SituationTime> ?
    <muws2:Priority>xs:short</muws2:Priority> ?
    <muws2:Severity>xs:short</muws2:Severity> ?
    <muws2:Message>muws:LangString</muws2:Message> ?

    <muws2:SubstitutableMsg MsgId=”xs:string” MsgIdType=”xs:anyURI”>
    <muws2:Value>xs:anySimpleType</muws2:Value>*
    </muws2:SubstitutableMsg> ?
 </muws2:Situation>
Purpose
The purpose of this document is to describe how COSMOS, and by extension commercial vendors, can leverage standard interfaces to integrate with an existing Nagios sever via industry standard interfaces.
Scope
There are three areas where the standards supported and applied in the COSMOS project can help integrate existing management infrastructures.
- Standardized query interfaces for access to management data
- Integration through publication and subscription of events via standards based APIs in a standardized format
- Reporting and visualizations based on standard event format
Standardized Query Interfaces
The contribution of a CMDBf query service on top of a Nagios server will provide a standardized mechanism for querying the configuration items managed by Nagios. A CMDBf query service will also allow Nagios to participate in a federating CMDB environment. It will also make it easier to integrate multiple Nagios servers and/or commercial-based solutions under one infrastructure.
There are 10 different object types defined in Nagios:
1. Hosts
2. Host Groups
3. Services
4. Service Groups
5. Contacts
6. Contact Groups
7. Commands
8. Time Periods
9. Notification Escalations
10. Notification and Execution Dependencies
The first 6 object types are examples of configuration items that can be exposed via a CMDBf query service. Operational data such as the status of a host/service will not be exposed via the query service. This information will instead be published to a notification broker described in the next section.
Publication and Subscription of Nagios Events in a Standard Format
An existing Nagios infrastructure is typically setup to raise a set of events to the server. Each management products is forced into a pairwise integration if they would like to leverage information surfaced through an existing Nagios environment. As part of this enhancement a mechanism and set of best practices will be provided that enable existing Nagios implementations to surface events in standardized format using standardized APIs. In addition to loosely coupled integration, by adopting these standard WS based interfaces and management topics, commercial vendors may also provide value added event management systems.
Using this mechanism, Nagios can leverage WS-Notification to publish events on a set of topics to indicate the status of the monitored hosts and services. These events will be delivered to any client that subscribe for the published topics. Using standards, COSMOS can provide a framework to allow the publication and subscription of events in the context of web services. This provides a mechanism to for integration with higher level of management capabilities using commercial based offerings. See Use Cases for a concrete example.
Reporting and visualizations based on standard event format
COSMOS can generate BIRT reports based on events in the standard format. These reports will be generated from events reported to the COSMOS data managers. In addition, adopters can provide a custom report template that generates a report tailored to produce the information they need. This will help facilitate the growth of an ecosystem of reports that can be consumed by any management application that supports the standard event format.
Requirements
The following is a list of requirements that falls in the scope of the Nagios/COSMOS integration:
- Provide the capability of querying the configuration items of a Nagios server using the CMDBf query APIs
- Publish a topic space to the notification broker based on Nagios events being monitored
- Notify the notification broker when a situation related to a topic is reached
- Provide a set of effective reports in analyzing notification messages created by Nagios servers
Use Cases
The following use cases outline some of the typical tasks that COSMOS adopters/end-users will perform to accomplish an objective.
Use Case 1: Leveraging Federating CMDB with Nagios MDRs
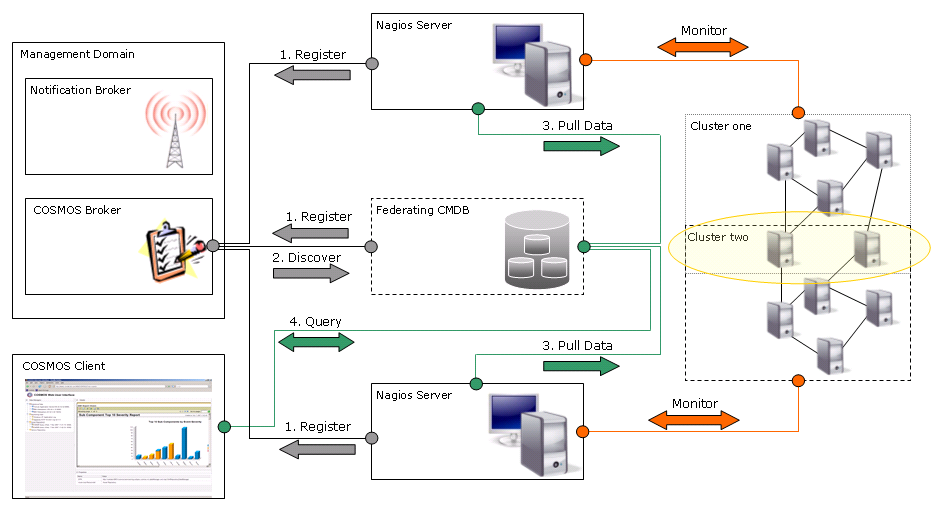
A federating CMDB is not in the scope of the COSMOS project but a commercial vendor can register one with the COSMOS framework. This use case explains how multiple instances of Nagios servers (equipped with COSMOS MDR/plug-in code) can participate in the presence of a commercial-based federating CMDB.
- A federating CMDB is registered with the COSMOS framework
- The federating CMDB discovers the EPR of Nagios MDR registered with the COSMOS framework
- Using the pull-mode, the federating CMDB submits a CMDBf query to retrieve the configuration items managed by the Nagios servers
- The data retrieved from all servers are federated
This capability enables adopters to create aggregated reports or views on resources managed by multiple Nagios MDR. This is also possible with Nagios and a commercial management solution configuration. The only requirement is the registration of the commercial solution as an MDR.
The figure belows depicts a concrete example of Nagios instances participating in a federating CMDB environment. The two servers monitor cluster of nodes that overlap (see highlighted section). The federating CMDB can consolidate the data between the two servers to provide an aggregated view.
Use Case 2: Retrieving the Configuration Items of a Nagios MDR
This use case explains the steps required by an end-user to visualize the configuration items/manageable resources that is being monitored by a Nagios server.
- User opens a browser and points to the URL of the COSMOS client
- User right clicks the Nagios item displayed under the data manager navigator and selects 'Submit CMDBf Query'
- A CMDBf query is submitted
- The generic XML viewer is opened with the response to the query
A view will be implemented to better visualize configuration items that conform to an SML model. Similar to the CMDBf query action, this option will be available through Nagios' context menu. Adopters can also leverage this view by conforming to the SML-based model defined in COSMOS.
Use Case 3: Subscription to Nagios Events
This use case is relevant to adopters who intend to use Nagios events to provide higher level management capabilities in COSMOS. The client subscribing to events can be a web service, data manager, or simply a standalone application that is capable of communicating with COSMOS framework. The steps below refer to the Nagios notification consumer as simply the client:
- Client contacts the management domain
- Client retrieves the broker(s) of the management domain
- Client retrieves the EPR of a desired Nagios server
- Client retrieves the notification broker using the management domain's API
- Using the EPR of the Nagios server, client retrieves the topic space published by the Nagios server
- Client subscribes to a set of topics from the topic space using the notification broker APIs
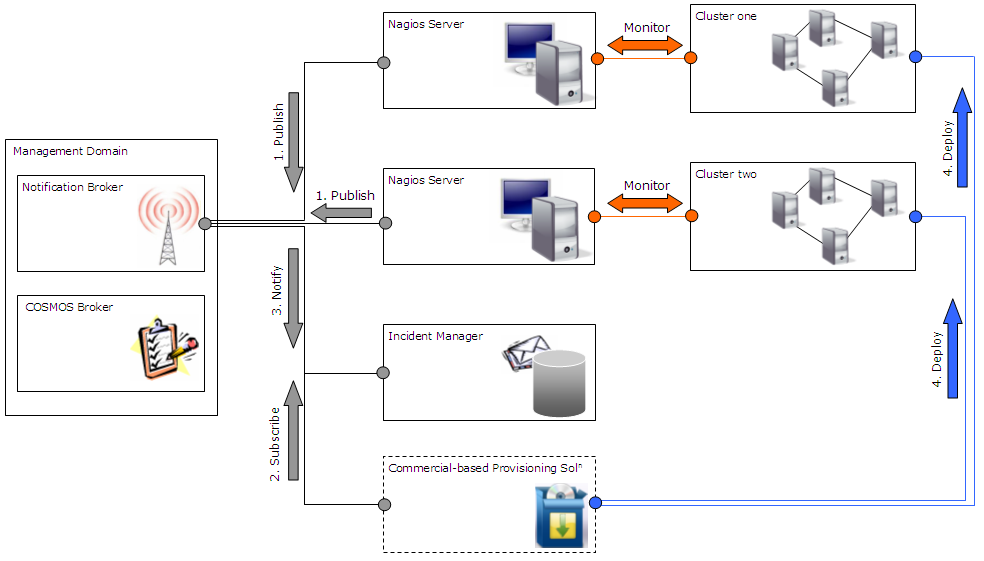
After the subscription, the client will be notified of any situations that correspond to the topics published by the Nagios server. The diagram below pictorially describes a concrete example of how notification events from Nagios servers can be consumed by a commercial offering.
Assume the existence of three data managers:
- A commercial-based provisioning solution capable of deploying software to multiple nodes
- A Nagios server monitoring a cluster of nodes
- A second Nagios server monitoring a different cluster of nodes
The two Nagios servers are used to monitor the current patch level on a set of Windows nodes. The Nagios servers can publish a topic to the notification broker to describe the patch level The provisioning solution can then subscribe to this topic and deploy any necessary update when available. The notification broker is assumed to reside in the management domain and the events are assumed to be persisted by an incident manager:
Use Case 4: Generating Reports Based on WS-Notification Messages
As discussed in section "[Publication and Subscription of Nagios Events]", it's assumed that a data manager called "incident Manager" persists all notification messages reported to the notification broker. Just like any data manager, a set of associated reports can be used to visualize the events generated by multiple notification producers (e.g. Nagios server). This use case explains the steps required in generating an availability report on WS-Notifications.
- User opens a browser and points to the URL of the COSMOS client
- User right clicks the "Incident Manager" item displayed under the data manager navigator and selects 'Generate Report > Availability'.
- A report is generated and displayed based on notification messages persisted by the incident manager
This low coupling architecture provides the ability to generate reports on messages produced by completely different management solutions. An adopter desiring to use COSMOS notification reporting facility will only need to register as a data manager and a notification producer. The adopter will be able to reuse the same reports for as long as the message conforms to WSDM Event Format (WEF).
Implementation Detail
Integrating Nagios will span features across two sub-projects: Management Enablement and Data Visualization. The integration can be separated into three enhancements. Each enhancement indicates the subproject that it will reside in:
- Registering Nagios as an MDR (Management Enablement)
- Making Nagios a Notification Producer (Management Enablement)
- Reporting on WS-Notification Messages (Data Visualization)
This integration depends on an implementation of a notification broker and an incident manager. It's expected for the notification broker to conform to the WS-NotificationBroker standard. The incident manager is expected to persist messages disseminated by the the notification broker.
Registering Nagios as an MDR (Management Enablement)
This enhancement will be concerned with the following tasks:
- Providing a CMDBf query for retrieving configuration items of a Nagios server
- Mapping the configuration items to an SML model
- Registering the Nagios server as an MDR with the COSMOS framework
- Providing a hierarchical view to display the manageable resources of the Nagios server
- Registering the view with the Data Visualization framework
An effective implementation of this enhancement will allow a user to:
- View a configured Nagios server under the data manager navigator
- Allow the user to retrieve and view the manageable resources monitored by the Nagios server
- Provide the ability to submit CMDBf queries to Nagios servers
Making Nagios a Notification Producer (Management Enablement)
This enhancement will be concerned with the following tasks:
- Providing a Nagios plug-in to capture all notification messages
- Define a mapping from the notification message to a WSDM event format
- Publish a topic space related to the notification messages that can be produced
- Notify the notification broker of any situations that occur
- Provide a mechanism for adopters to extend the topic space published by Nagios servers
An effective implementation of this enhancement will allow an adopter to:
- Discover the Nagios topic space published to the notification broker
- Subscribe to the Nagios topics
- Receive notification on Nagios topics
Reporting on WS-Notification Messages (Data Visualization)
This enhancement will be concerned with the following task:
- Define a set of report templates that can be associated with the incident manager
An effective implementation of this enhancement will allow the user to:
- Generate reports based on events reported by Nagios server(s)
Open Issues/Questions
All reviewer feedback should go in the talk page for Nagios integration with COSMOS.


