Notice: This Wiki is now read only and edits are no longer possible. Please see: https://gitlab.eclipse.org/eclipsefdn/helpdesk/-/wikis/Wiki-shutdown-plan for the plan.
CDT/User/NewIn92
Release
This is the New & Noteworthy page for CDT 9.2 which is part of the Eclipse Neon.2 update release of December 2016
Editor
Syntax coloring for variables passed by non-const reference
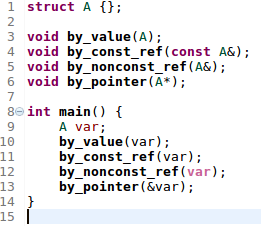
Variables passed by non-const reference are unique in that the callee can modify the original variable (unlike variables passed by value or by const reference), but there is no syntactic marker indicating this at the call site (unlike variables passed by pointer, where you need to take the address at the call site).
To allow readers of code to identify such call sites more readily, CDT 9.2 adds a new syntax coloring for variables passed by non-const reference:
The new highlighting is disabled by default. It can be enabled in Preferences -> C/C++ -> Editor -> Syntax Coloring -> Code -> "Variables passed by non-const reference".
Parser
Support for C++14 constexpr evaluation
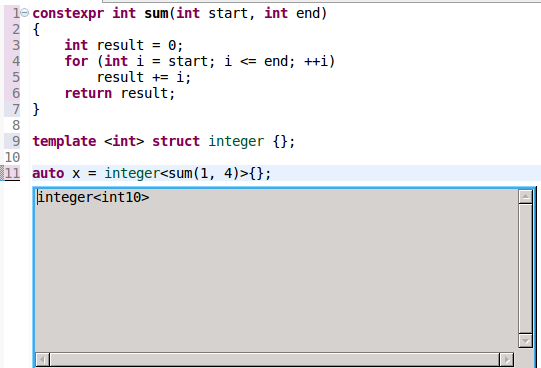
C++14 expanded the scope of what's allowed inside a constexpr function, to allow variable declarations and most control statements such as loops. CDT now supports evaluation of constexpr functions that make use of these features.
In this example, CDT simulates the execution of a constexpr function that contains a for loop to determine that the type of x is integer<10>.
Debug
Debugger Console view
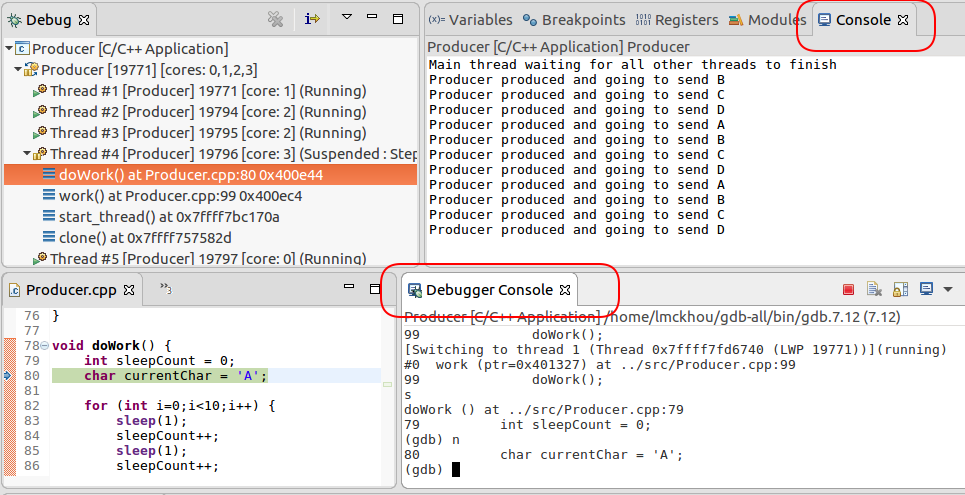
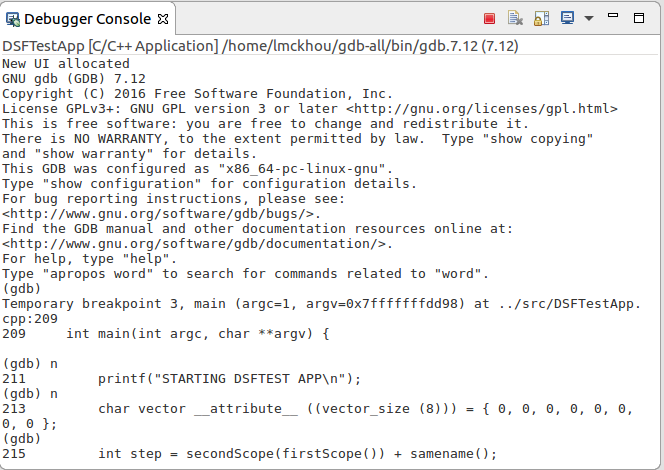
CDT 9.2 introduces a new Debugger Console view. This view provides access to the command-line interface of the debugger used by CDT. The view should open automatically when a new debug session is started. Although it can be useful, this view is not essential to the use of the CDT debugger, and users that don't plan to interact with the debugger through the command-line can simply hide the view behind any other.
Using such a view allows to control the debugger through the command-line while still looking at the output of program being debugged in the standard Eclipse Console view.
Full GDB Console
CDT 9.2, when used on Linux with GDB 7.12, provides a full-featured GDB command-line console in Eclipse. This console is accessible through the new Debugger Console view. The full GDB console defaults to white to better blend with the other views in Eclipse...
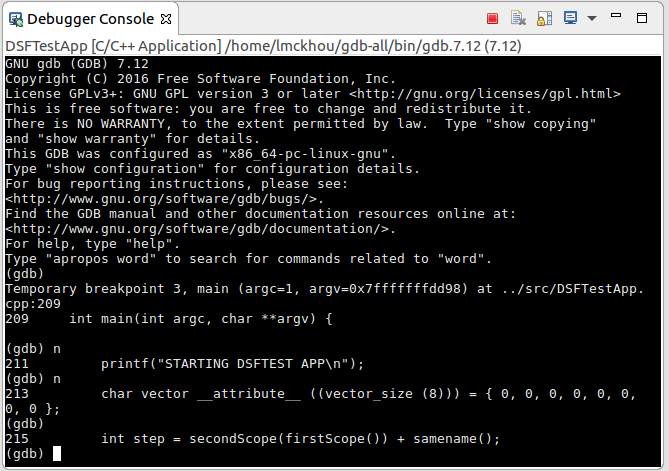
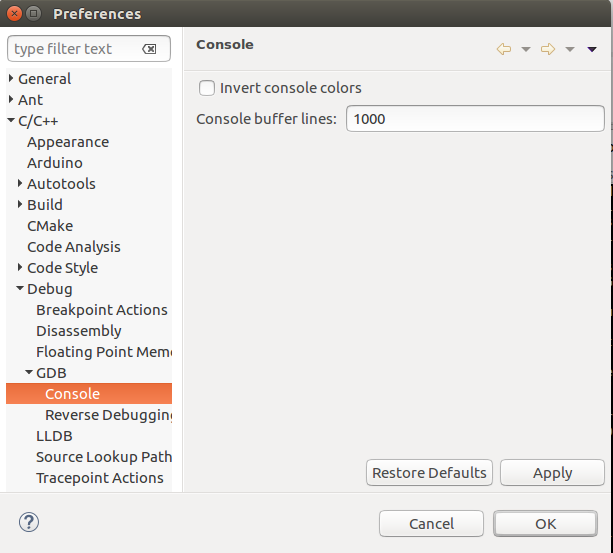
...but can be set to black, for the real hacker in you, by using the console preferences (see below).
Remember that you need to run on Linux and you must use GDB 7.12 (or later). In that environment, the full GDB console will be used automatically. In any other environment, the legacy (much more limited) console previously used by CDT will be used, and also displayed in the Debugger Console view.
The full console provides every feature of the standard GDB command-line. This includes:
- prompt
- command-completion (pressing <TAB>)
- command-history (pressing arrow-up or arrow-down)
- command-editing (by pressing the arrow-left)
- command-repetition (pressing <Enter> to repeat a command>
- setting breakpoints (which will be also set in Eclipse)
- Resuming, interrupting, stepping execution
- and hundreds more
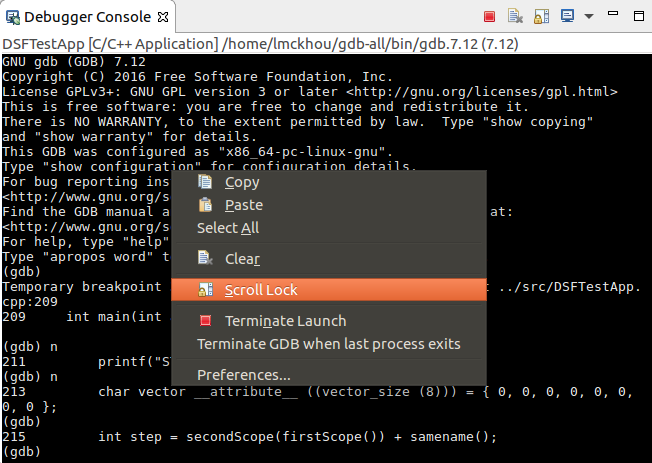
The full console provides a context-menu that allows to access common console options. It also allows to quickly access the preferences of the console. For the most part, these options are self-explanatory; by disabling the "Terminate GDB when last process exists" option, CDT will keep GDB alive even when the process being debugged has terminated; this allows the user to restart that process, or to perform other operations from the GDB console.
The user can access the console preferences through the context-menu of the view, or under the GDB preference section.
This feature was completed through Bug 303808.
Running All-stop mode Asynchronously
Before this release the default all-stop mode (all threads stop) has been working in synchronous mode towards GDB. When working in synchronous mode GDB will wait for the program to stop before processing MI commands.
In this release the all-stop mode is now running in asynchronous mode when interacting with GDB versions greater than or equal to 7.12, so GDB will now be able to accept MI commands when the program is running (Even if GDB can accept a command while the target is running, many commands that access the target don't work when the target is running).
This change was needed in order to enable the new "Full GDB console" for all-stop mode however this will facilitate future enhancements e.g. Showing the running threads in the debug view (Similarly to the non-stop mode).
Selection synchronization with GDB
To fully take advantage of the Full GDB Console it is essential that both the full console and the Eclipse UI be kept in sync. This includes the current selection. With this in mind, CDT 9.2 now synchronizes the selection of the Debug view and the selection within the GDB console. The synchronization is done in both direction. This means that if the user selects thread 1 in the Debug view, thread 1 will become selected in GDB; and if the user selects frame 1 in the GDB console (by typing 'frame 1'), the Debug view will automatically set its selection to frame 1 (of the correct thread).
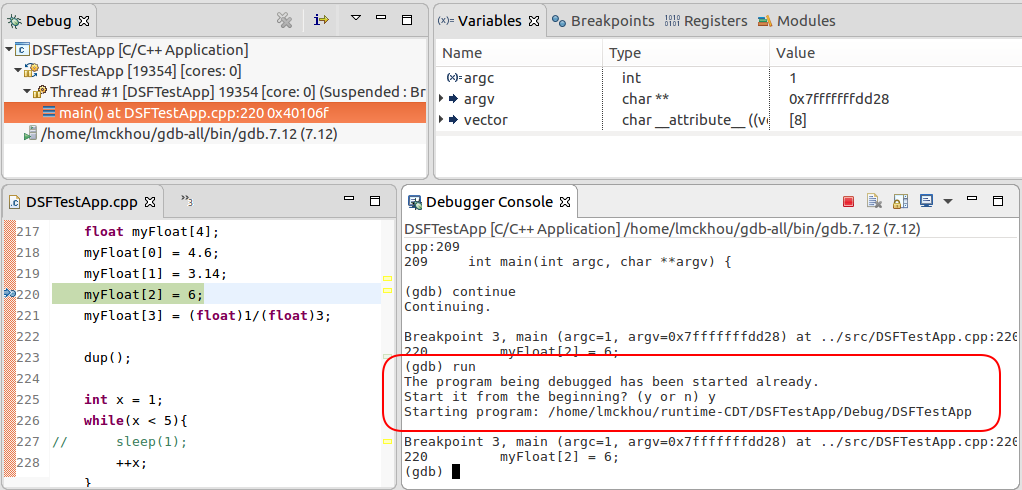
Ability to restart a process from the GDB console
CDT now supports restarting a debugged process directly from the GDB console. The restarted processes output will continue to be displayed in the standard Eclipse Console view.
Display GDB thread ids in the Multicore Visualizer
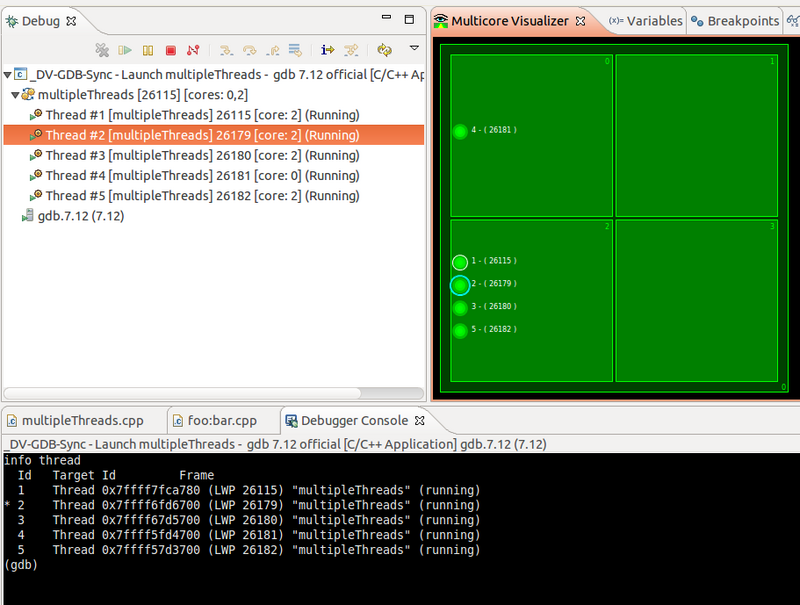
The Multicore Visualizer shows all threads of the process(es) being debugged. Previously, each thread would be represented by a dot followed by the OS thread id of that thread (PID on Linux).
With this enhancement, the GDB thread id is also displayed, making it easier for the user to map the threads in the Visualizer to the threads in the Debug View and in the Debugger Console.
This feature was completed through Bug 501006.
Hide gdb traces by default
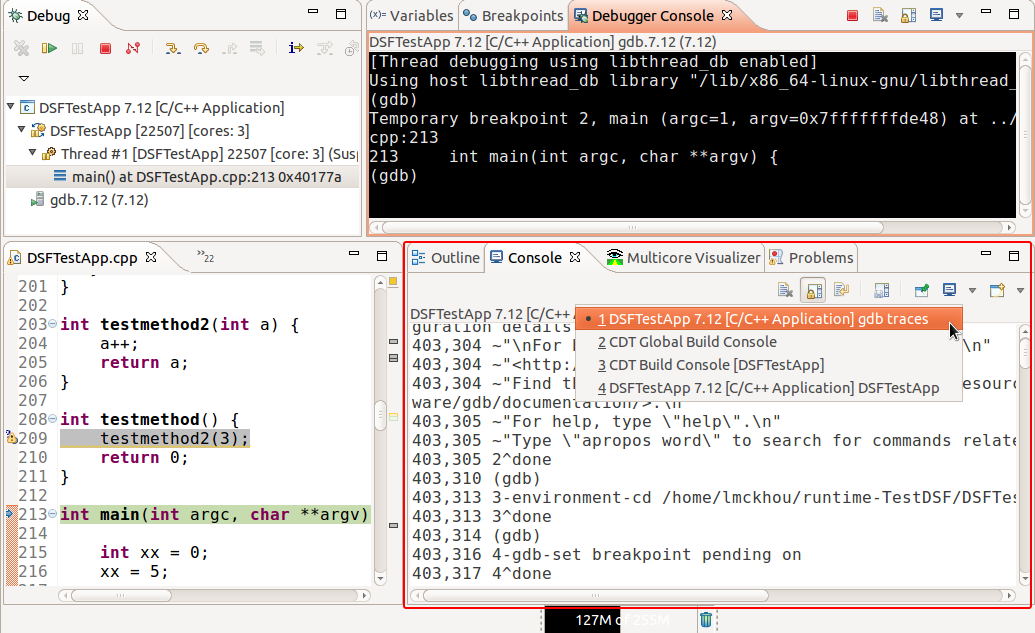
For many releases a dedicated console has been used to display the communication between CDT and GDB when debugging. These traces, referred to as 'gdb traces', are an implementation detail and should not be of interest to the standard user. However, as they provide a very valuable tool for troubleshooting debug issues, they were being displayed by default as safety precaution.
In this release, the 'gdb traces' have been made to be enabled but hidden by default. In this fashion, they will not be visible to the standard user, thus reducing the IDE complexity slightly, but will be available when troubleshooting is required. The below image shows the console when the 'gdb traces' are explicitly made visible by the user through a preference.
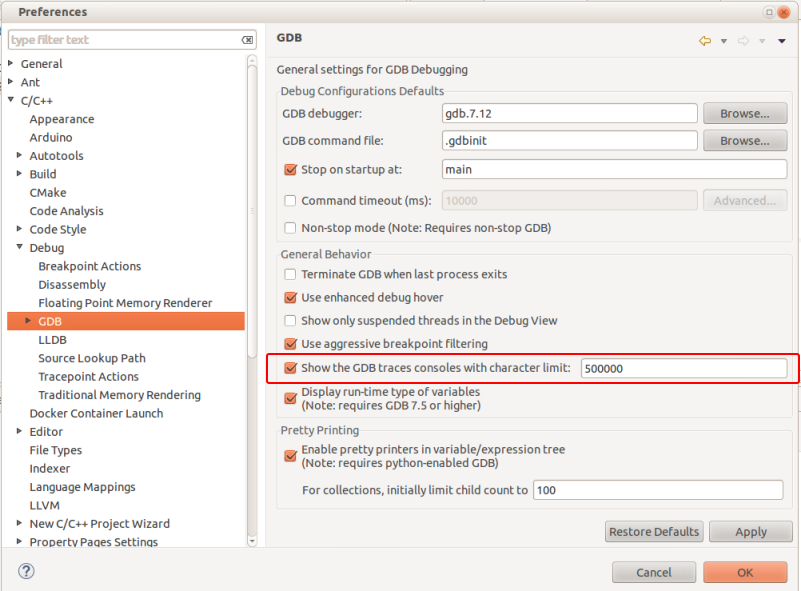
To enable those traces go to Preferences->C/C++->Debug->GDB and enable the preference called "Show the GDB traces consoles". The size of the console buffer can still be set using the corresponding text preference. Note that the GDB traces will always be enabled and be recorded and that the preference in question is only used to display or hide the actual 'gdb traces' console.
Bugs Fixed in this Release
See Bugzilla report Bugs Fixed in CDT 9.2

