Notice: This Wiki is now read only and edits are no longer possible. Please see: https://gitlab.eclipse.org/eclipsefdn/helpdesk/-/wikis/Wiki-shutdown-plan for the plan.
CDT/User/NewIn84
Debug
Dynamic-printf
CDT now supports the concept of dynamic-printf as provided by GDB 7.7. Using a dynamic-printf gives you the effect of inserting a printf call into your program on-the-fly, without having to recompile it or restart it. The output of a dynamic-printf will be sent to the same place as a compiled printf; this is true when debugging a local program, attaching to one, or debugging/attaching to a remote one. This behaviour allows dynamic-printfs to really be used the same way as a compiled printf.
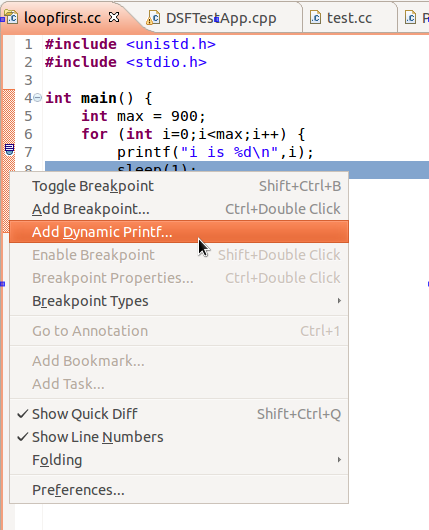
To set a dynamic-printf, simply right-click on the margin of the editor at the line of interest and choose "Add Dynamic Printf...".
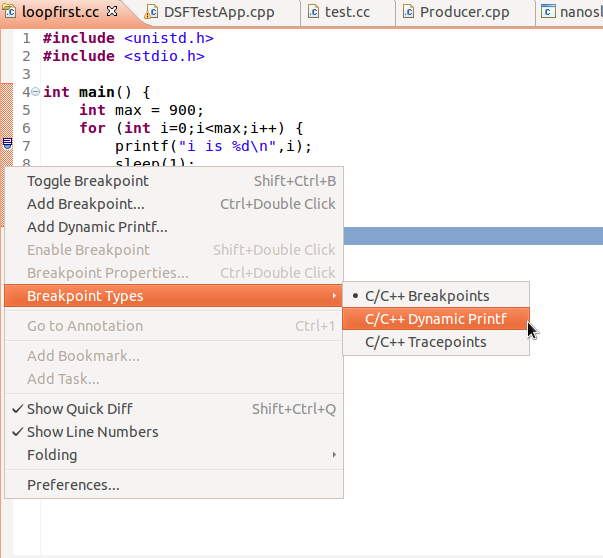
If you plan on adding many dynamic-printfs, you can change the default behaviour of double-clicking on the editor margin to set dynamic-printfs instead of normal breakpoints. To do this, right-click on the margin of the editor and select "Breakpoint Types->C/C++ Dynamic Printf". After that, all breakpoint creations will in fact create dynamic-printfs using a default printf string (which can be changed in "Breakpoint Properties...").
Limitations to be aware of:
- GDB 7.7 or higher is required
- At the time of the release of CDT 8.4, adding a dynamic-printf to a tight loop can cause major degradation of Eclipse's performance when using GDB 7.7. This will no longer be a problem once GDB 7.8 is released, or CDT 8.5. When running CDT 8.4 and GDB 7.7, it is highly recommended not set a dynamic-printf in a tight-loop.
- If GDB is not able to directly call 'printf' from within your program, the dynamic-printf output will not go the same location as normal printf output; instead it will be sent to the gdb console of Eclipse. We have seen this on some versions of Ubuntu 32bit.
Note that a Dynamic-printf can also be added from the Disassembly view.
This feature was completed through Bug 400628.
Showing return value of method after a step-return
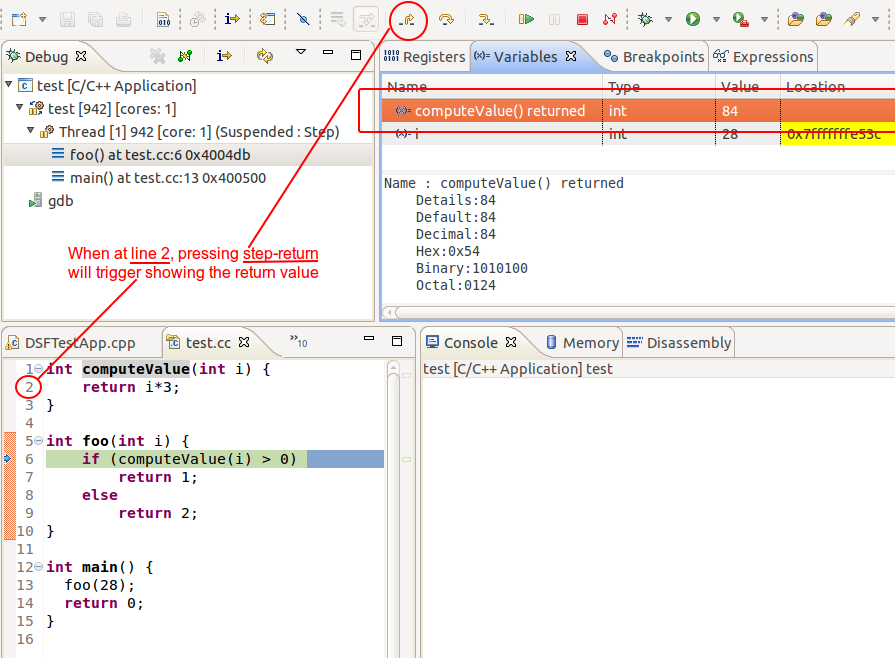
CDT will now show the return value of a method call (if there is one) following a step-return operation. This value will be shown as the first element of the Variables view. This feature was completed through Bug 341731.
Trace Control view enhancements
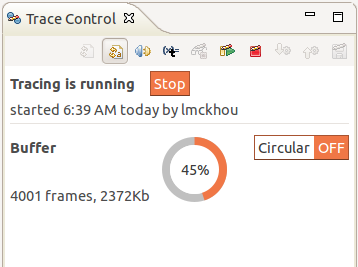
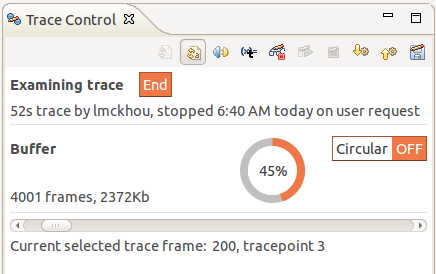
The Trace Control view has gotten a new look which is much more graphical. It aims at making the view easier to use, to understand, and to provide information quickly.
The below screenshot shows the new view while a trace experiment is running:
This screenshot shows the new view while examining the result of a tracing experiment:
For more details on tracing an application see this trace FAQ section. This work was a contribution from Dmitry Kozlov through Bug 390827.
Change breakpoint type
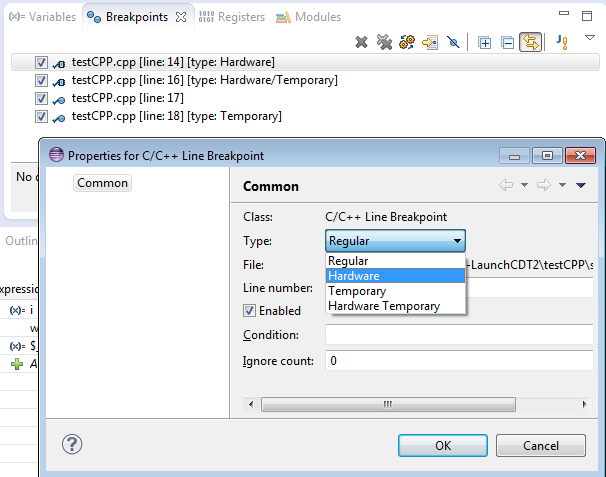
Breakpoint type is now an editable property. CDT will allow changing breakpoint type to Regular/Hardware/Temporary/Hardware Temporary from breakpoint property page. Breakpoint type can also be specified when adding a new breakpoint with "Add Breakpoint ..." action.
The feature has been completed through Bug 427898
Opcodes in Disassembly View
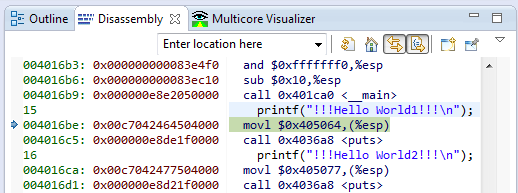
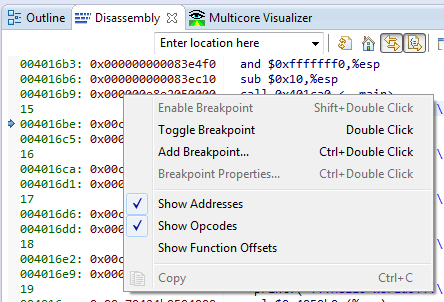
CDT will now show opcodes in the disassembly view when "Show Opcodes" is active.
This work was a contribution from William Riley through Bug 357270.
Tooltip support in Multicore Visualizer
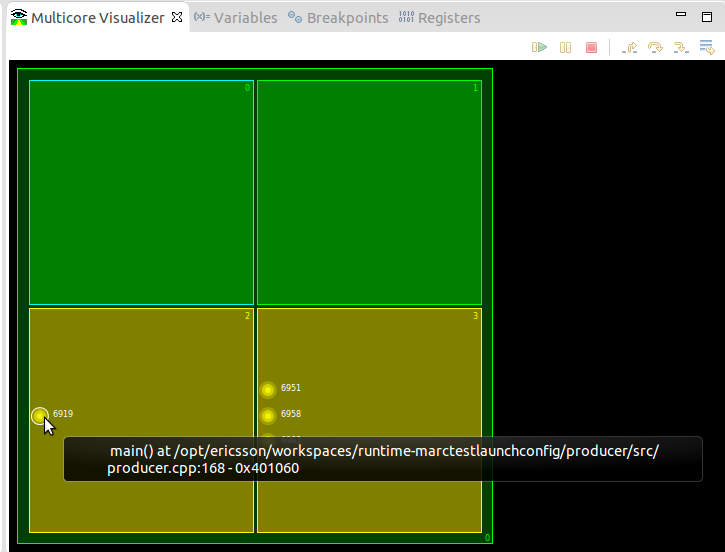
The Multicore Visualizer now has tooltips available, when using the mouse to hover over a stopped thread. It will show available information about that thread, like source code file / line, function name, address.
This work was a contribution from Xavier Raynaud through Bug 431935.
Stand-alone Debugger
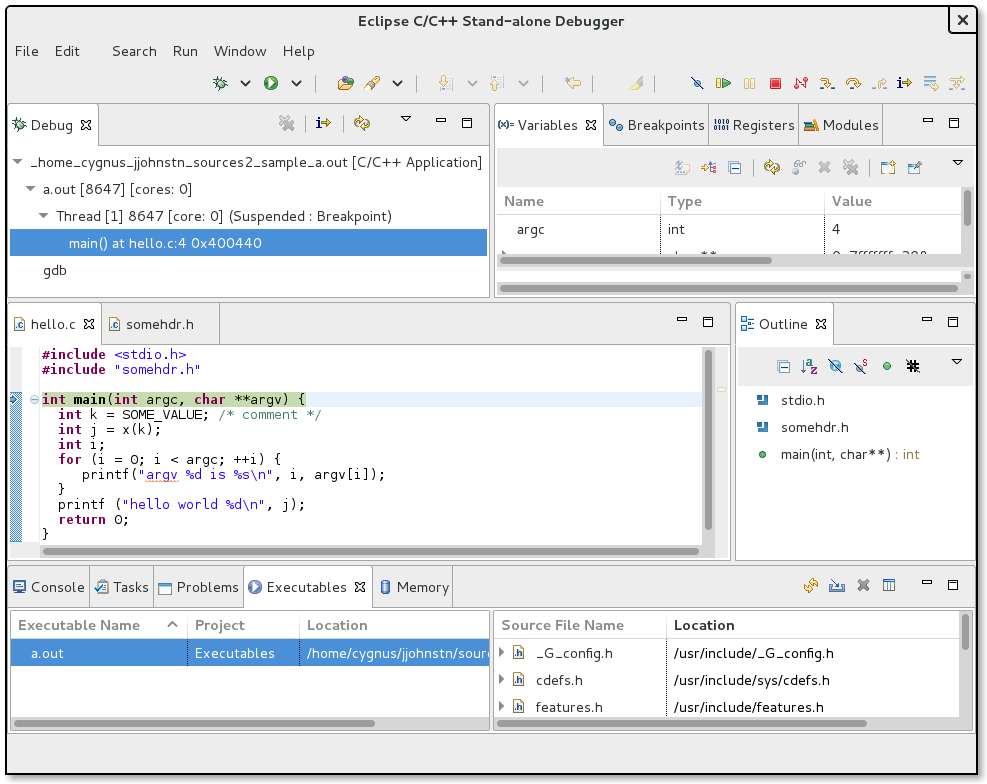
CDT 8.4 has added support for invoking the CDT debugger as an Eclipse application. Users can start the C/C++ debugger directly from the command-line as they would for gdb, specifying an executable, an optional core-file, or request to attach to an existing executable. In addition, a user may specify a build log file to assist the CDT indexer in calculating include paths and compiler flags. The Stand-alone Debugger starts as subset of the full CDT and does not include plug-ins associated with build.
For details on how to install the script to your local home directory, see the:
CDT Stand-alone Debugger Wiki-page
C++11/14
Support for C++ Attributes
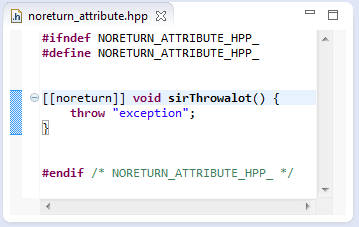
Since C++11 additional attributes can be specified for various source constructs like functions (N2761). CDT 8.4 supports the recognition of C++ attributes in syntactically correct locations.
Currently, there is no semantic analysis of the attributes. CDT's code analysis could be extended to perform meaningful checks.
General
CDT 8.4 requires JRE 1.7 or higher to run.
CDT 8.4 requires Eclipse 4.x and no longer runs against 3.x.
Bugs Fixed in this Release
See bugzilla report Bugs Fixed in CDT 8.4

