Notice: This Wiki is now read only and edits are no longer possible. Please see: https://gitlab.eclipse.org/eclipsefdn/helpdesk/-/wikis/Wiki-shutdown-plan for the plan.
CDT/User/NewIn83
Contents
- 1 Build
- 2 Indexing
- 3 Debug
- 3.1 Threads displayed by creation order in the Debug view
- 3.2 Support for multi-process debugging in Memory views
- 3.3 Enhanced support for multi-process debugging in Registers view
- 3.4 Register view is now stack-frame-specific
- 3.5 Basic support of Multicore Visualizer in all-stop mode
- 3.6 Variable substitution for GDB command file path
- 3.7 Project-less debugging is now supported on the Windows platform
- 3.8 Detection of target disconnection
- 4 Qt Support (preview)
- 5 Bugs Fixed in this Release
Build
Toolchains
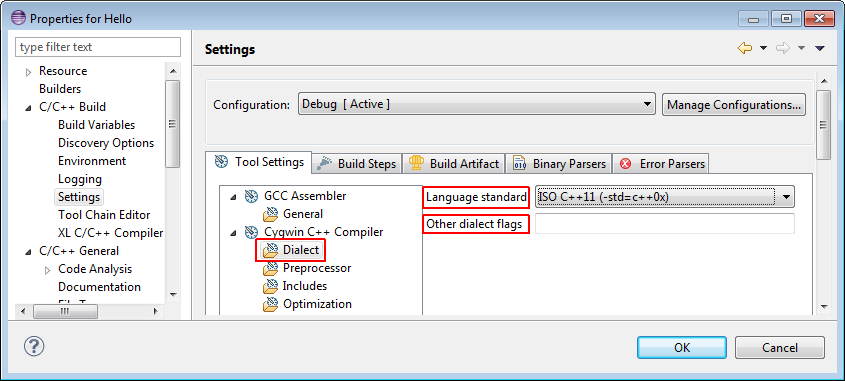
- Language dialect options in GNU toolchain definition (Bug 404913).
Scanner Discovery/Language Settings Providers
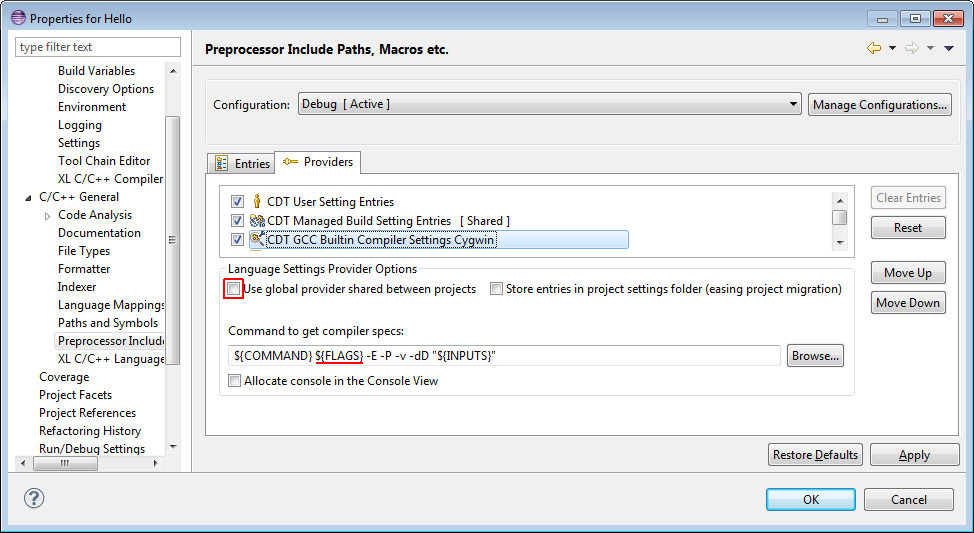
- Use applicable options (such as language dialect) from build settings during discovery of built-in settings (Bug 404913). But note that to use options changed by user the built-in settings provider needs to be set as non-shared.
Indexing
Preferences for header variants
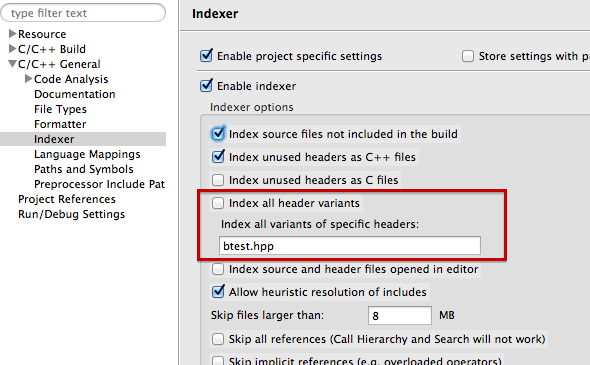
New indexer preferences:
- Index all header variants
- Index all header variants of specific headers
These new preferences give the user more control over how the indexer handle variants of headers. By default, the indexer will index all variants of headers which do not have include guards or #pragma once. In certain cases, this strategy is not sufficient. To resolve this, the indexer can be configured to index all variants of headers, at the possible expense of indexing time. If the problematic headers are known, a comma separated list of headers can be specified and only those will be indexed for all variants.
Debug
Threads displayed by creation order in the Debug view
For a multi-threaded program, the different threads are now shown in the order they were created during execution. Not only is that order more intuitive, it allows for the selection in the Debug view to be more stable. This enhancement was completed through Bug 412547.
Support for multi-process debugging in Memory views
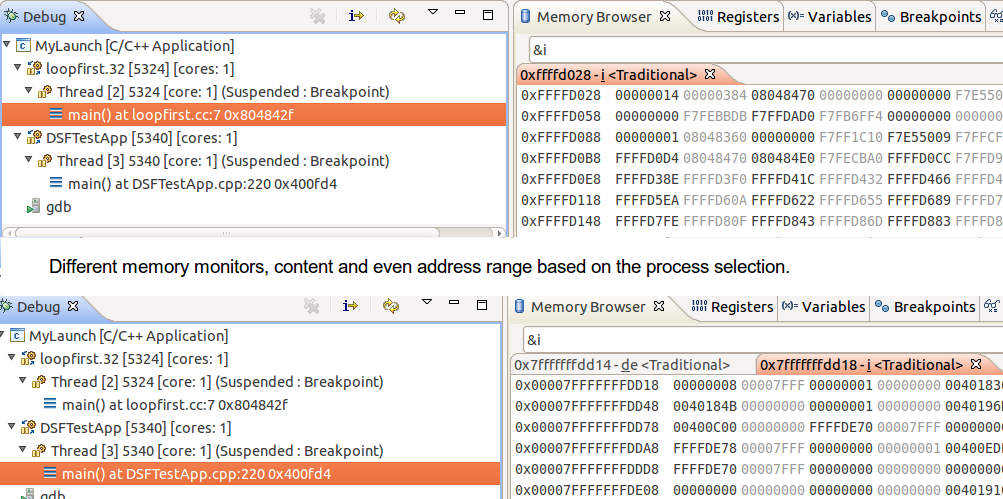
The Memory view and Memory Browser view now support multi-process debugging. Beyond properly refreshing their content based on the currently selected process, the user can now define different memory addresses to look at for each process being debugged. This work was a contribution from Alvaro Sanchez-Leon through Bug 250323.
Enhanced support for multi-process debugging in Registers view
The Registers view now supports debugging processes with a different set of registers. For example, the registers of the selected process will properly be displayed when debugging both a 32-bit process and a 64-bit process. This work was a contribution from Alvaro Sanchez-Leon through Bug 418176.
Register view is now stack-frame-specific
The Registers view will now update each time a different stack-frame is selected. The view will show the content of the registers as they were for the selected frame, when the method call was done which caused the creation of the next stack-frame. This work was a contribution from Alvaro Sanchez-Leon through Bug 323552.
Basic support of Multicore Visualizer in all-stop mode
The Multicore Visualizer now displays properly in all-stop mode, with all its features available when the program is suspended, while still updating thread creation/termination when the program is running. This enhancement was completed through Bug 409965
Variable substitution for GDB command file path
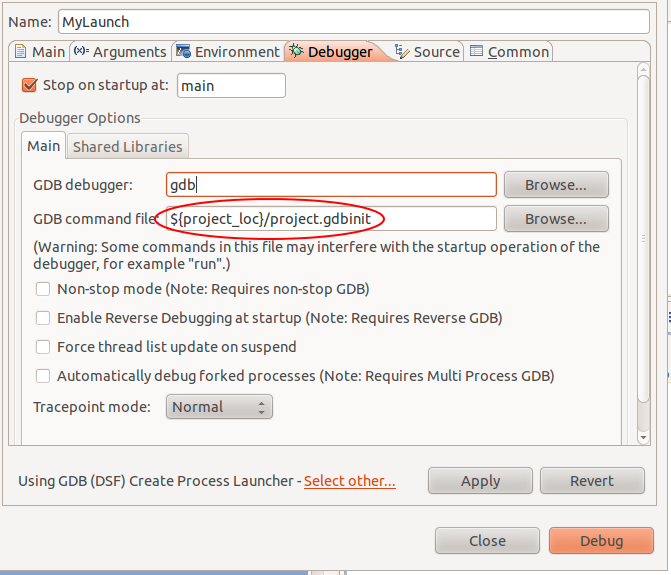
It is now possible to use eclipse variables within the specified path of the GDB command file. This allows to have project-specific GDB command files. For example ${project_loc}/project.gdbinit. This feature was completed through Bug 413373
Project-less debugging is now supported on the Windows platform
Project-less debugging now works as expected on Windows. This enhancement was completed through Bug 344470
Detection of target disconnection
When doing remote debugging, if the connection to the target is lost, the debug session will be cleanly terminated. Previously, some situations could lead to a debug session that lost its connection but remained active using the host machine instead; these cases have been fixed. This enhancement was completed through Bug 422586
Qt Support (preview)
Work continues on CDT's support for Qt. For CDT 8.3, this includes the following. Note that we still consider this a preview release until CDT 8.4 where we'll clean up usability issues around setting up CDT to work with Qt and hopefully some better qmake and QML support.
New Project Wizard
We have revamped the new project wizard for Qt. It's available under Makefile projects as Qt5 Hello World project. It uses a top level Makefile to drive the calls to qmake and make on the qmake generated QtMakefile. The project doesn't do a shadow build but an in project build to keep things simple for now.
Syntax Highlighting
Syntax highlighting is provided for Qt macros inluding 'signal', 'slot'.
Indexing and Search
The CDT indexer now captures several Qt "extensions" to C++. This include slots and signals as well as properties and related functions. This enables searching for references to slots and signals in connect calls.
Content Assist
In connect calls, content assist is provided to show valid slot and signal functions for the objects you are connecting. Content assist templates are also provided for QObject class declarations and Q_PROPERTY declarations.
Codan Semantic Checkers
Semantic checkers are provided to ensure that the parameters to the connect call are valid.
Bugs Fixed in this Release
See bugzilla report Bugs Fixed in CDT 8.3

