Notice: This Wiki is now read only and edits are no longer possible. Please see: https://gitlab.eclipse.org/eclipsefdn/helpdesk/-/wikis/Wiki-shutdown-plan for the plan.
CDT/User/NewIn80
Contents
- 1 Editor
- 2 Code Analysis (Codan)
- 3 Refactoring
- 4 Build
- 5 Debug
- 5.1 Project-less debugging
- 5.2 Support for full pretty-printing of complex structures
- 5.3 Support for pending breakpoints
- 5.4 Showing cores in Debug view labels
- 5.5 Showing cores and owner in attach prompter
- 5.6 Pin & Clone
- 5.7 Multi-process Debugging
- 5.8 C/C++ Remote Application launch
- 5.9 New set of preferences
- 5.10 Non-stop attach does not interrupt the process
- 5.11 Extra node for debugged process no longer shown
- 6 API Changes and Migration to CDT 8.0
- 7 Bugs Fixed in this Release
Editor
Override Markers
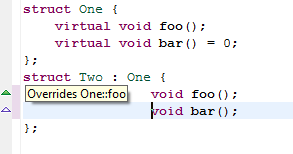
In C++ files, method declarations and definitions are annotated on the vertical bar using three types of symbols:
- Override (green triangle) indicating that a virtual method in one of base classes is overridden,
- Implement (empty blue triangle) indicating that a pure virtual (abstract) method in one of base classes is overridden,
- Shadow (dark blue triangle) indicating that a method in one of base classes with the same paremeter set is shadowed.
As in JDT, the annotations have the action which allows to go to the declaration in base.
In case of multiple inheritance, the messages also contain the name of direct base class of the overriding method's class if the overrided method's class is further up the inheritance hierarchy.
Contrary to JDT, several messages are sometimes generated on one marker (e.g. when the same method is overridden through several base classes).
Selection Expansion
The C++ editor now allows to expand the selection to enclosing, next and previous nodes of the AST, as well as restore the hierarchy.
The behaviour is strictly analogous to JDT and the actions are located in "Edit -> Expand Selection To" menu.
Camel Case Completion
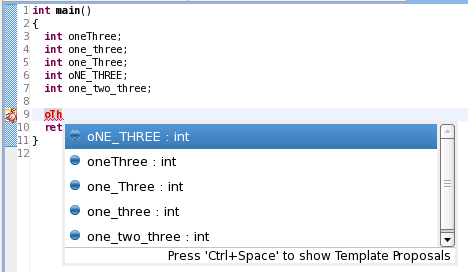
The C/C++ now supports camel case completion similar to the one of the JDT. The following additional features are available:
- underscore notation (I):
FBmatchesFooBaras well asFOO_BARorFoo_Bar - underscore notation (II): you can also type the underscore in the text, in which case matches are explicitly required to contain the underscore.
F_BmatchesFOO_BAR, but notFooBar. - you don't need to specify all segments: It is OK to omit segments (not the first, however):
OThmatchesOneTwoThree, even though no characters forTwoare specified. - a segment in the matching name can consist of only upper case letters:
IOTmatchesIONETWO.
Configurable Name Style
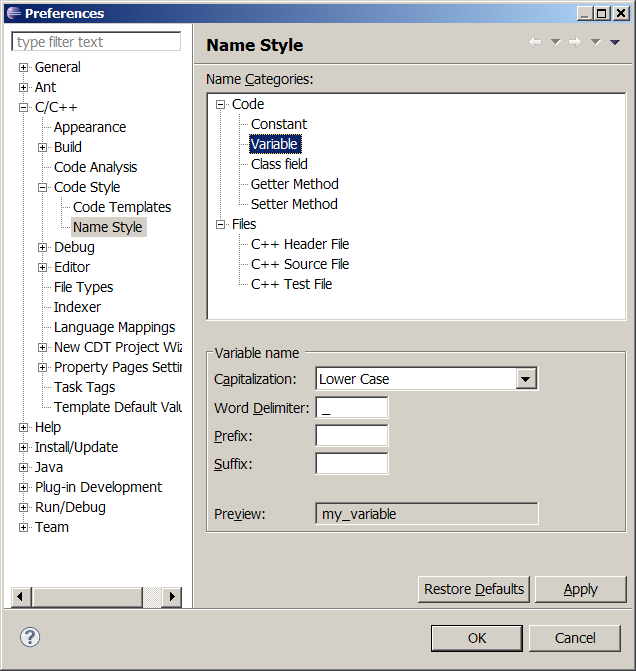
User-configurable name styles for constants, variables, class fields, getters and setters, and for header, source and test files.
New Code Formatting Options
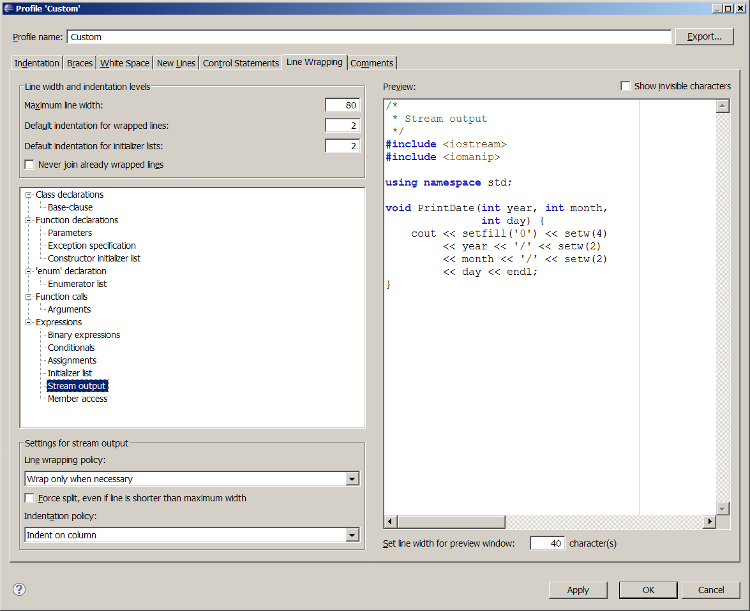
New options for formatting of constructor initializer lists, stream output expressions, and inline comments. Numerous improvements to the code formatter.
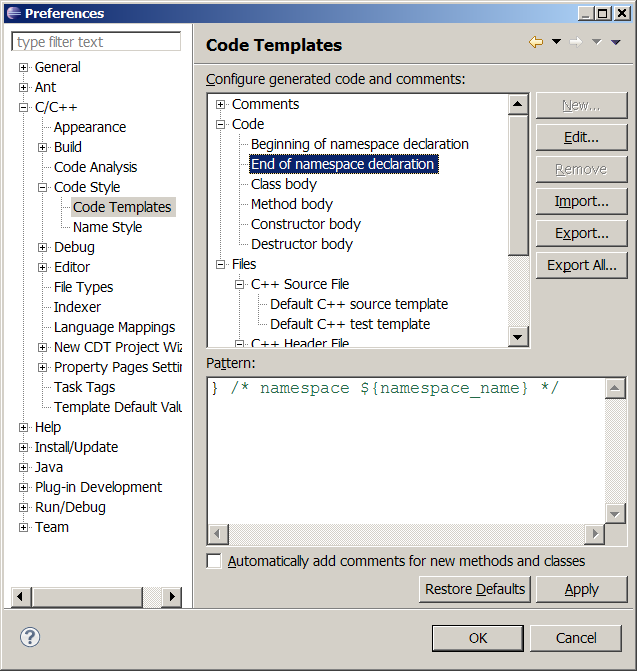
New Code Templates
New code templates for namespace and class declarations and for C++ test files.
Code Analysis (Codan)
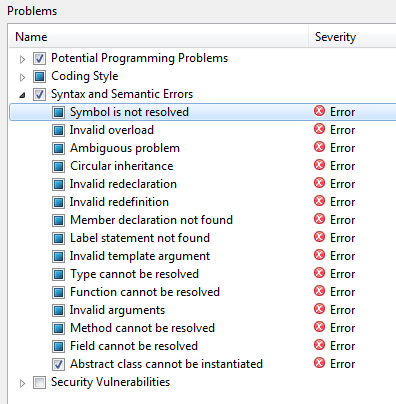
Error Markers for Unresolved Symbols
Codan now has a checker which generates Problems on instances of ProblemBindings in AST, generated by the Parser. This allows to reveal many errors while typing.
Quick fixes are provided for a subset of problems. As for now, the available fixes are:
- Name resolution problem:
- Create Local Variable
- Create Field
- Create Parameter
New checkers added
- Bug 343429: Checker to pinpoint unused static functions in a file
- Bug 329497: Checker for "no break at end of case"
- Bug 326269: Checker for instantiation of an abstract class
- Bug 322119: Suspicious semicolon (i.e. ";" after "if")
- Bug 321471: Return statement style (i.e. return (0))
- Bug 320187: Checker for detecting format string vulnerabilities
- Bug 314576: Checker for variable self-assignment, (i.e. a=a)
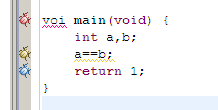
New icons for editor for codan problems
Bug 329430. Codan now uses different icons for problems, so people do not confuse codan errors and parser errors
Run code analysis on folders
Bug 325669: Now you can run code analysis not only on selected project, but on folder or file (using context menu)
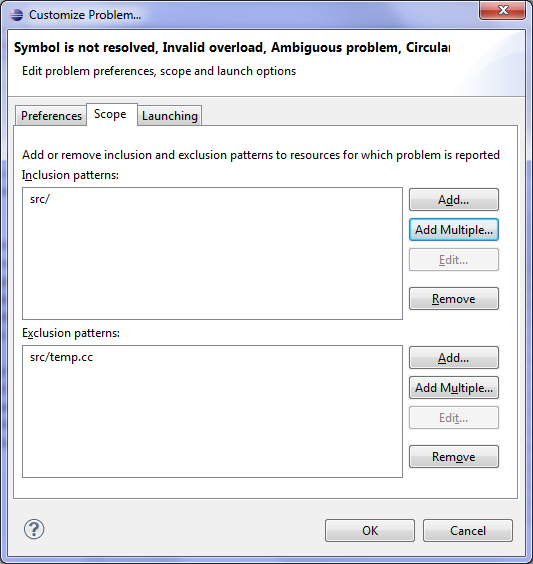
Scope filters
You can customize each checkers or multiple checkers to exclude or include specific files.
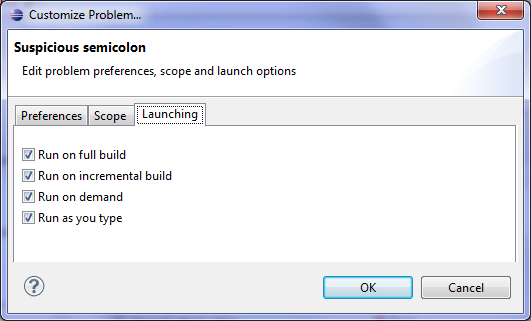
Also you can include or exclude checker to run in specific mode, i.e. some checker would run on with build, and some only when you edit code.
Mass editing of problems
You can edit multiple problems at once (for example enable group of problems, or change severity, or scope)
Refactoring
Rename Refactoring as Quick Fix
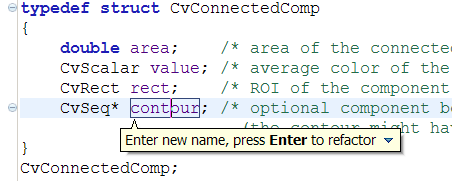
Rename in workspace option in quick fix.
Lightweight Rename Refactoring
JDT-style rename refactoring.
Toggle Function Definition
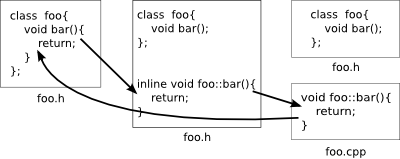
Toggle Function Definition moves a function definition inside an C/C++ source editor from one position to another and preserves correctness.
Build
Console
- The "C-Build console" is now named "CDT Build Console"
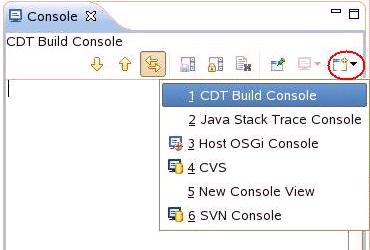
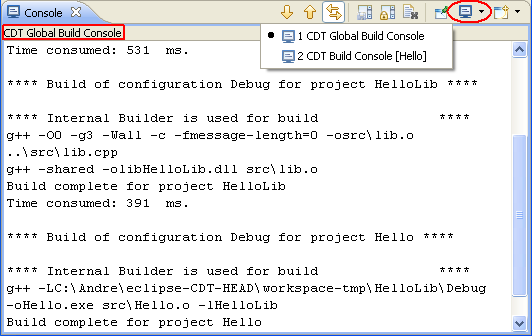
- It is now possible to open the CDT Build Console before performing a build. See bug 320765. Note that operations on the console will require the user to first select a project. The below screenshot shows the new access to the CDT Build Console.
- "CDT Global Build Console" got introduced. This console combines output from all referenced projects being built in one view. See bug 309113.
- Differentiate color highlighting in build output for error, warning and info problem markers. See bug 307211.
Error Parsers
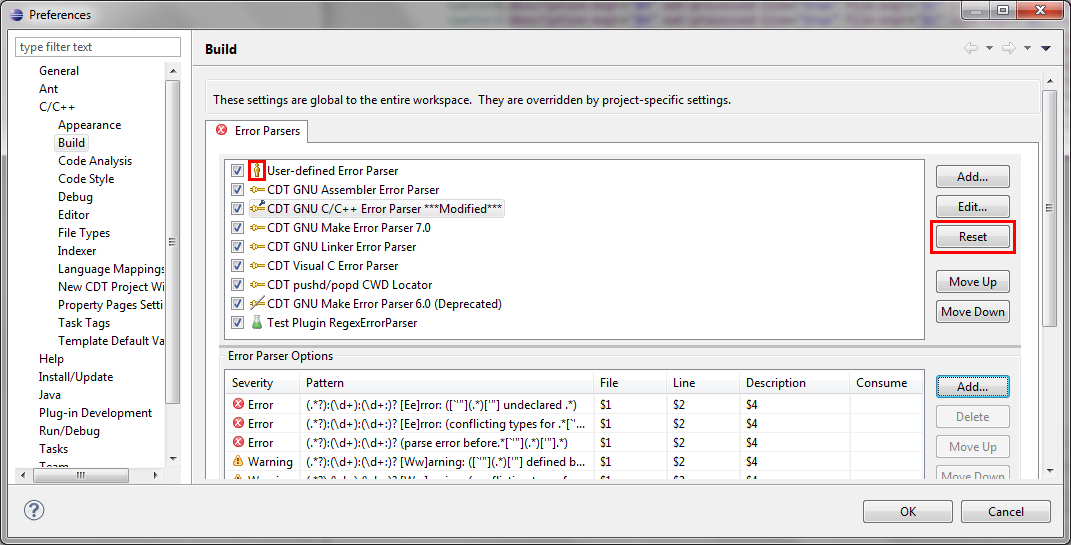
- Added ability to reset individual error parsers in preferences. Also icons to indicate status, such as "user", "extension" icons and "wrench" overlay for customized parsers, bug 302720.
Make Targets
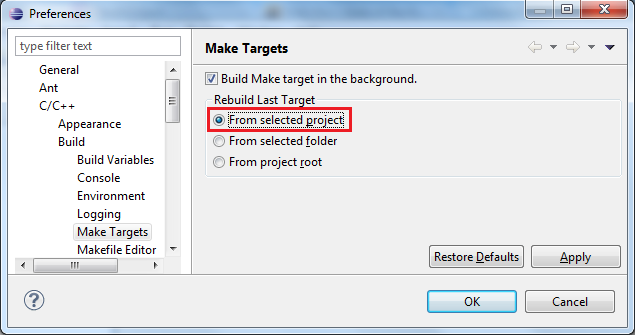
- Rebuild Last Target F9 got a new option in preferences - to rebuild last target from a whole project including subfolders. This preference is the default now. bug 333113.
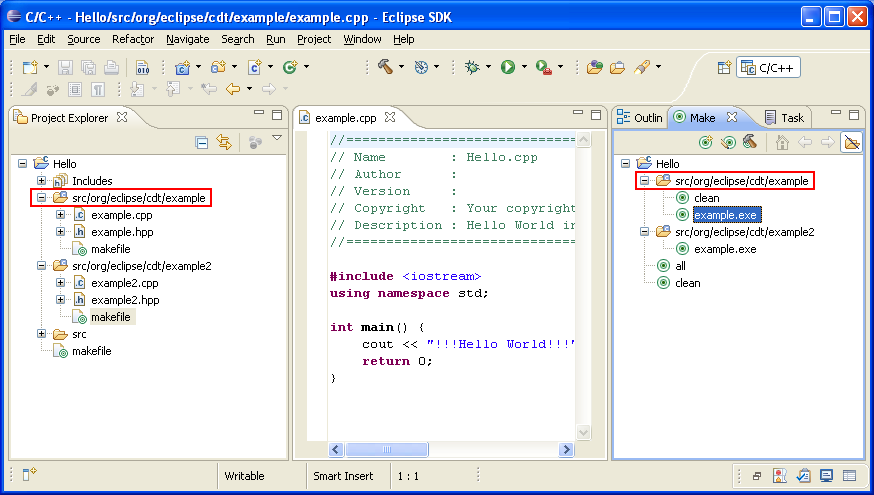
- Source folders are shown in collapsed form now in Make Targets View, similarly as they are shown in Project Explorer. bug 339015.
Managed Build
- By default, there will be a space added after "-o" option and its value in compiler/linker commands in the generated makefiles. That stands for other applicable options as well. See bug 232373.
g++ -o "Hello.exe" ./src/Hello.o
Scanner Discovery
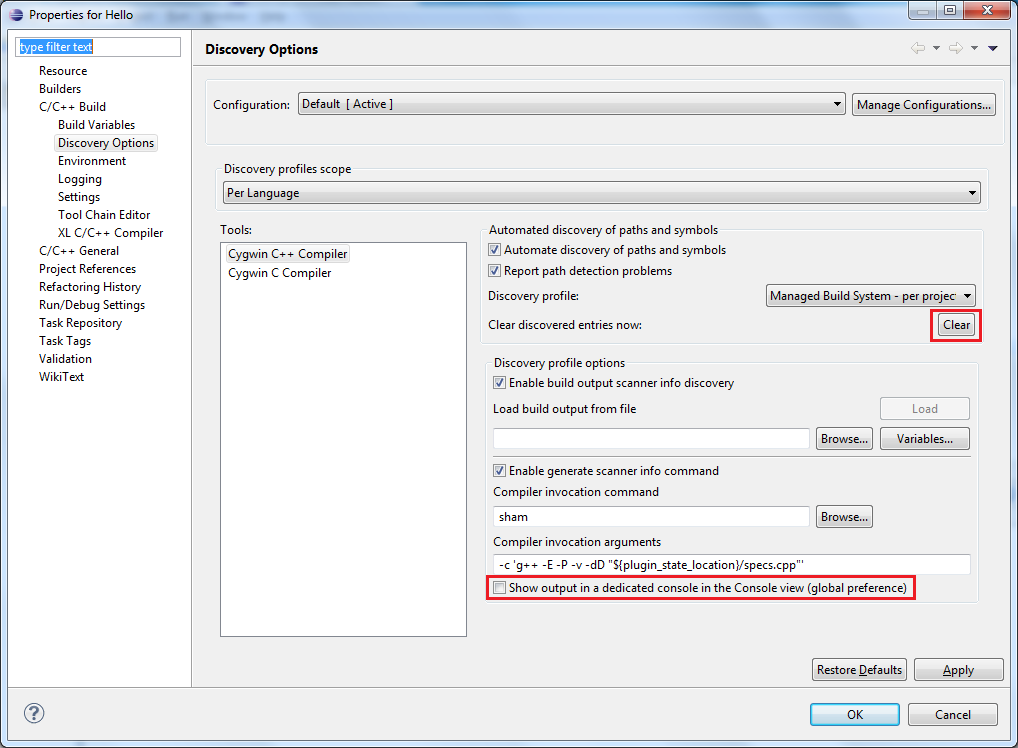
- It is possible now to clear old built-in include paths and symbols left after compiler upgrade in Paths&Symbols in project properties. The "Clean" button was introduced on "Scanner Discovery" page. See bug 206372.
- You can now inspect the output of command to collect built-in compiler include paths and symbols, bug 342069.
Configurable Refresh
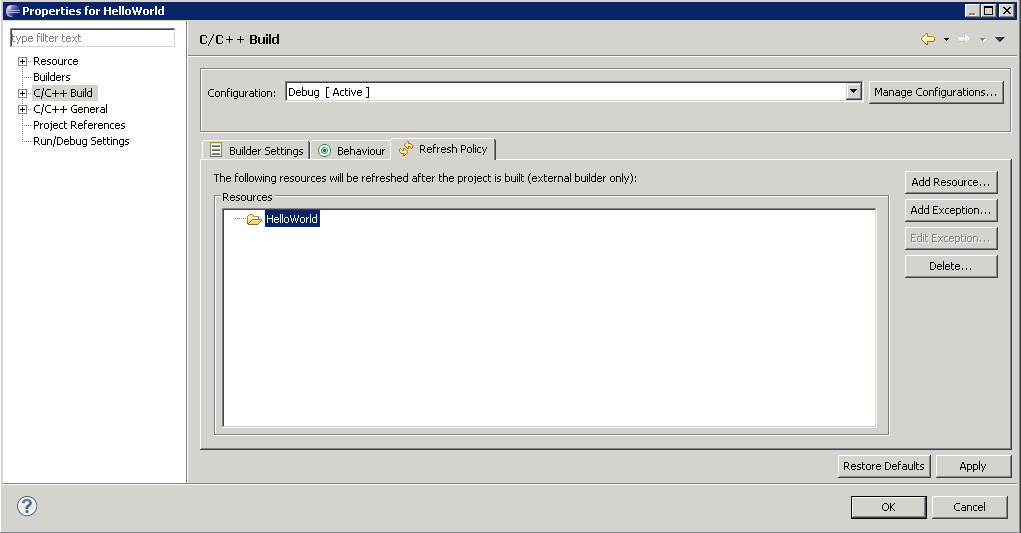
- Automatic refresh that happens after a build can now be configured and folders in the project can be refreshed selectively. See bug 133881 278257
Debug
Project-less debugging
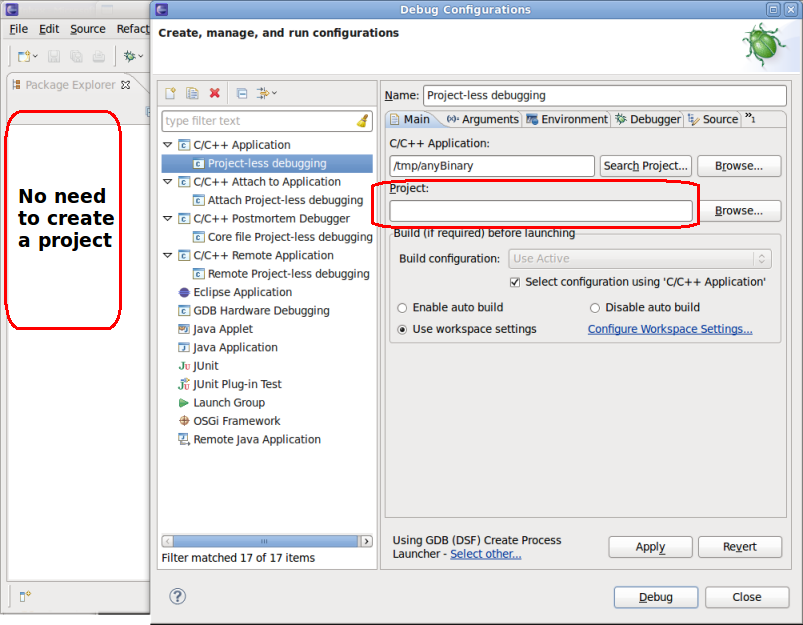
CDT can now be used to debug any binary, without needing to specify or even create a project in Eclipse. This is supported for all types of debugging (local, remote, attach, and post-mortem sessions).
Furthermore, for an attach session (local or remote), there is even no need to specify the binary; for a local attach, GDB can find the binary automatically, while for a remote attach, CDT will prompt for it when it needs it.
This feature was completed through Bug 343861
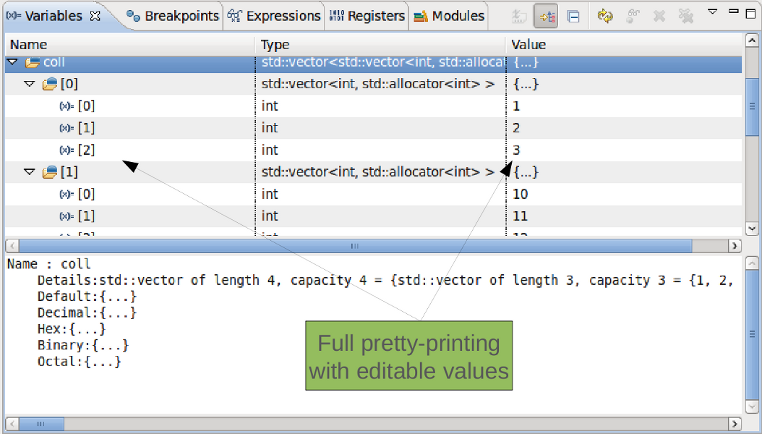
Support for full pretty-printing of complex structures
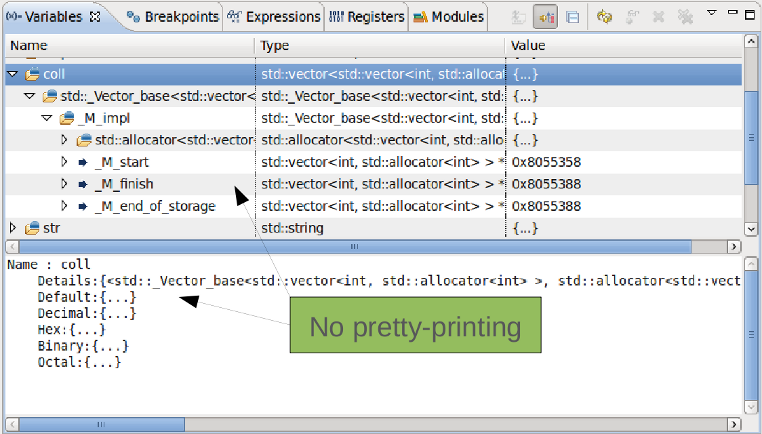
With the proper setup of GDB, DSF-GDB will now print complex structures such as Maps, Lists and Vectors, in a user-friendly fashion, within the Variables and Expressions views, as well as the advanced Debug hover of the Editor. See below on how to setup GDB for this feature to work.
Without pretty-printing:
With pretty-printing:
This feature has been contributed by Jens Elmenthaler to CDT 8.0 through Bug 302121
Configuring GDB for pretty-printing:
- You will need to have python installed on your machine
- If you want to pretty-print STL structures, you will need the Python pretty-printers for STL. Check-out the latest Python libstdc++ printers to a place on your machine. (Note that you can create your own pretty-printers for any complex-structure). In a local directory, do:
svn co svn://gcc.gnu.org/svn/gcc/trunk/libstdc++-v3/python
- You will need to create a gdbinit file to tell GDB where the pretty-printers are. Create a gdbinit file with the following 6 lines. The path needs to match where the python module above was checked-out. So if checked out to: /home/marc/gdb_printers/, the path would be as written in the example:
 python
import sys
sys.path.insert(0, '/home/marc/gdb_printers/python')
from libstdcxx.v6.printers import register_libstdcxx_printers
register_libstdcxx_printers (None)
end
- You will need GDB 7.0 or later. GDB 7.2 is recommended because it has some bug fixes for the pretty-printing.
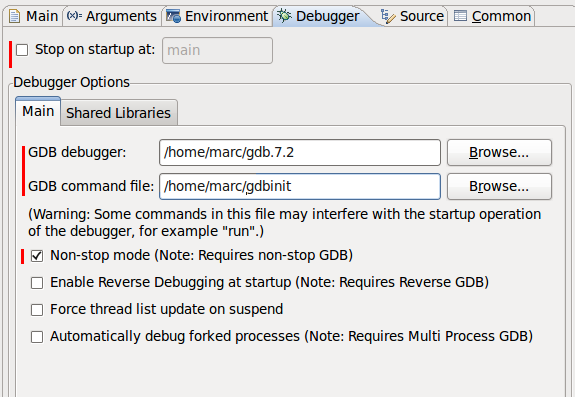
- In your DSF-GDB launch, make sure you use the right GDB and the right gdbinit file
Support for pending breakpoints
When a breakpoint is set in a dynamically-linked library that was not loaded yet, the breakpoint will now work, once the library is loaded. See bug 248595. This feature is currently only supported when using GDB 6.8 or later.
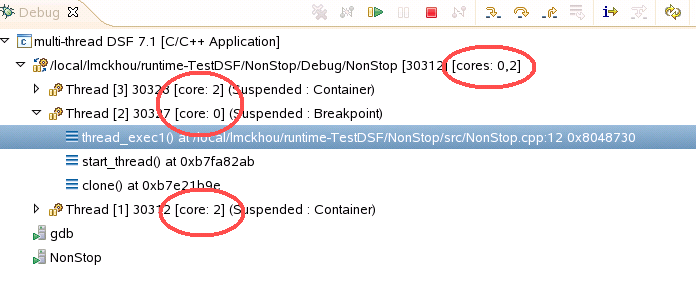
Showing cores in Debug view labels
By using the enhancements of GDB 7.1, DSF-GDB now shows the core on which each thread runs as an extra part of the Debug View label. The list of all cores on which a process is located is also added as a label. The below image shows the new feature.
This feature has been implemented for CDT 8.0 through Bug 318230. The feature will be enabled automatically as long as GDB 7.1 or greater is used.
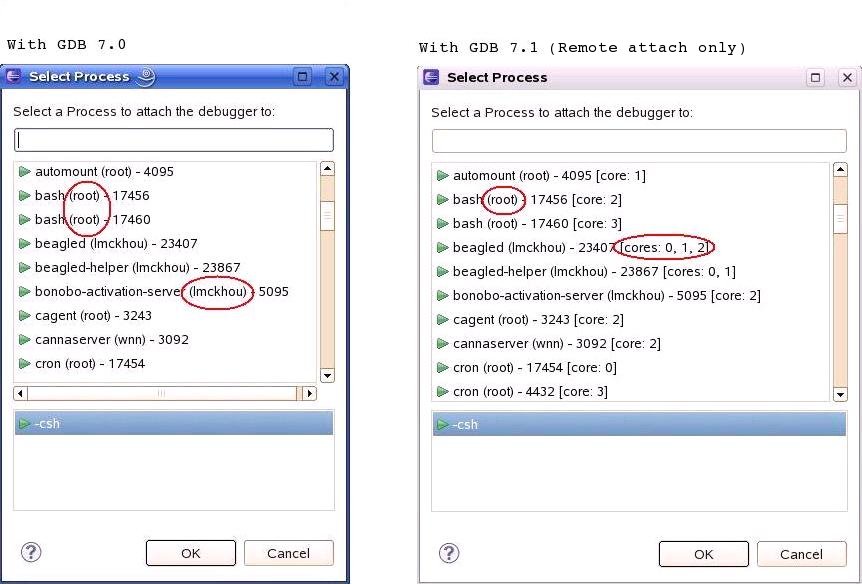
Showing cores and owner in attach prompter
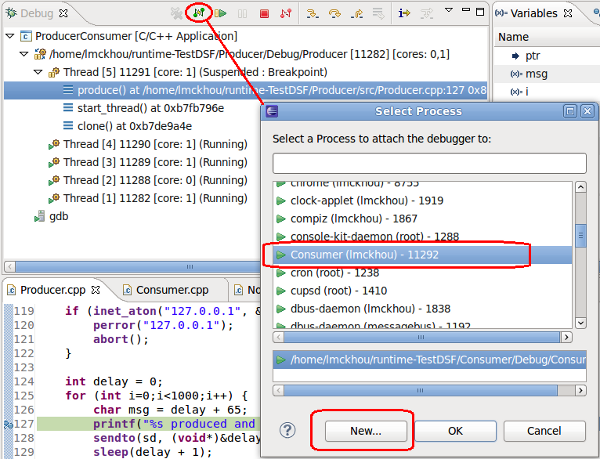
DSF-GDB now shows the owner of a process as an extra part of the process prompt for an attach session. The owner id will be shown starting with GDB 7.0. For a Remote attach session (using gdbserver --multi), the cores on which a process is located will also be shown. Showing the cores starts with GDB 7.1. The below image shows the new feature.
This feature has been implemented for CDT 8.0 through Bug 318230 comment 21. The feature will be enabled automatically as long as the proper version of GDB is used.
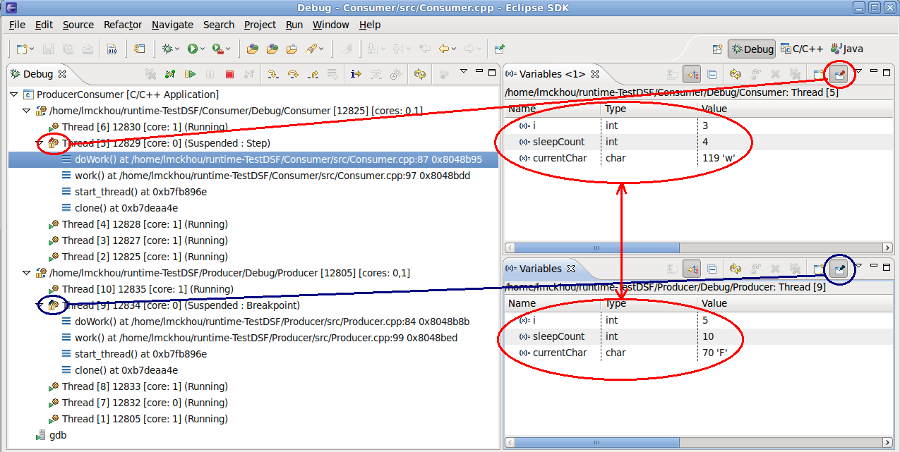
Pin & Clone
Variables, Expressions, Registers, Disassembly, and Memory Browser now supports opening multiple instances, and pin the view input to the selected debug context(s) in the Debug view. This can be used, for example, to easily compare the data of different threads.
This feature has been implemented for CDT 8.0 through Bug 327263, Bug 331781, and Bug 334566.
Multi-process Debugging
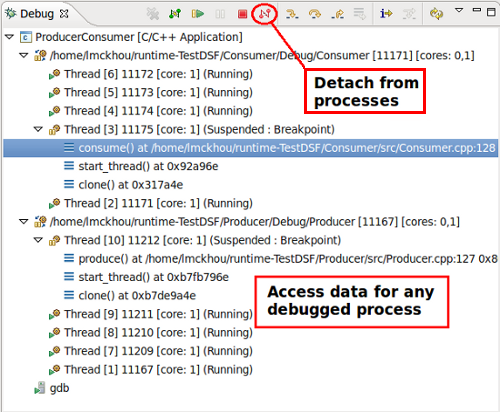
CDT now supports debugging multiple processes in a single debug session. It allows to attach/detach and start/stop processes repeatedly and easily.
Requirements:
- GDB 7.2 or greater
- Currently, only Non-Stop debugging sessions support multiple processes.
- Note that this feature was developed and tested on Linux systems, and may not work on Windows.
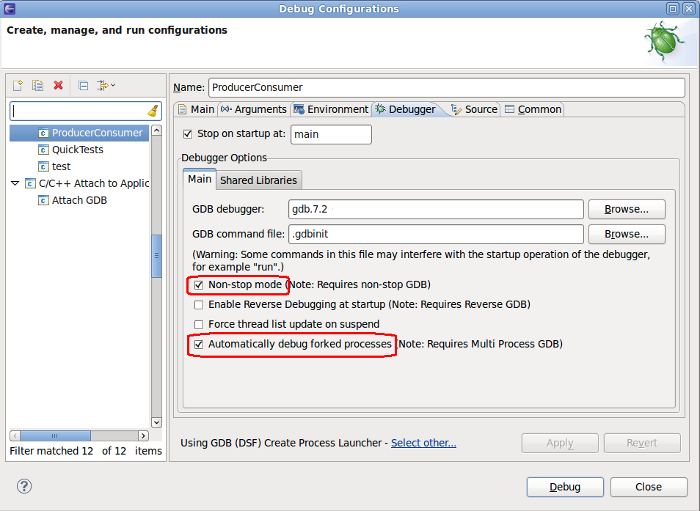
To use multi-process debugging, simply launch an application as you normally would, locally or remotely, using gdbserver, and make sure to select Non-stop mode in the Debugger tab. Then, use the Debug View's "Connect" button to trigger a dialog with allows you to either attach to a running process, or to create a new process using the "New..." button. Currently, the "New..." button is only supported for Local debug sessions.
You will then have the newly selected process added to your debug session, where you can control it and examine it. You can use the "Disconnect" button to remove processes from your debug session, or you can use the "Connect" button to add new ones.
An option to automatically attach to a forked process is also available. This means that whenever any process you are currently debugging forks a new process, that new process will be added to your debug session.
C/C++ Remote Application launch
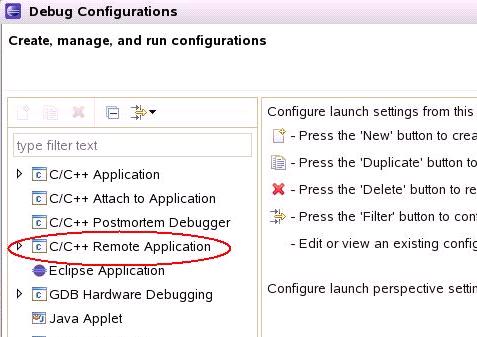
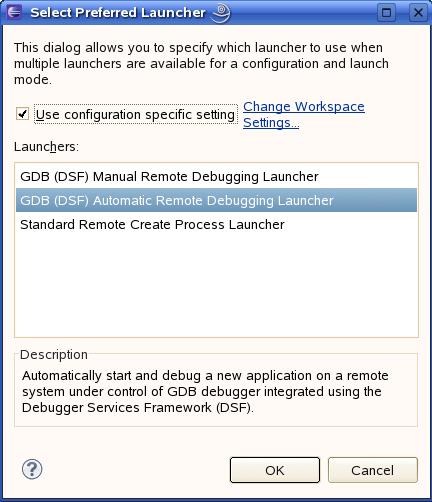
The optional "C/C++ Remote Application" launch configuration type has been made permanent for CDT.
The "GDB (DSF) Remote System Process" launch delegate has been renamed to "GDB (DSF) Manual Remote Debugging" and has been moved from "C/C++ Application" to "C/C++ Remote Application". As was the case for CDT 7.0, the optional RSE Remote Launch delegate of org.eclipse.cdt.launch.remote, is still part of "C/C++ Remote Application".
This optional remote launch now provides a new DSF-GDB-based launch delegate called "GDB (DSF) Automatic Remote Debugging". This launch is very similar to the existing "GDB (DSF) Manual Remote Debugging" delegate, except that the automatic one will automatically download the application to the remote target and start gdbserver with the application.
By default, the user will be shown the "GDB (DSF) Manual Remote Debugging". However, if the optional feature of Remote Launch is installed, the default will automatically become the more feature-rich "GDB (DSF) Automatic Remote Debugging".
Finally, the run-mode RSE Remote Launch delegate no longer shows the Debugger or Source tabs, since they were not relevant, in run-mode.
New set of preferences
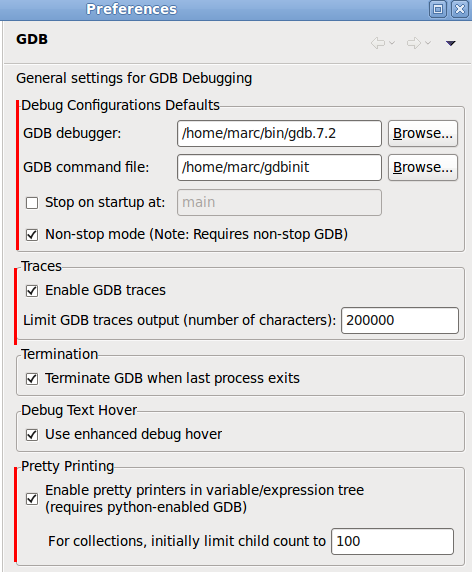
A set of new preferences have been added to Preferences->C/C++->Debug->GDB to allow users to have a better debugging experience.
Note: after a new workspace is created, this debug preferences page will only be visible once the first debug session is started.
These new preference are:
- Default GDB path and initialization file: default path for the location of GDB as well as for the GDB initialization file.
- Default behavior for Stop on startup: default behavior to stop the execution on startup, and on what symbol.
- Default Non-stop mode: default behavior to automatically enable non-stop mode or not. Non-stop mode allows to control the execution of threads and processes independently.
- Default limit for GDB Traces: limits the amount of traces printed on the gdb traces console
- Default enabling of pretty-printing: assuming a pretty-printing enabled GDB, automatically enabled pretty-printing in CDT
- Default child limit for pretty-printing: default to control the amount of children automatically shown by a pretty-printer
The values of most of these preferences will be used to populate the corresponding entries of the Debugger tab, whenever a new launch is created.
This feature has been implemented for CDT 8.0 as as part of Bug 120162, Bug 347245 and Bug 335895.
Non-stop attach does not interrupt the process
As part of Bug 333284 attaching to a process in non-stop mode will no longer interrupt the process.
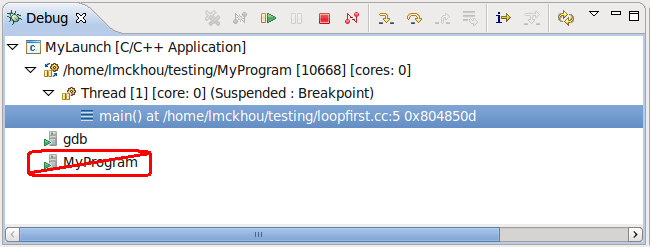
Extra node for debugged process no longer shown
The debugged process extra launch node has been removed from the Debug view. This node was felt to waste space, especially when dealing with multi-process debugging as we would have needed many of them. The Debug view already shows the debugged process as a container of threads, right below the launch node.
API Changes and Migration to CDT 8.0
The changes affecting compatibility are listed here. Keep in mind that this list likely does not list all the issues, only some of them.
General
- Deprecated class org.eclipse.core.runtime.PluginVersionIdentifier has been changed to use org.osgi.framework.Version. See bug 318581
- Affected packages: org.eclipse.cdt.managedbuilder.*.
- Use default check box was removed from the New C++ Class dialog. Few protected members related to that check box were removed from org.eclipse.cdt.ui.wizards.NewClassCreationWizardPage class.
DSF-GDB
- The interface org.eclipse.cdt.dsf.mi.service.command.output.MIListThreadGroupsInfo.IThreadGroupInfo has four new methods. See bug 318230 comment 21
- String getUser()
- String getType()
- String getCores()
- String getExecutable()
- The interface org.eclipse.cdt.dsf.gdb.service.command.IGDBControl has a new method: List<String> getFeatures(). See bug 322658
- The interface org.eclipse.cdt.dsf.gdb.service.command.IGDBControl no longer has the three methods: start(...), restart(...) and canRestart(...). Those methods are moved to org.eclipse.cdt.dsf.gdb.service.IGDBProcesses and have a new signature.
- org.eclipse.cdt.dsf.gdb.service.command.GDBControl and org.eclipse.cdt.dsf.gdb.service.command.GDBControl_7_0 no longer implement the five methods: start(...), restart(...), canRestart(...), startOrRestart(...), useContinueCommand(...) which are now implemented in org.eclipse.cdt.dsf.gdb.service.command.GDBProcesses and org.eclipse.cdt.dsf.gdb.service.command.GDBProcesses_7_0
- All the constructors of class org.eclipse.cdt.dsf.mi.service.command.commands.MIBreakInsert now take an extra parameter at the end of the parameter list: boolean allowPending. When this parameter is set to true, -break-insert will be used with the -f option, which asks GDB to make the breakpoint pending if the installation fails. This flag can only be enabled for GDB >= 6.8. See bug 248595
- The interface org.eclipse.cdt.dsf.debug.service.IProcesses.IMIProcesses has a new method: IMIContainerDMContext createContainerContextFromGroupId(...). See bug 317500
- The file of constants org.eclipse.cdt.dsf.gdb.internal.ui.preferences.IGdbDebugPreferenceConstants has been removed. It was deprecated and had already been replaced by org.eclipse.cdt.dsf.gdb.IGdbDebugPreferenceConstants
- The interface org.eclipse.cdt.dsf.mi.service.IMIRunControl has a new method: IRunMode getRunMode(). See bug 334463
- FinalLaunchSequence has dramatically changed.
- GdbLaunch#addInferiorProcess() is removed.
- GDBControl.InferiorInputOutputInitStep is removed.
- GDBControl_7_0.InferiorInputOutputInitStep is removed.
- The interface IMIRunControl has the new method isTargetAcceptingCommands() as part of Bug 339047
- IGDBControl, GDBControl and GDBControl_7_0, no longer have the three methods: initInferiorInputOutput(), createInferiorProcess() and getInferiorProcess() as part of Bug 237308
- MIInferiorProcess's constructors have changed, and many of its public methods are removed (getState(), getPid(), setPid(), etc) as part of Bug 237308
- CommandFactory#createMIInferiorTTYSet() has changed signature as part of Bug 237308
- The constructor to MIInferiorTTYSet has changed signature as part of Bug 237308
- IGDBProcesses gets the new method attachDebuggerToProcess() as part of Bug 237306
- GdbInferiorProcess no longer exists. Its base class, MIInferiorProcess should be used directly.
- GDBBackend.doInitialize(), GDBControl.doInitialize() and GDBControl_7_0.doInitialize() are now private. Having them as public was a bug that would break versioning of the service. See Bug 341465
- GDBControlDMContext no longer implements IBreakpointsTargetDMContext or IDisassemblyDMContext. Although not an API breaking change it has significant impacts. Mostly that code such as
(IBreakpointsTargetDMContext)fCommandControl.getContext() // Will fail with an Invalid Cast exception
(IDisassemblyDMContext)fCommandControl.getContext() // Will fail with an Invalid Cast exception
will now fail because the command control context is no longer an IBreakpointsTargetDMContext/IDisassemblyDMContext. Instead, MIContainerDMC now implements IBreakpointsTargetDMContext/IDisassemblyDMContext. This change was necessary to fully support multi-process and was done in bug 335324 and bug 344298.
Codan
- The class org.eclipse.cdt.codan.core.cxx.model.CxxModelsCache is no longer a singleton.

