Notice: This Wiki is now read only and edits are no longer possible. Please see: https://gitlab.eclipse.org/eclipsefdn/helpdesk/-/wikis/Wiki-shutdown-plan for the plan.
CDT/Archive/20112012EricssonInvolvement
This page describes Ericsson's involvement in the C/C++ Development Toolkit (CDT) as well as the GNU Debugger (GDB) for 2011 and 2012. Ericsson's involvement has multiple facets:
- New features are developed directly by Ericsson's employees
- New features are contributed by other companies with the help of committers working for Ericsson
- New features are implemented by companies sponsored by Ericsson
Below is a list of features implemented by Ericsson or with Ericsson's help or sponsorship in 2011-2012.
Contents
- 1 Multicore Visualizer View
- 2 Enhanced Expressions
- 3 OS Resources View
- 4 Breakpoint Filtering
- 5 Enhanced GDB console support
- 6 Breakpoint actions to control reverse debugging
- 7 Partitioning of large arrays
- 8 Advanced character encoding support
- 9 Timeout support for GDB commands in DSF/GDB
- 10 Multi-select Resume/Suspend operations
- 11 Show only suspended threads in Debug view
- 12 Default Postmortem file location
- 13 Dynamic Tracepoints
- 14 Support for Fast Tracepoints
- 15 Static Tracepoints
- 16 Disconnected Tracing
- 17 Offline trace visualization
- 18 Observer Mode
- 19 Show the actual variable type based on RTTI
- 20 Project-less debugging
- 21 Support for full pretty-printing of complex structures
- 22 Multi-process Debugging
- 23 Pin & Clone
- 24 Showing cores in Debug view labels
- 25 Showing cores and owner in attach prompter
- 26 C/C++ Remote Application launch
- 27 Reverse Debugging
- 28 Non-stop Debugging
- 29 Support for pending breakpoints
- 30 Multi-select attach dialog
Multicore Visualizer View
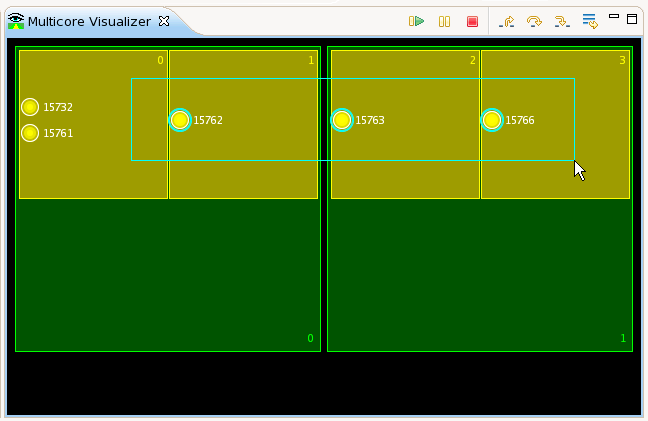
CDT now optionally includes a Multicore Visualizer View. This view displays a graphical representation of the state of the current application. It allows one to click- and drag-select groups of processes/threads, and apply debugging commands to them directly from the visualizer. Selections made in the Visualizer View are reflected automatically in the Debug View, and vice versa. The Multicore Visualizer View is designed to scale to large numbers of cpus and cores-per-cpu on both current and future multicore hardware.
The Multicore Visualizer View is meant to serve as a high-level visual overview of the current application, and can be used in tandem with the Debug View, which provides more in-depth detail.
The Multicore Visualizer View is just one example of a visualizer based on the underlying Visualizer Framework plugin. This provides a pluggable, extensible platform for developing visual development tools of this kind.
Note that the Multicore Visualizer will only work using a Linux target; it will not work debugging on a Windows or Mac target. This is a current limitation of GDB which does not provide information about cores, for those targets (at writing, GDB is at version 7.4).
The Multicore Visualizer is an optional feature of the CDT and must be installed manually. The feature is called "C/C++ Multicore Visualizer". Installing it will install both the Multicore Visualizer and the Visualizer Framework. If you only want to install the Visualizer Framework (to build your own visualizer), you can install that feature by itself; it is called "CDT Visualizer Framework". Once the features are installed, you can access the Multicore Visualizer (or any other visualizer) by opening the view called "Visualizer".
Enhanced Expressions
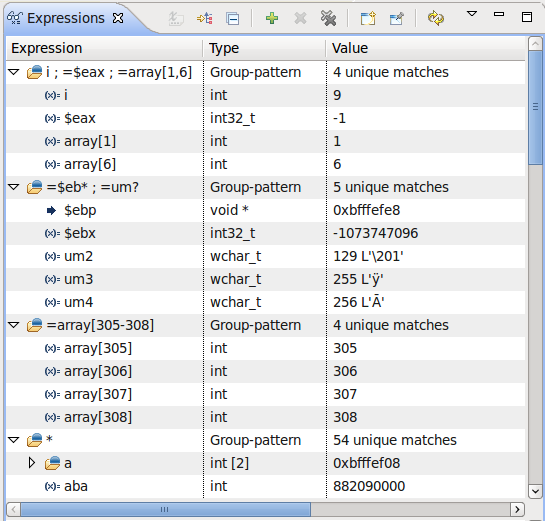
The Expressions view has been extended to allow the user to manually create enhanced-expressions. Enhanced-expressions define a set of expressions which can be easily described using glob-pattern matching. The user specifies an enhanced-expression by prefixing it with '='. For example:
- pattern-matched sorted groups of local variables, where the symbols * [] ? can be used e.g.,
=v?r     -- Will show local variables starting with a 'v' and ending with 'r' with a single character in between
=*       -- Will show all local variables of the selected stack frame in sorted order (the '=' is optional for this expression, i.e., '*')
=*x      -- Will show local variables ending with 'x'
- array ranges including glob-expressions
=array[30-40]        -- Will show array elements from 30 to 40
=array[1-5,20,30-31] -- Will show array elements from 1 to 5, 20 and 30 to 31
=array?[1-5]         -- Will show array elements from 1 to 5 for any array starting with 'array' followed by a single character
- pattern-matched sorted registers groups, where the symbols * [] ? can be used e.g.,
=$e?x     -- Will show all registers starting with 'e' and ending with 'x' with a single character in between
=$*       -- Will show all registers (the '=' is optional for this expression, i.e., '$*')
=$*x      -- Will show registers ending with 'x'
=$st[3-5] -- Will show registers $st3, $st4, $st5
- semi-colon-separated, individually sorted groups of expressions, e.g,
var1; var2 -- Will create a group containing both var1 and var2
$eax; var1 -- Will show a group containing register $eax and variable var1
var1; $e*  -- Will show a group containing variable var1 as well as all registers starting with 'e'
This feature allows to quickly define multiple expressions that interest the user. Because groups are created from these special expressions, they can be collapsed when uninteresting and re-expanded later, without having to be re-entered by the user.
Note that the comma (,) is not allowed as a group separator as it is used within valid expressions that use templates (e.g., ((((((class std::_Vector_base<int, std::allocator<int> >) v))._M_impl))._M_start)).
OS Resources View
Ericsson sponsored a joint CDT/GDB feature to provide the user with OS Resource information.
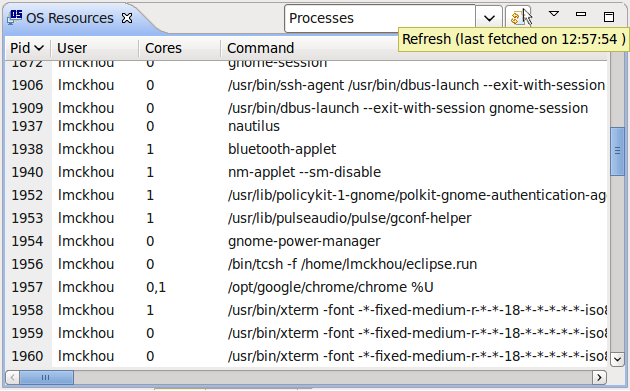
CDT has a new view called "OS Resources". This view will display different information about the resources of the operating system. For example, it can give a list of all processes running on the target. The view will display the information as provided by GDB.
As of writing, GDB supported the following information:
Processes             - Listing of all processes
Process groups        - Listing of all process groups
Threads               - Listing of all threads
File descriptors      - Listing of all file descriptors
Sockets               - Listing of all internet-domain sockets
Shared-memory regions - Listing of all shared-memory regions
Semaphores            - Listing of all semaphores
Message queues        - Listing of all message queues
Kernel modules        - Listing of all loaded kernel modules
Notes:
- For performance reasons, the view is not automatically refreshed. Press the Refresh button on the the view toolbar to fetch the latest information. Hovering over this Refresh button will display the time at which the information was last obtained.
- Columns can be re-sized.
- Columns can be removed or added using the view menu.
- Entries can be ordered by column by pressing on the column header.
- When doing debugging of a remote target, the information in the view pertains to the remote target.
This feature requires GDB 7.5 and higher. Furthermore, as of GDB 7.5, this feature only works for Linux.
Breakpoint Filtering
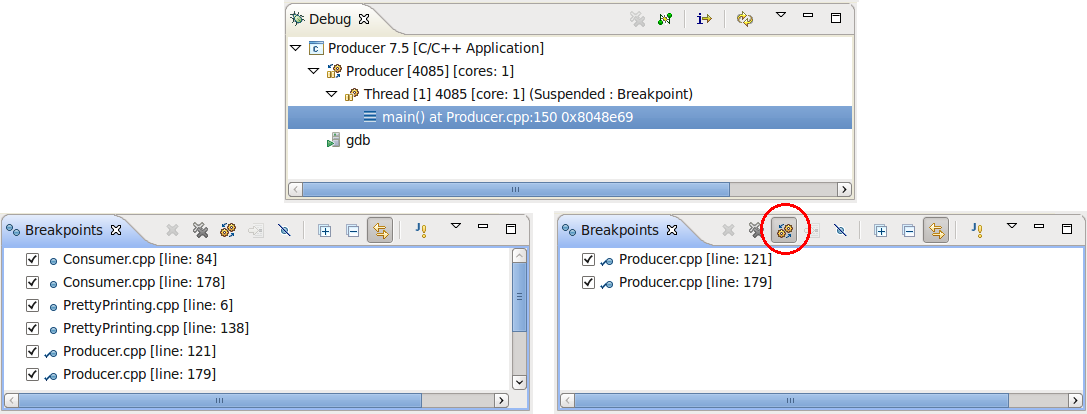
The CDT has enhanced the standard behavior of the "Show Breakpoints Supported by Selected Target" option of the Breakpoints view. Using this option with the CDT will now only show breakpoints that are actually applicable to the current debug session. Therefore, when debugging a C/C++ application, the user will not be bothered with the breakpoints set in the code of an another C/C++ application.
For backwards-compatibility, a preference is provided to revert this new behavior to the original one. The original behavior of this option is to have the Breakpoints view show all breakpoints that are of the same type as the current debug session. For example, if debugging Java, only Java breakpoints would be shown, and if debugging C/C++ only C/C++ breakpoints would be shown. This preference can be found under "C/C++ -> Debug -> GDB -> Use aggressive breakpoint filtering".
Improvements to GDB were also done by Ericsson to improve the performance of this feature.
Enhanced GDB console support
Ericsson is sponsoring a joint CDT/GDB feature synchronize the Eclipse GUI with the GDB state, when changes are caused by user commands.
GDB now reports any changes caused by the user, while CDT is being improved to update its views based on these GDB events. Updates are being added gradually and the final goal is to allow the user to perform any command from the GDB console, and have CDT stay synchronized with the changes.
Breakpoints, watchpoints and tracepoints
Breakpoints, watchpoints or tracepoints set from the GDB console are now shown in the Breakpoints view. All breakpoint related GDB commands are supported and synchronized with the UI. No support for catchpoints yet. This feature requires GDB 7.4 or higher.
Breakpoint actions to control reverse debugging
It's now possible to control the enabling, disabling and toggling of the reverse debugging mode, through breakpoint actions. The reverse debugging mode can be useful to debug, but has a significant performance cost when enabled. Using the new breakpoint action to enable the reverse debug mode, one can program a breakpoint to enable that mode in the vicinity of the suspected source code. That way, until that point is reached, no performance impacts are felt.
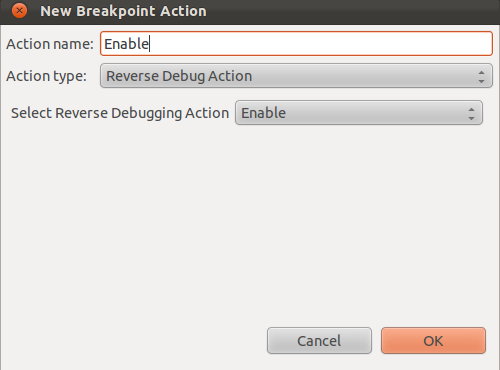
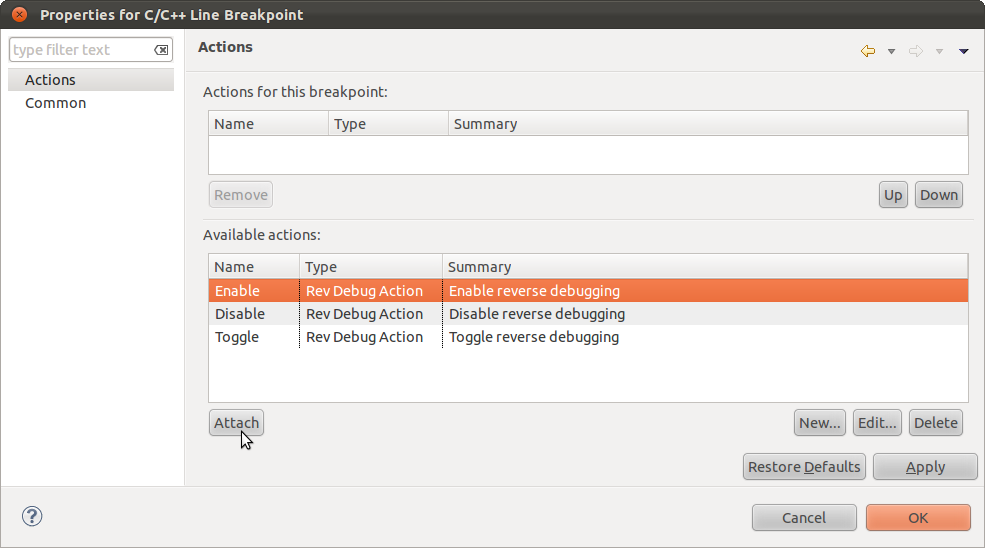
To use this feature, right-click on a breakpoint and select "Breakpoint Properties". Then in the left page, chose "Actions". Then click "New". In the new dialog, select the Action Type "Reverse Debug Action". Then chose if the action should enable, disable or toggle the reverse debug mode. Finally chose a name for the action. When done, click "Ok"
The newly created action will appear in the list of available actions, that can be attached to any breakpoint To attach it to the current breakpoint, click on "Attach".
Note: For the reverse debug breakpoint actions to work, reverse debugging must be available in the current debug session. For instance, it will not work if "non-stop" mode is active.
Partitioning of large arrays
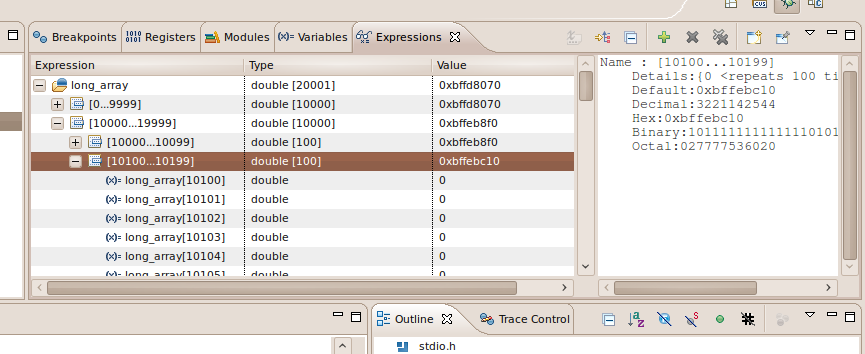
CDT now displays large arrays as collections of partitions.
Advanced character encoding support
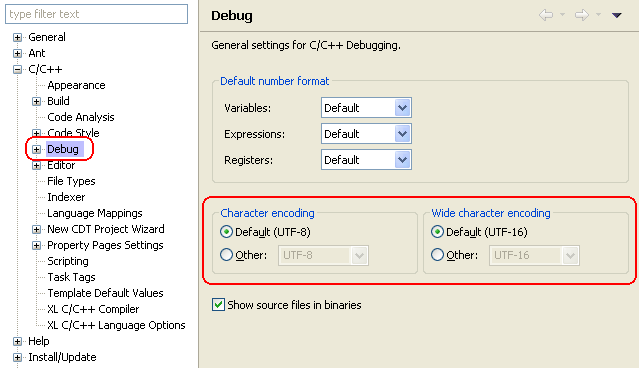
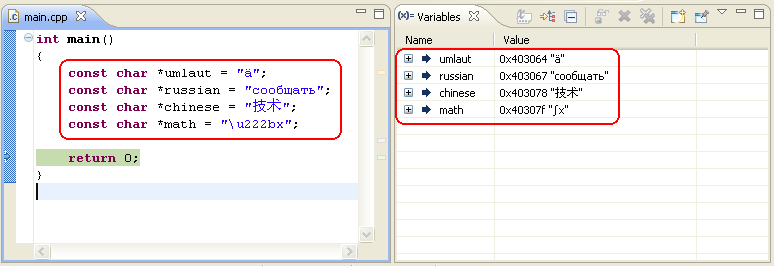
CDT now supports the handling of different character encodings for strings and wide character strings while debugging. This includes full support for Unicode encodings and many other popular encodings as well. You can select the character and wide character encoding within the Debug preferences.
CDT will then correctly display strings according to the selected encoding while debugging.
Note that this feature requires GDB version 7.0 or later.
Timeout support for GDB commands in DSF/GDB
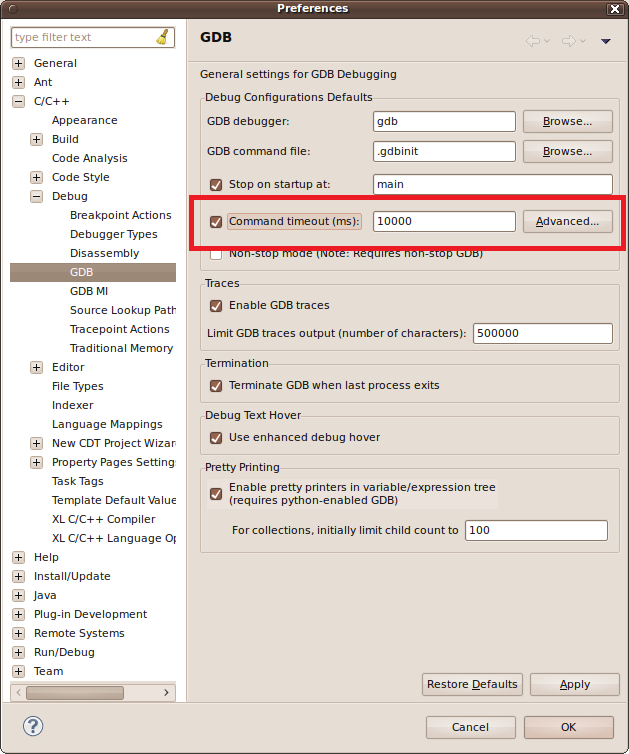
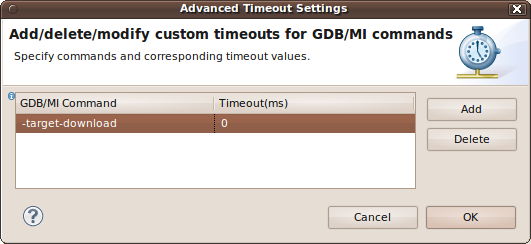
Timeouts for GDB commands are now supported in DSF/GDB. The feature is optional and disabled by default. The timeout values are configurable. When the feature is enabled, custom values can be assigned to some commands, all other commands use the default value. This feature was completed on April 17th, 2012 as part of Bug 361934.
Multi-select Resume/Suspend operations
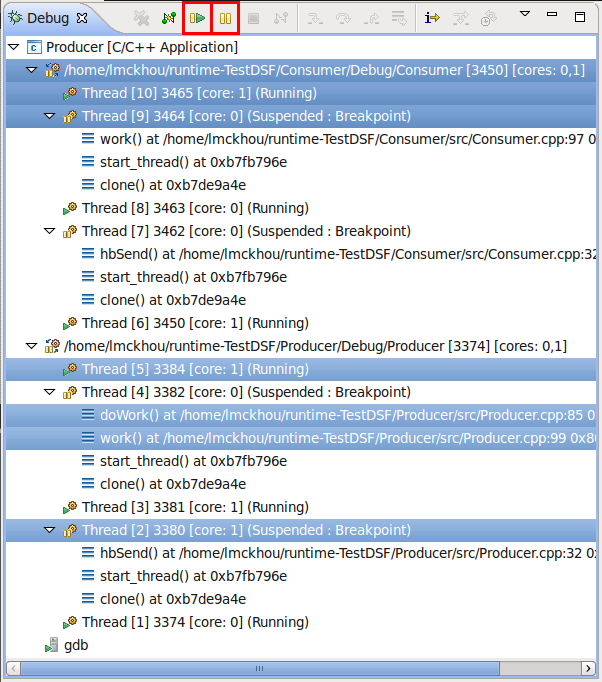
CDT now allows to perform a Resume or Suspend operation on multiple selections of the same debug session. Because such a concept only adds value in a Non-Stop debug session, it is only supported in such a session (see Non-Stop Debugging). The behavior of a multi-selection Resume/Suspend is as follows:
- Any selected stack frames implies a selection of their corresponding thread.
- If one or more threads are selected (not processes) and the resume/suspend operation is triggered, each selected thread on which the operation is currently valid will be resumed/suspended.
- If one or more processes are selected (not threads) and the resume/suspend operation is triggered, each selected process will be resumed/suspended. Resuming/suspending a process implies resuming/suspending each one of its threads on which the operation is currently valid.
- If both thread(s) and process(es) are selected, and the resume/suspend operation is triggered, each selected process will be resumed/suspended, and each selected thread which is not part of any selected process will be resumed/suspended. The idea is that if a process is being resumed/suspended, each of its threads will be automatically resumed/suspended, and therefore, should not be resumed/suspended a second time because it is also selected.
As hinted above, CDT takes a permissive approach to multi-select resume/suspend. This means that if a multi-selection includes both stopped and running threads, a resume operation is still allowed, and only the suspended threads will be resumed; similarly, on such a multi-selection, a suspend operation is allowed, and only the running threads will be suspended.
Example
In the above screenshot if the user were to press the Resume button with the current multi-selection the following would happen:
- The Consumer process node is selected, therefore the entire process will be resumed. This means that the suspended threads 7 and 9 will be resumed, while threads 6, 8 and 10 will be ignored, as they are already running.
- Note that the fact that threads 9 and 10 are selected is ignored, as those threads are part of the selected Consumer process, which will be resumed.
- Stack frames doWork() and work() are selected and belong to thread 4, which becomes implicitly selected in their place. Thread 4 will therefore be resumed.
- Thread 2 is selected and suspended, and will be resumed.
- Thread 5 is selected but running, so it will be ignored.
Show only suspended threads in Debug view
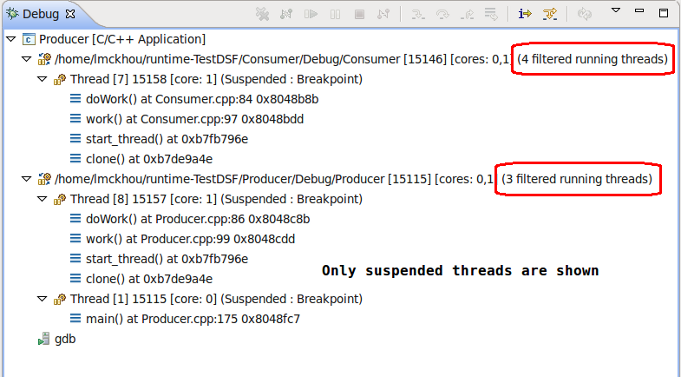
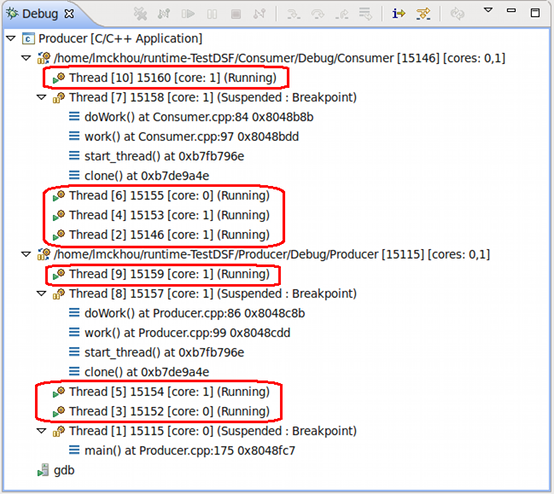
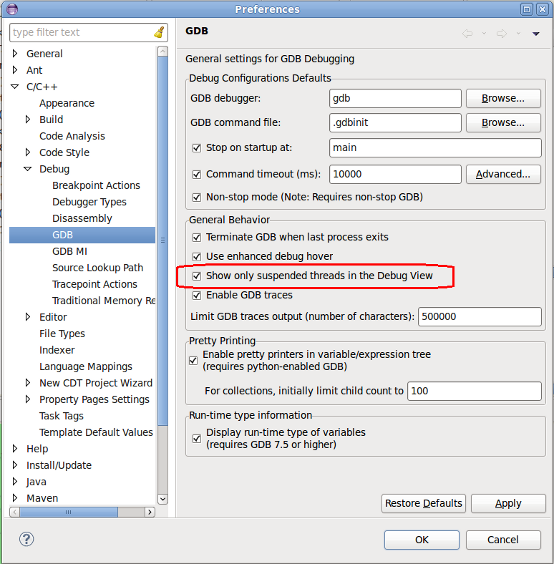
CDT now has an global preference that allows to only show the suspended threads within the Debug view. When dealing with a large number of threads, a user is typically interested by the threads that are being inspected (suspended ones) and does not care about the running ones. Using this preference, all running threads will not be shown in the Debug view. Note that when a thread is stepping it will remain visible, although it is technically running. The process element of the Debug view will show how many threads are currently being filtered from view.
The below example shows the exact same debugging session. The first screenshot only shows suspended threads, while the second shows all threads.
Below shows how to access the preference, which is disabled by default.
Default Postmortem file location
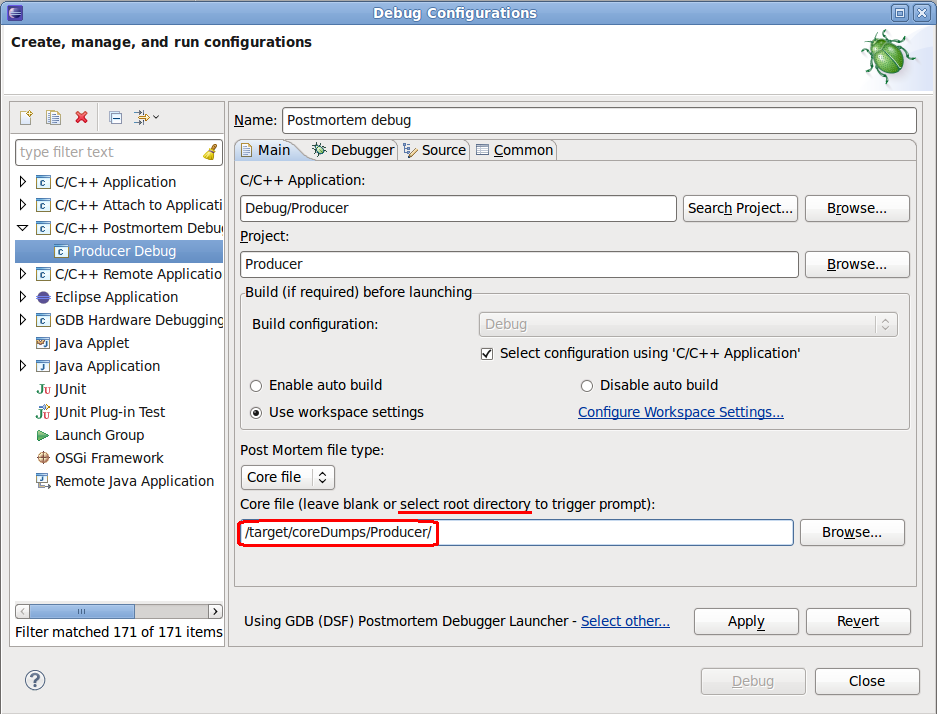
CDT now allows the user to specify a default directory for the location of core files for a postmortem launch when the prompt is triggered. Since a postmortem launch can easily be re-used for different core files of the same binary, this feature helps reduce the amount of navigation needed to select a core file. Note that specifying the actual core file is still supported, as well as leaving the entire field blank, which will also trigger the prompt, but use the default directory for its starting location.
Note that this 'core file' field supports the use of variables such as ${workspace_loc}.
This feature applies to both core files and trace files.
Dynamic Tracepoints
Ericsson sponsored a joint CDT/GDB feature to provide dynamic tracing capabilities.
In some applications, it is not feasible for the debugger to interrupt the program's execution long enough for the developer to learn anything helpful about its behavior. If the program's correctness depends on its real-time behavior, delays introduced by a debugger might cause the program to change its behavior drastically, or perhaps fail, even when the code itself is correct. It is useful to be able to observe the program's behavior without interrupting it.
Using C/C++ Tracepoints, you can specify locations in the program, called tracepoints, and arbitrary expressions to evaluate when those tracepoints are reached. Later, you can examine the values those expressions had when the program hit the tracepoints. Because tracepoints record these values without interacting with the user, it can be done quickly and unobtrusively, hopefully not disturbing the program's behavior.
Creating Tracepoints
Tracepoints are handled as a type of breakpoint. There are two differences to note:
- When a tracepoint is created in a debug session, it is not actually planted in the binary code until the user explicitly starts the tracing experiment. This means that creating/modifying/deleting tracepoints does not affect the program until tracing is actually started.
- Simply creating a Tracepoint has very limited value as it won't collect any information by default. It is important to add Actions to the Tracepoint to tell it what to do. This will be detailed below.
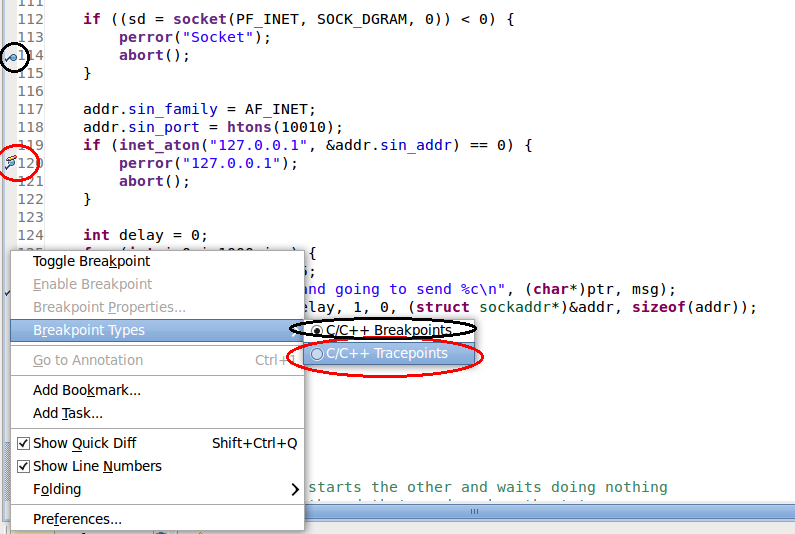
Once this is done, double-clicking on the Editor or the Disassembly view margin will set Tracepoints instead of Breakpoints.
Note that Tracepoints and Breakpoints can co-exist in the same workspace, and even debug session.
Adding actions to a Tracepoint
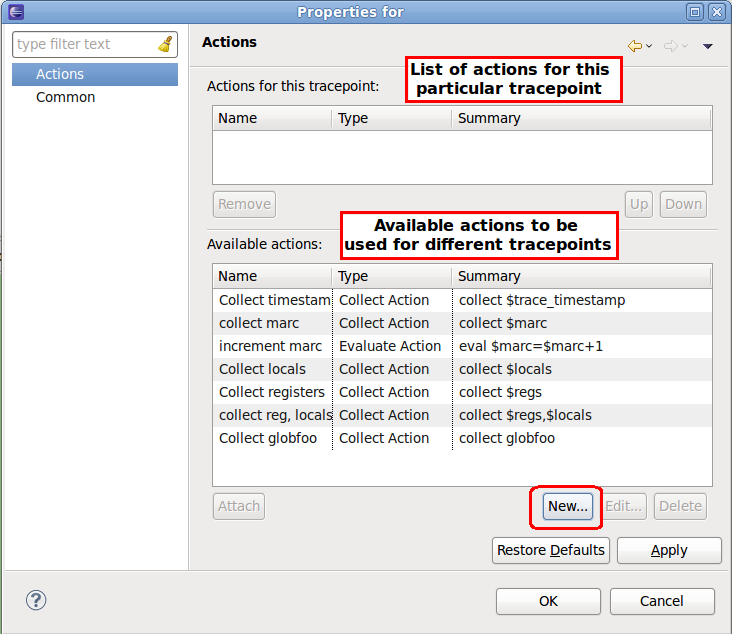
Once you have created one or more Tracepoint, they need to be told what to do. Access the Tracepoint properties (actually called "Breakpoint Properties..."). You can do this by right-clicking on the editor margin or through the Breakpoints view.
Tracepoint properties currently contain two pages:
- Actions. Used to tell the Tracepoint what to do, such as collecting data.
- Common. To modify other Tracepoint attributes such as the condition, enablement or passcount.
In the Actions page, you will need to define a set of actions that can be re-used for different Tracepoints. This is mirrored on the handling of CDT Breakpoint Actions.
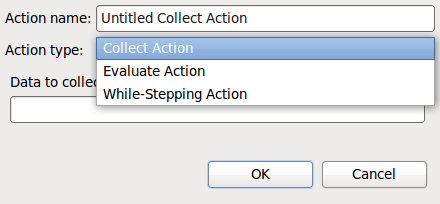
There are three types of Tracepoints actions supported by GDB:
- Collect. This action will tell the tracepoint to collect data.
- Evaluate. This allows to manipulate trace state variables.
- While-stepping. This allows to perform a set of sub-actions more then once, as GDB steps the program after hitting the tracepoint.
The TraceControl view
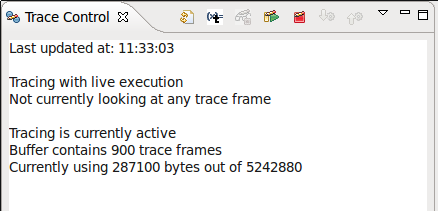
The TraceControl view is contributed by CDT and allows you to control the tracing of your application. It provides different buttons to:
- Start/Stop tracing
- Refresh the view. As trace information can change rapidly, the view does not always show the latest information. Pressing the Refresh button will fetch the latest data
- Start/Stop Visualizing data
- Deal with TraceState variables
Tracing
Once all tracepoints are properly created, press the "Start Tracing" button in the TraceControl view to start tracing your application. Have the application resume execution. As tracepoints are silently hit, data is being collected and the size of the content of the trace buffer can be seen to increase in the TraceControl view.
Until GDB 7.4, once a trace experiment is started, changes to tracepoints would not affect the ongoing experiment. However, starting with GDB 7.4, tracepoints can be enabled and disabled at any time after a trace experiment has been started, and will immediately take effect within the ongoing experiment. Note: Although GDB 7.4 seems to allow a tracepoint to be created during a trace experiment and will add it to the ongoing experiment, this behavior seems to have some issues. One of which is that deleting a tracepoint during an experiment will not remove that tracepoint from the ongoing experiment. Until this is fixed in GDB, it is recommended that the user stick to enable/disable operations during a tracing experiment.
Once you feel you have collected enough trace data, press the "Stop Tracing" button in the TraceControl view. The trace data can then be examine directly in your current debug session, or can be saved to a trace file for post-mortem examination, in a manner reminiscent of corefiles.
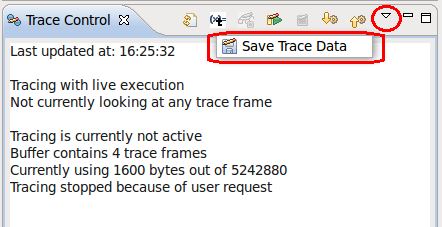
To optionally save the trace data to a file, use the TraceControl view-menu and select "Save Trace Data"
Examining the data
Once you have stopped your tracing experiment, you can examine the collected data. This can be done in two ways:
- Directly in the debug session used to collect the data. This will put GDB in a mode where it reads the collected data instead of the data of the current running program. This mode will keep your application running.
- Post-mortem from a saved trace file, using a new debug session.
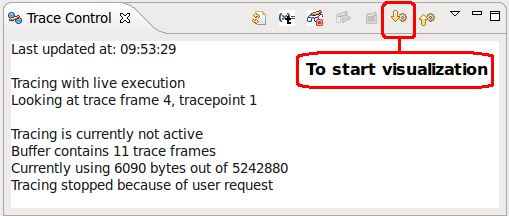
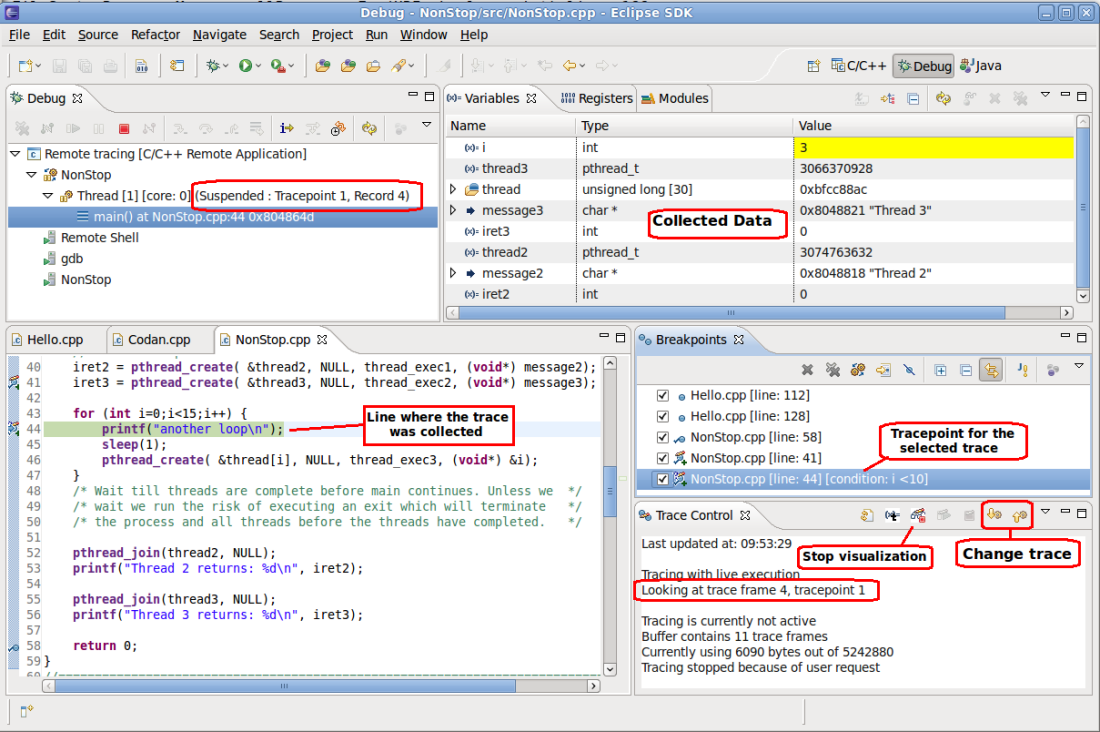
To immediately start looking at collected data, one can simply press the trace selection button (the one pointing down) and it will select the first trace record. Then, using the up/down trace selection buttons, one can navigate the trace records.
The standard debug views (expressions, variables, registers) can be used to display the data that was collected. Note that if a particular variable or expression was not collected, it will show as empty or with an error in the view; this is fine.
Support for Fast Tracepoints
Ericsson sponsored a joint CDT/GDB feature to provide fast dynamic tracepoints.
CDT and GDB now allow the user of fast tracepoints. Fast tracepoints use an instruction jump instead of a trap for efficiency. Fast tracepoint need a minimum of space to be inserted in the program and therefore, may fail to be set at certain locations. For fast tracepoints to work, a special library called the in-process agent (IPA), must be loaded in the inferior process. This library is built and distributed as an integral part of gdbserver. Please see the GDB documentation for more details.
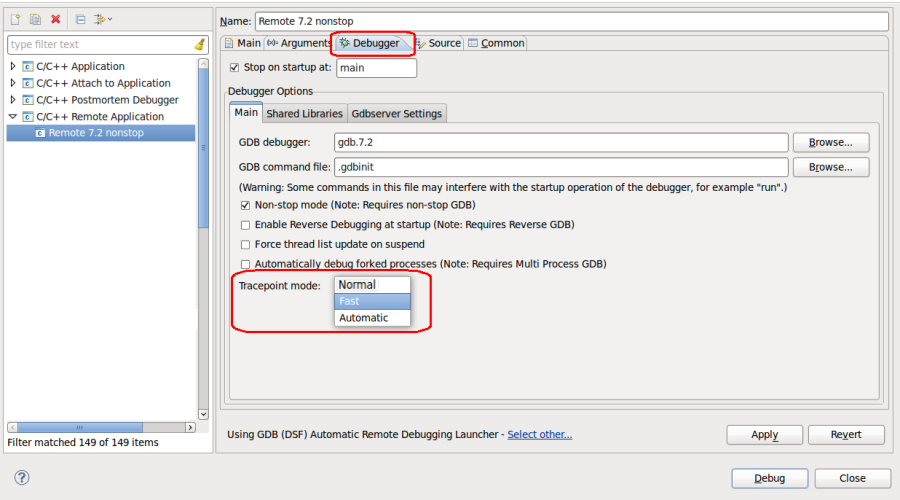
The user can select between three tracepoint modes in the launch:
- Fast: Only use fast tracepoints. No tracepoint will be planted if a fast tracepoint cannot be used.
- Normal: Only use normal tracepoints.
- Automatic: Attempt to use fast tracepoints. If a fast tracepoint cannot be used, automatically use a normal tracepoint.
Static Tracepoints
Ericsson sponsored a integration of LTTng static tracepoints in GDB.
Static tracepoints are calls in the user program into a tracing library. One such library is a port of the LTTng kernel tracer to userspace --- UST (LTTng userspace Tracer, http://lttng.org/ust). When debugging with GDBserver, GDB now supports combining the GDB tracepoint machinery with such libraries. For example: the user can use GDB to probe a static tracepoint marker (a call from the user program into the tracing library) with the new "strace" command (see "New commands" below). This creates a "static tracepoint" in the breakpoint list, that can be manipulated with the same feature set as fast and regular tracepoints. E.g., collect registers, local and global variables, collect trace state variables, and define tracepoint conditions.
Disconnected Tracing
Ericsson sponsored a GDB feature to allow disconnected tracing. This allows to detach GDB from the target while it is running a trace experiment, then reconnect later to see how the experiment is going.
Offline trace visualization
Ericsson sponsored a joint CDT/GDB feature to allow to save trace data to file and visualize it at a later time.
Observer Mode
Ericsson sponsored a GDB feature that allows to prevent GDB from modifying data on the target. You can now exercise direct control over the ways that GDB can affect your program. For instance, you can disallow the setting of breakpoints, so that the program can run continuously (assuming non-stop mode). In addition, the "observer" variable is available to switch all of the different controls; in observer mode, GDB cannot affect the target's behavior at all, which is useful for tasks like diagnosing live systems in the field.
Show the actual variable type based on RTTI
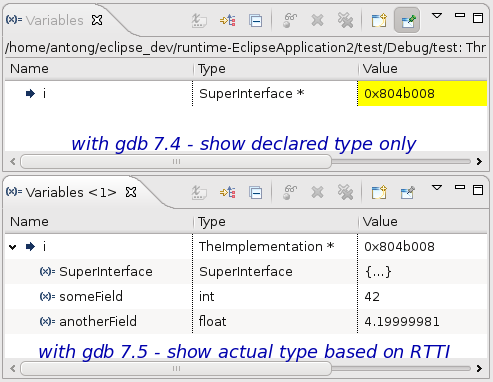
With GDB 7.5.1 or higher CDT could show the actual variable type (not the declared one) in Variables and Expressions Views. Consider the following example:
   struct SuperInterface {
       virtual ~SuperInterface() {}  // enable RTTI for Interface class
   };

   struct TheImplementation : public SuperInterface {
       TheImplementation(int _v1, float _v2)
           : someField(_v1), anotherField(_v2) {}

       int someField;
       float anotherField;
   };


   int main() {
       SuperInterface* i = new TheImplementation(42, 4.2);
       return 0;     // [Launch debug until here]
   }
Launch the debugging session and run until return statement:
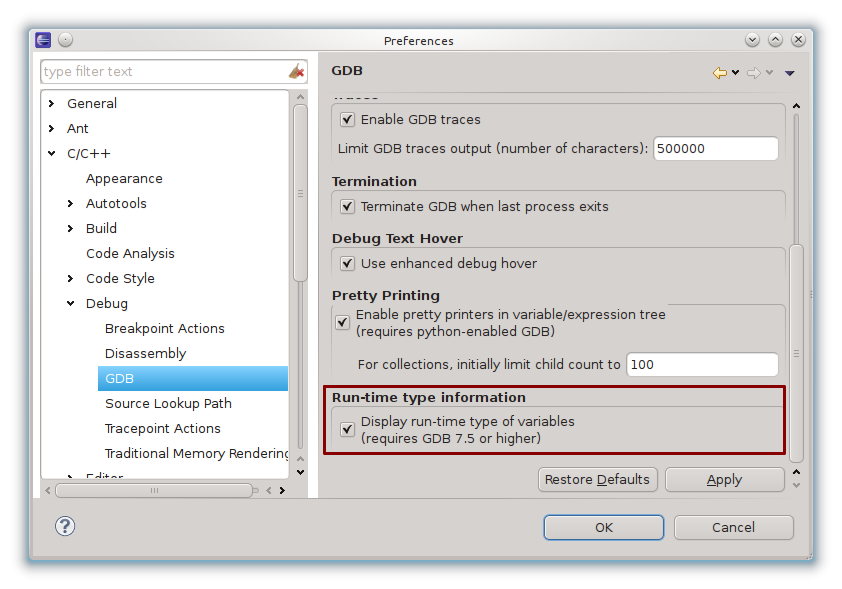
This feature is enabled by default and will work if you have the proper GDB version (7.5.1 or higher) and RTTI generation enabled (enabled by default in gcc), however it could be turned off in preferences:
Note that a bug was found in GDB 7.5 which could affect the display of other variables or registers. GDB 7.5.1 should be used with this feature.
Project-less debugging
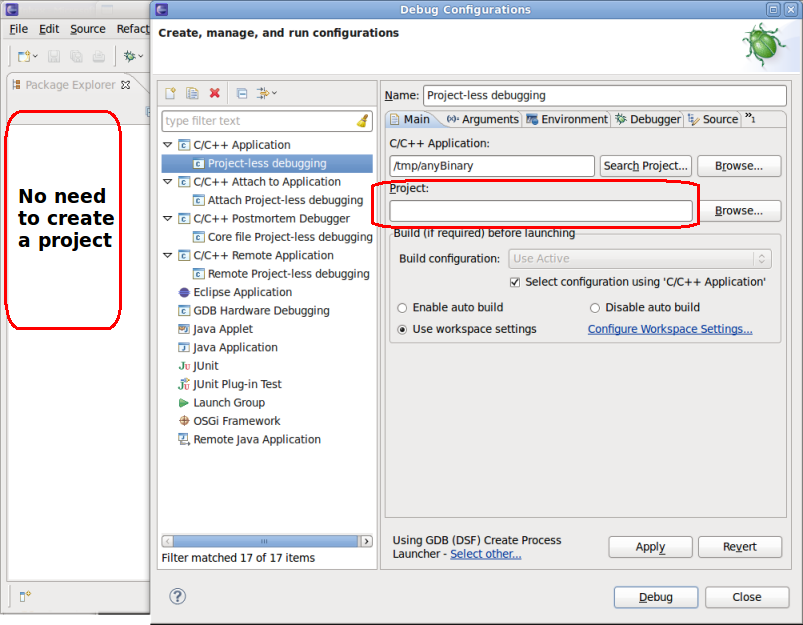
CDT can now be used to debug any binary, without needing to specify or even create a project in Eclipse. This is supported for all types of debugging (local, remote, attach, and post-mortem sessions).
Furthermore, for an attach session (local or remote), there is even no need to specify the binary; for a local attach, GDB can find the binary automatically, while for a remote attach, CDT will prompt for it when it needs it.
Support for full pretty-printing of complex structures
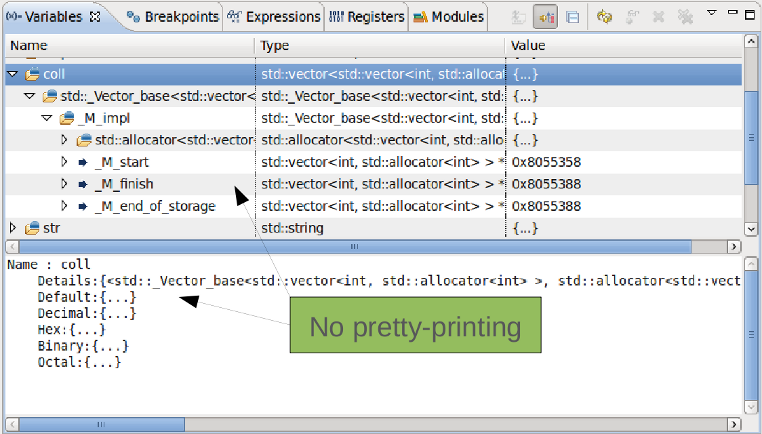
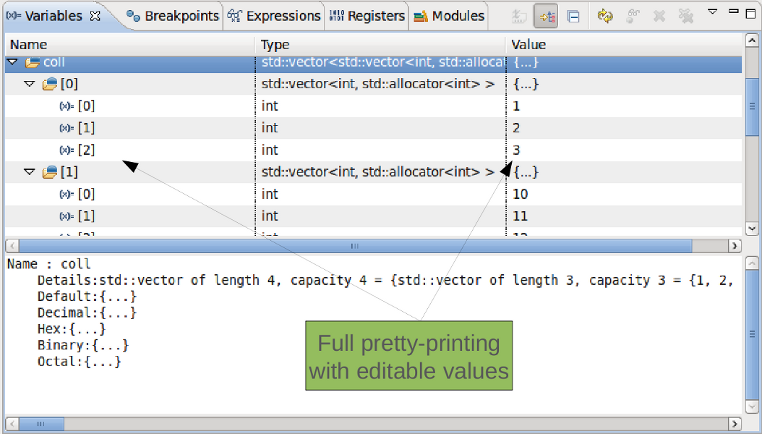
With the proper setup of GDB, DSF-GDB will now print complex structures such as Maps, Lists and Vectors, in a user-friendly fashion, within the Variables and Expressions views, as well as the advanced Debug hover of the Editor. See below on how to setup GDB for this feature to work.
Without pretty-printing:
With pretty-printing:
Configuring GDB for pretty-printing:
- You will need to have python installed on your machine
- If you want to pretty-print STL structures, you will need the Python pretty-printers for STL. Check-out the latest Python libstdc++ printers to a place on your machine. (Note that you can create your own pretty-printers for any complex-structure). In a local directory, do:
svn co svn://gcc.gnu.org/svn/gcc/trunk/libstdc++-v3/python
- You will need to create a gdbinit file to tell GDB where the pretty-printers are. Create a gdbinit file with the following 6 lines. The path needs to match where the python module above was checked-out. So if checked out to: /home/marc/gdb_printers/, the path would be as written in the example:
 python
import sys
sys.path.insert(0, '/home/marc/gdb_printers/python')
from libstdcxx.v6.printers import register_libstdcxx_printers
register_libstdcxx_printers (None)
end
- You will need GDB 7.0 or later. GDB 7.2 is recommended because it has some bug fixes for the pretty-printing.
- In your DSF-GDB launch, make sure you use the right GDB and the right gdbinit file
Multi-process Debugging
Ericsson sponsored a joint CDT/GDB feature to allow users to debug multiple processes with the same GDB and Eclipse debug session.
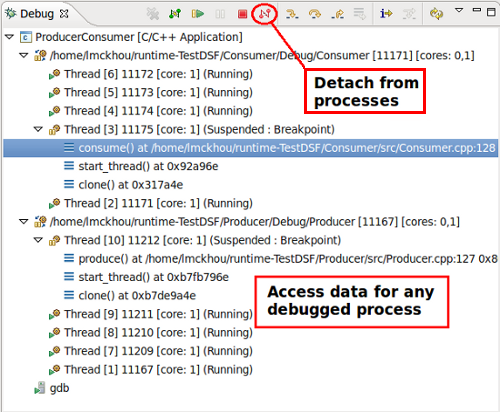
CDT now supports debugging multiple processes in a single debug session. It allows to attach/detach and start/stop processes repeatedly and easily.
Requirements:
- GDB 7.2 or greater
- Currently, only Non-Stop debugging sessions support multiple processes.
- Note that this feature was developed and tested on Linux systems, and may not work on Windows.
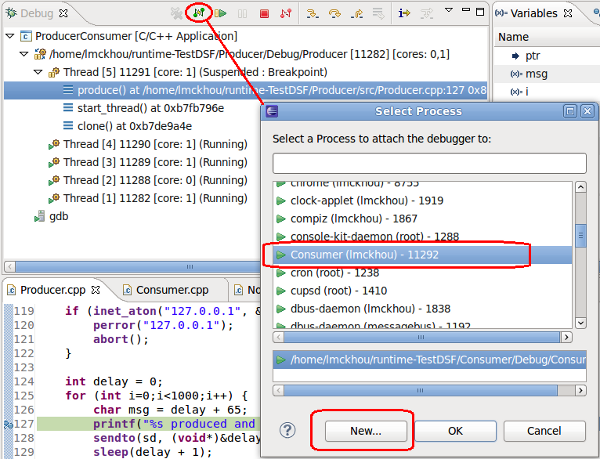
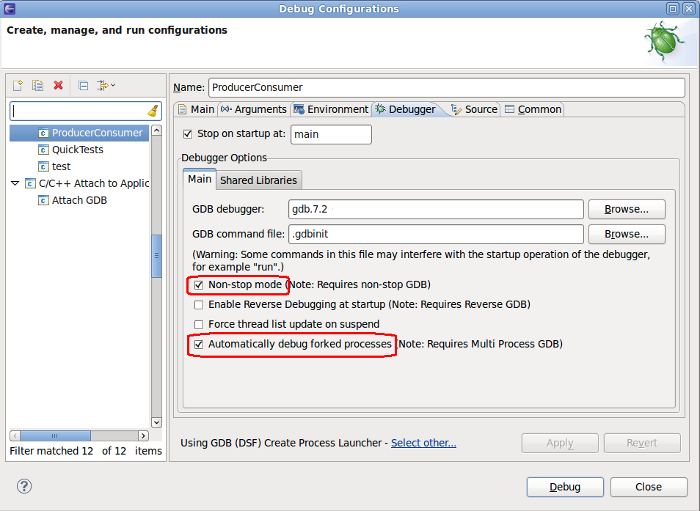
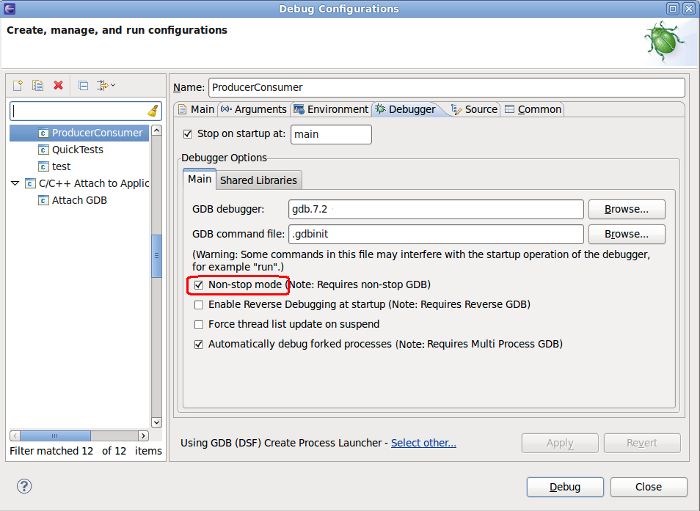
To use multi-process debugging, simply launch an application as you normally would, locally or remotely, using gdbserver, and make sure to select Non-stop mode in the Debugger tab. Then, use the Debug View's "Connect" button to trigger a dialog with allows you to either attach to a running process, or to create a new process using the "New..." button. Currently, the "New..." button is only supported for Local debug sessions.
You will then have the newly selected process added to your debug session, where you can control it and examine it. You can use the "Disconnect" button to remove processes from your debug session, or you can use the "Connect" button to add new ones.
An option to automatically attach to a forked process is also available. This means that whenever any process you are currently debugging forks a new process, that new process will be added to your debug session.
Pin & Clone
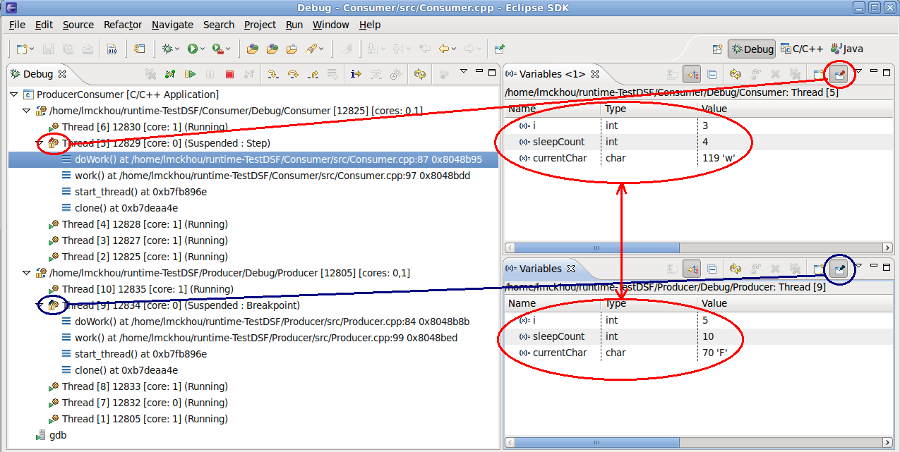
Variables, Expressions, Registers, Disassembly, and Memory Browser now supports opening multiple instances, and pin the view input to the selected debug context(s) in the Debug view. This can be used, for example, to easily compare the data of different threads.
Showing cores in Debug view labels
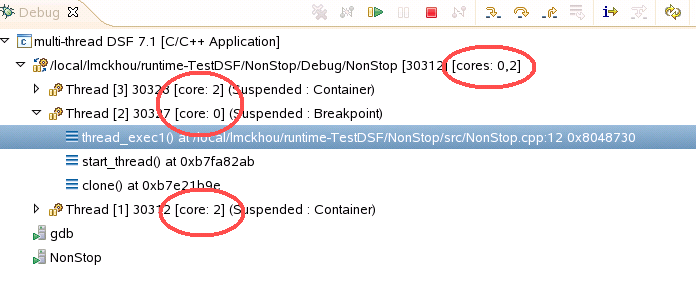
Ericsson sponsored a joint CDT/GDB feature to provide information about on which cores each thread runs.
By using the enhancements of GDB 7.1, CDT now shows the core on which each thread runs as an extra part of the Debug View label. The list of all cores on which a process is located is also added as a label. The below image shows the new feature.
Showing cores and owner in attach prompter
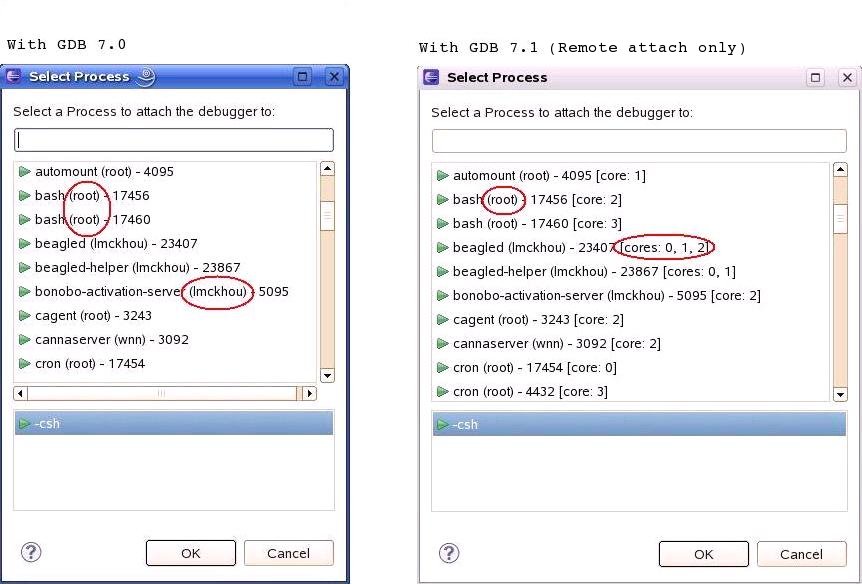
Ericsson sponsored a joint CDT/GDB feature to provide information about cores/owner for a process.
CDT now shows the owner of a process as an extra part of the process prompt for an attach session. The owner id will be shown starting with GDB 7.0. For a Remote attach session (using gdbserver --multi), the cores on which a process is located will also be shown. Showing the cores starts with GDB 7.1. The below image shows the new feature.
C/C++ Remote Application launch
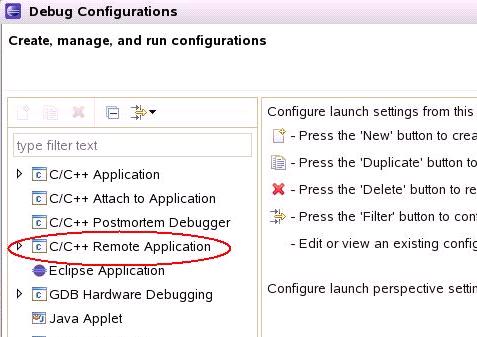
The optional "C/C++ Remote Application" launch configuration type has been made permanent for CDT.
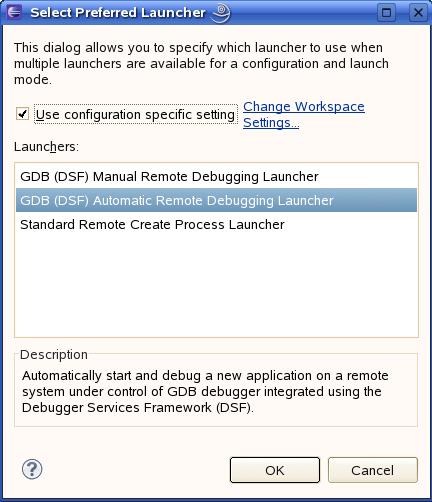
The "GDB (DSF) Remote System Process" launch delegate has been renamed to "GDB (DSF) Manual Remote Debugging" and has been moved from "C/C++ Application" to "C/C++ Remote Application". As was the case for CDT 7.0, the optional RSE Remote Launch delegate of org.eclipse.cdt.launch.remote, is still part of "C/C++ Remote Application".
This optional remote launch now provides a new DSF-GDB-based launch delegate called "GDB (DSF) Automatic Remote Debugging". This launch is very similar to the existing "GDB (DSF) Manual Remote Debugging" delegate, except that the automatic one will automatically download the application to the remote target and start gdbserver with the application.
By default, the user will be shown the "GDB (DSF) Manual Remote Debugging". However, if the optional feature of Remote Launch is installed, the default will automatically become the more feature-rich "GDB (DSF) Automatic Remote Debugging".
Finally, the run-mode RSE Remote Launch delegate no longer shows the Debugger or Source tabs, since they were not relevant, in run-mode.
Reverse Debugging
Ericsson sponsored a joint CDT/GDB feature to provide Reverse debugging, where MI commands were added to GDB to access the Reverse Debugging logic.
CDT Debug supports Reverse Debugging. This is a GDB feature that allows you to not only execute your binary forwards, as expected, but also backwards, reverting all memory and registers to their previous values. This feature is only supported by GDB for Linux at the time of writing.
CDT provides an enable/disable Reverse debugging button. When that button is pressed, GDB will start recording every memory and register change. Once the button is unpressed, all recording will be discarded. Also, when that button is pressed, the other Reverse debugging buttons will appear, allowing you to do:
- Reverse Resume
- Reverse Step-into
- Reverse Step-over
- Reverse Step-return
Non-stop Debugging
Ericsson sponsored a joint CDT/GDB feature to provide Non-stop debugging.
When using GDB 7.0 or later, CDT allows to choose between Non-stop debugging and All-stop debugging. Non-stop debugging allows each thread of a debug session to be controlled independently. This allows to stop one or more threads while leaving others running. In contrast, All-stop mode interrupts and resumes all threads at the same time.
Non-stop mode is useful when you are not interested in some threads and prefer to leave them running. For example, a heartbeat thread or a watchdog thread may need to keep running while other threads are being inspected.
Choosing between Non-stop and All-stop mode is done per launch in the Debugger subtab. You will require GDB 7.0 or later.
Support for pending breakpoints
When a breakpoint is set in a dynamically-linked library that was not loaded yet, the breakpoint will now work, once the library is loaded. This feature is currently only supported when using GDB 6.8 or later.
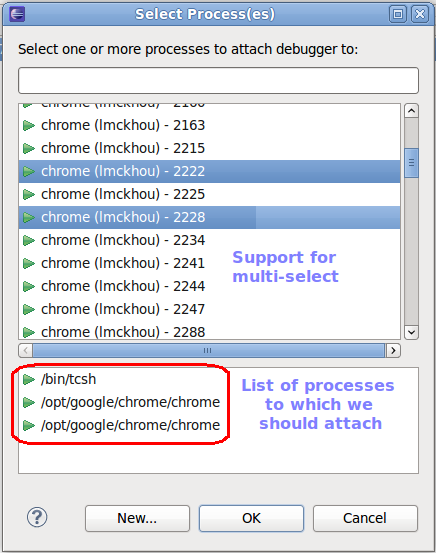
Multi-select attach dialog
CDT now allows selecting more than one process to attach to in a single user operation. The bottom pane is used to see which processes have been selected. If multi-process debugging is not supported with your debug session (needs GDB >= 7.2 and NonStop enabled), only the first process will be attached to.

