Notice: This Wiki is now read only and edits are no longer possible. Please see: https://gitlab.eclipse.org/eclipsefdn/helpdesk/-/wikis/Wiki-shutdown-plan for the plan.
Adding new advanced chart types in BIRT
My project for this year's Google Sommer of Code will be to contribute new chart types for the BIRT project.
Contents
Personal Details
Name: Karsten Knese
E-mail: Karsten.Knese@web.de
Skype: kook1987
Mentor: Ahti Kitsik
Full proposal: Proposal
Abstract
As there were some request about new chart types for BIRT the goal of my project is to add three new chart types.
- donut chart
- venn diagram
- radar diagram
Description
BIRT already provides several chart types for designing customs reports. I found some open bugs and help-wanted entries in bugzilla.
Donut chart
This chart will be implemented based on the existing pie chart.
Radar diagram
This chart shows data information grouped by categories.
Venn diagram
This chart shows similarities and differences of several datasets.
Project plan
Here you can find the timeline for this project including all milestones.
| Milestone | Date | Description |
|---|---|---|
| M1 | June 07 | Getting organizational things done like SVN repository etc. |
| M2 | June 10 | Creating base frame for all three chart types. Interface and associated implementation class |
| M3 | June 14 | Clear which classes of the existing BIRT source have to be patched |
| M4 | July 5 | Implementing donut chart based on the existing pie chart |
| M5 | July 13 | Testing donut chart - 'Pencil down' for midterm evaluation |
| M6 | July 26 | Implementing radar chart |
| M7 | August 10 | Implementing venn diagram |
| Pencil down | August 17 | Integrating source into BIRT source, do final documentation |
Availuable Features
| M1 SVN Repository |
Source code is hosted at google code for eclipse foundation project. Later it will be integrated in BIRT. Here you can find the repository and additional information. |
| M2 Base frame |
Source contains interfaces and implementation classes for the base series definition of all three types. TODO: Check howto write plugin in a way, it is totally independent and can be connected with extension points. |
| new chart types | 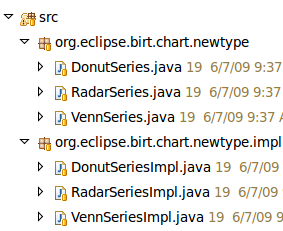
|
| M3 Rendering classes |
This is a list of classes which has to be implemented. Cause the first chart - donut chart - is based on the existing pie chart, the list shows the existing classes of the pie chart.
|
| M3 Donut Chart |
A few screenshots of the implemented donut chart. Functions are the same as the already existing Pie chart. |
| Donut chart compilation | 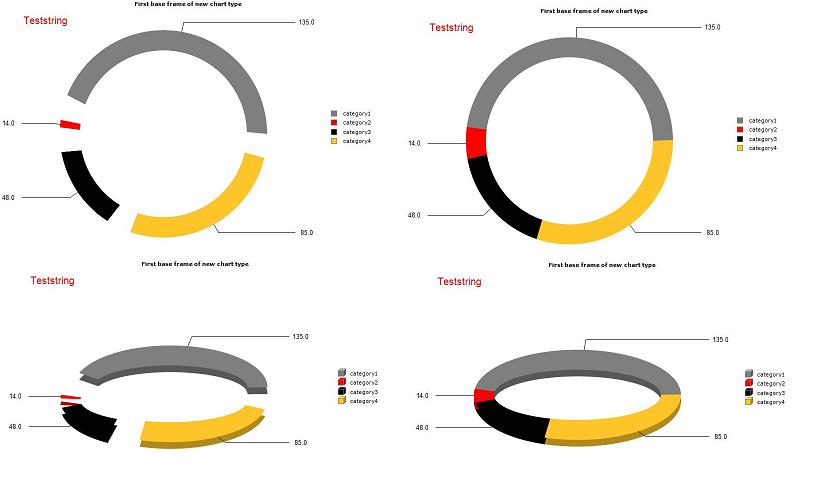
|
| M3 Venn diagram |
A few screenshots of the implemented venn diagram <br\>
There are a few restrictions:
There are a few featues:
|
| 2D Venn with 3 Datasets | 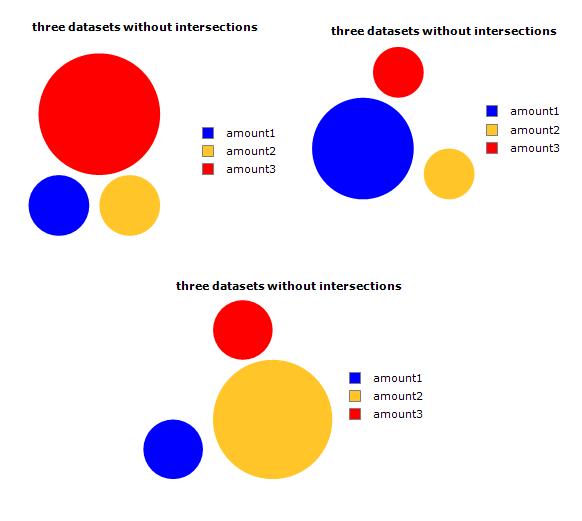
|
| 2D Venn with one intersection | 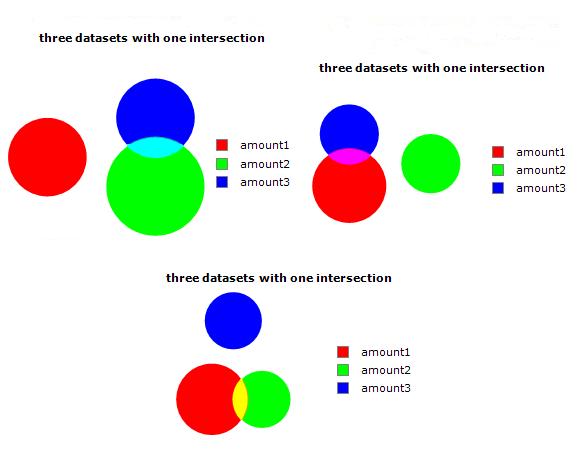
|
| 2D Venn with two intersections | 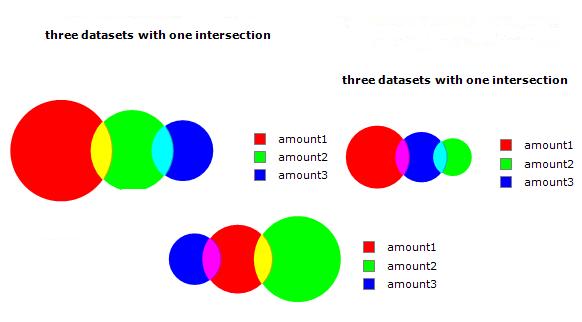
|
| 2D Venn with three intersections | 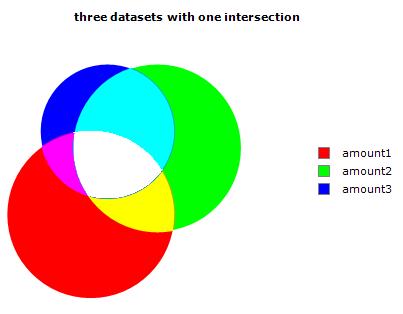
|
| 2D Venn with 3 Datasets | 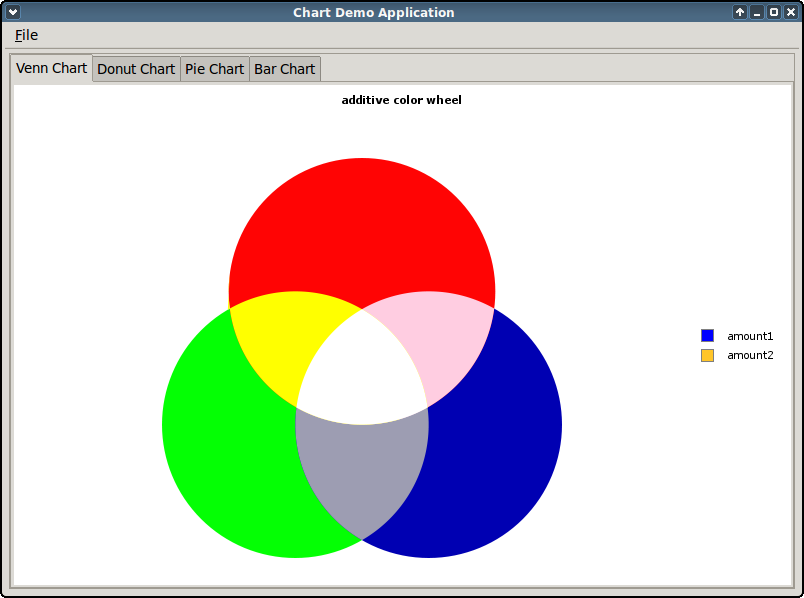
|
Next steps
Fixing dataset implementation labeling datasets
Comments, suggestions, ideas
I'm proud to take part in GSoC 2009. As it is my first project I'm happy about every help.
So feel free writing every comments you have. :)
